Nominating Kevin Warsh as Fed Chair would be the latest way Trump reneged on promises to put workers’ interests over financial elites
A consistent drumbeat in Donald Trump’s campaign for the presidency was a promise that he would stand up for the American working class against financial elites who had rigged policy to enrich themselves, a message that clearly resonated with some voters. He has reneged on this commitment in virtually every area of public policy, including providing better health care coverage than Obamacare, crafting better trade agreements, making sure tax cuts go to the middle class, and standing up for workers’ rights at work.
This month, workers who supported Trump may see another betrayal. It has been reported that Trump may pick Kevin Warsh, who married into a billionaire family, to replace Janet Yellen as the next Chair of the Federal Reserve Board of Governors (BOG). Decisions made by the Fed’s BOG are extraordinarily important for American workers. In recent years, pressure has built for the Fed to begin applying the brake to America’s economic recovery by raising interest rates. The rationale for this is that the Fed must slow growth to tamp down inflationary pressures. Warsh has consistently been on the side advocating for slowing growth to fight inflation. But these inflationary pressures appear nowhere in either wage or price data. And if the Fed hits the brake prematurely, millions of Americans could lose opportunities to work, and tens of millions could see smaller wage increases.
One underappreciated aspect of raising interest rates is that they will put upward pressure on the value of the U.S. dollar, and this stronger dollar will make U.S. exports less competitive on world markets while making foreign imports cheaper to American consumers. This will in turn lead to rising trade deficits which stunt growth in manufacturing employment. Warsh knows about this argument, but he just doesn’t really care.
“I would say that the academy’s view, the broad view of folks at the IMF and economics departments at elite universities, is that if only the dollar were weaker, then somehow we’d be getting this improvement in GDP arithmetic, we’d have an improvement in exports and we’d be getting much closer to trend. That’s not a view I share. My own views are that having a stable currency, now more than ever, provides huge advantages to the U.S. The U.S. with the world’s reserve currency is a privilege, but it is a privilege that we can’t just look to history to remind us of; it’s a privilege we have to earn and continually re-earn. And so it does strike me that those that think that dollar weakness, made possible by QE as one channel for QE, is the way to achieve these vaunted objectives are going to be sorely disappointed.”
What to Watch on Jobs Day: The teacher gap, the hurricanes, and how we know slack remains
Tomorrow, the Bureau of Labor Statistics will release September’s numbers on the state of the labor market. As usual, I’ll be paying close attention to the prime-age employment-to-population ratio (EPOP) and nominal wages, which are two of the best indicators of labor market health. There will likely be discussion of whether or how September’s storms affected the data, and I lay out some those issues below. Last, Friday’s report will give us a chance to examine the “teacher gap”—the gap between local public education employment and what is needed to keep up with growth in the student population.
Falling unemployment
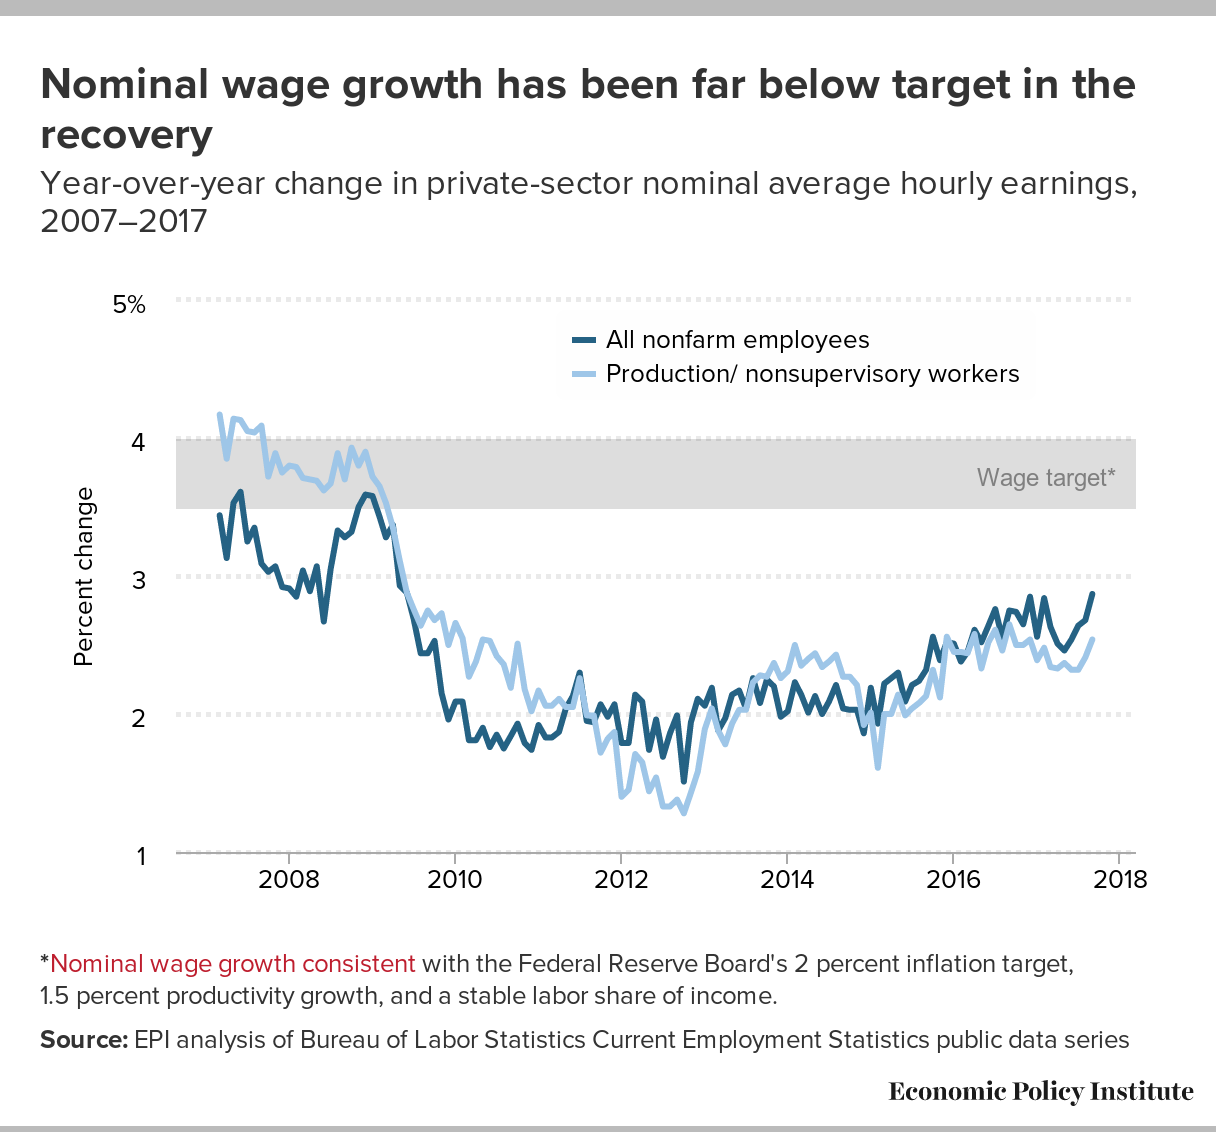
The unemployment rate has fallen steadily over the last seven years, and many have said that the current rate of 4.4 percent means we are back (or at least very close) to full employment—meaning that pushing unemployment any lower would cause inflation to accelerate above the Federal Reserve’s preferred 2 percent target. That is why some observers are calling upon the Fed to continue to raise rates, even though low unemployment has not translated into consistently strong nominal wage growth for workers across the economy.
The unemployment rate is only one indicator of labor market health—and other indicators, like the prime-age employment-to-population ratio (EPOP), suggest an economy with a fair amount of slack. When the economy first hit its current 4.4 percent unemployment rate in April 2017, I noted that, historically, an unemployment rate of 4.4 percent was associated with higher participation and employment in the labor market. In fact, based on the relationship between unemployment rates and prime-age EPOPs in the last two business cycles, the current prime-age EPOP of 78.4 should be 2.3 percentage points higher (80.7 percent). Unfortunately, its current rate is still below its lowest level in the last full business cycle. Nominal wage growth is another key indicator of labor market health. Year-over-year nominal wage growth has remained at 2.5 percent for the last several months, below target levels and where it would be expected in a stronger economy.
All told, the Fed was correct to resist further rate increases in their September meeting. Reaching genuine full employment should be the main concern of the Fed so that workers—white and black, young and old—see the benefits of tight labor markets in their job prospects and wages.
What to watch out for in Trump’s speech on regulation later this morning
President Trump is scheduled to give a speech later this morning about his administration’s regulatory agenda. Given the administration’s statements and actions since Trump took office in January—one of his first actions after taking office was to issue an executive order requiring federal agencies to identify at least two existing regulations to “repeal” when proposing a new regulation—there is little doubt about what any speech by this president on regulation will contain.
Watch for false claims that government regulations cost jobs. The truth is that research on the relationship between employment and regulations generally finds that regulations have a modestly positive, or simply neutral, effect on employment. Though regulations sometimes reduce jobs in one area, they create jobs in another. For example, factories making lead paint shut down after regulations banning lead paint were issued in the late 1970s, but enterprises manufacturing lead-free alternatives arose in their place. And some of the older factories hired people to retool their machinery to begin manufacturing lead-free paint. Importantly, the lack of sensible regulations can do major damage to the economy and cost jobs. One recent, devastating example was the housing bubble, and the financial and economic crisis of 2008 and 2009 that ensued when the bubble burst, resulting in the loss of nearly 9 million jobs. Deregulation and lax enforcement based on the belief that financial markets could “self-regulate” played a major role in this crisis.
Watch for false claims that the costs of regulation outweigh the benefits. The truth is that while there are costs associated with regulations, they tend to be dramatically outweighed by benefits—federal regulations typically provide huge net benefits (benefits minus costs) to society. Federal agencies are required to undertake a cost-benefit analysis when issuing a major rule, and each year the Office of Management and Budget (OMB) reports to Congress on the costs and benefits of federal regulations. In its most recent report, OMB found that during the last administration, from January 21, 2009, to September 20, 2015, the estimated annual net benefits of major federal regulations was between $103 and $393 billion. In other words, these regulations are providing an overall benefit to society of over $100 billion per year.
Janus is the latest attack on workers’ rights to organize and bargain collectively
Today, the U.S. Supreme Court announced that it will hear Janus v. AFSCME, a case that could profoundly affect the ability of public-sector workers to improve their wages and working conditions. The case threatens the right of the majority of workers, through their democratically elected union, to bargain a contract with their public employer that requires every employee covered by the contract to pay their fair share of the costs of negotiating it, administering it, and enforcing it. The Court decided this issue forty years ago in Abood v. Detroit Board of Education and it has been the law of the land since.
Janus is nothing more than the latest attack on workers’ rights to organize and bargain collectively. The Court considered this issue last term in Friedrichs v. California Teachers Association, which resulted in a 4-4 split decision upholding a lower court decision that permits public employee unions to assess fees on non-members who benefit from collective bargaining and union representation and who unions are required to represent. In any other circumstance, it would be outrageous to demand the benefits of a common enterprise without paying one’s fair share. Union representation is no different. Eliminating fair share fees protects people who want to get something for nothing and as a result, starves unions.
It is profoundly undemocratic to elevate the objections of a minority over the democratically determined choices of the majority of workers. This principle is what is at stake in Janus. The decision in this case will determine the future of effective unions, democratic decision making in the workplace, and the preservation of good, middle-class jobs in public employment.
Fixing education inequalities will require fixing broader societal inequities
Every serious education research study concludes with a series of recommendations for further research and implications for education policy. Our recent paper comparing skills gaps among kindergartners an “academic generation” apart is no exception. What is perhaps different is how important we think major changes to policies outside the realm of education are to improving the education system itself.
In Reducing and averting achievement gaps, we show that there was a large gap in preparedness between high and low social class students who began school in the fall of 2010. Furthermore, this gap changed very little over the prior twelve years. And it’s not only a matter of math and reading skills—there are similar gaps in social and emotional skills, which interact with and inform those traditional academic abilities.
We recommend that our counterparts in the field take up questions that arose in the course of conducting this work—like, to what degree do these gaps persist and change as children progress through elementary school and beyond, and what explains the lack of change over the past decade?
The third part of our paper draws on studies of a dozen communities that have embraced a range of strategies to mitigate the impacts of poverty at the district level—including very early support for children and their families, efforts to engage parents as partners in their children’s education, pre-K and improved kindergarten transitions, enriching, whole-child curricula, and wraparound health and nutrition services through the K–12 years. Our case studies highlight how feasible, and successful, this kind of comprehensive enrichment and support can be.
A leopard can’t change its spots: Newest Republican tax framework is what we knew it always would be—tax cuts for the rich.
The framework of the Republican tax plan was released today. In recent months, architects of the plan repeatedly promised that they had no “intention” to release a tax plan that disproportionately cut the taxes of the rich. Some too-credulous writers repeatedly chastised those of who thought that past Republican plans would provide a decent roadmap for the future and pre-emptively warned about all of the creative ways their new plan would likely try to cut the taxes of the rich. So, did Republicans unexpectedly veer and deliver a “middle-class tax cut”?
Nope.
They have once again rolled out a tax plan that is basically the same as all their previous tax plans. Not only does it deliver big tax cuts for the rich, it actually pretty creatively ensures that the crumbs that fall to the middle class will be as small as possible.
The most obvious giveaways to the rich are a reduction in the top individual rate to 35 percent and a cut in the top corporate rate to 20 percent. As we’ve noted before, cuts to corporate rates are cuts to the rich, period.
But these are just the most-obvious tax cuts for the rich.
Contradicting their claims to simplify the tax code, Republicans are adding loopholes. Anybody who studies taxes knows that they are not complicated because of the rates—you look those up in a table after you’ve done the hard part of wrestling with deductions and exclusions. So making 7 rates into 3 does nothing to deal with the complexity of the tax code. But adding further loopholes for the rich and big corporations does exacerbate the code’s complexity and unfairness.
One of their more egregious loopholes is hidden behind rhetoric about helping “small business.” The loophole caps the rate that individuals must pay on “pass-through” income at 25 percent. The first thing to note about this is that there is no small business tax code. Small business owners pay nothing at the business level, but then simply pay taxes on profits they take home on their individual income tax forms, just like you and I. So, the new tax rate does not cut taxes on small businesses. Instead, it cuts individual tax rates on small business owners who currently are in tax brackets above 25 percent. This is an extremely small share of all small business owners (less than 3 percent of all tax units are above the 25 percent tax bracket). So, this carve-out does not serve genuine small businesses, but instead serves only to ensure that rich households won’t have to actually pay the top individual tax rate on money they earn from “small businesses” like hedge funds and law firms, but can instead pay a lower 25 percent.
Supreme Court should uphold working people’s fundamental rights in Murphy Oil
Today, EPI released a new paper by Cornell professor Alexander J.S. Colvin, which shows that more than half of all private sector non-union workers are currently subject to mandatory arbitration agreements—denying them access to the court system to resolve workplace disputes. Colvin also found that 41 percent of employees subject to mandatory arbitration also have waived their right to pursue work-related claims on a collective or class basis. Next week, the Supreme Court will consider whether arbitration agreements that include class and collective action waivers of all work-related claims are prohibited by the National Labor Relations Act (NLRA). The Court is scheduled to hear argument in National Labor Relations Board v. Murphy Oil USA (along with two other cases Ernst & Young LLP v. Morris and Epic Systems v. Lewis) on October 2.
The NLRA guarantees workers the right to stand together for “mutual aid and protection” when seeking to improve their wages and working conditions. Employer interference with this right is prohibited. However, as Colvin’s report shows, employers are increasingly requiring workers to sign arbitration agreements that force them to waive their rights to collective actions and instead handle all workplace disputes as individuals. In practice, that means that even if many workers faced the same type of dispute at work, each individual employee must hire their own lawyer, and must resolve their disputes out of court, behind closed doors, with only their employer and a private arbitrator.
The National Labor Relations Board (NLRB) first reviewed arbitration agreements with class and collective action waivers in D.R. Horton, Inc. (357 NLRB No. 184 (2012)) and found that these forced arbitration agreements interfere with workers’ right to engage in concerted activity for their mutual aid and protection, in violation of the NLRA. Corporate interests and the Trump administration—in a stark departure from the position taken by the Obama administration Department of Justice—are fighting the NLRB. They are focusing their argument on the Federal Arbitration Act (FAA), which requires courts to enforce arbitration agreements, subject to contract defenses. However, the Supreme Court has never enforced an arbitration agreement that violates another federal statute—as the arbitration agreements here violate the NLRA by requiring workers waive their fundamental right to join together to address workplace disputes. Still, that is what corporate interests arguing against the NLRB are asking the Court to do in this case. If they succeed, they will, as the NLRB argues in its brief, be using “private contracts to eviscerate the public rights Congress protected in the NLRA.”
Graham-Cassidy: Maybe the worst Republican health proposal yet
The first plan the House of Representatives put forward to repeal the Affordable Cart Act (ACA) was the American Health Care Act (AHCA). The Congressional Budget Office projected that the AHCA would cost 24 million Americans their health insurance coverage by 2026. An amended version, which passed the House, cut this number to 23 million. Besides inflicting these coverage losses, the AHCA would have cost jobs and increased out-of-pocket costs faced by Americans.
The second plan, the Better Care Reconciliation Act (BCRA) failed narrowly in the Senate. The CBO projected that the BCRA would have cost 22 million Americans their coverage by 2026. On one hand, it may have seemed like progress of some kind to reduce the number thrown off the insurance rolls relative to the AHCA, but the BCRA back-loaded severe cuts to Medicaid beyond the budget window that CBO traditionally examines. This means that in the longer run, the BCRA would have been even more destructive to health security than the House-passed plan. Additionally, unlike the AHCA, the BCRA cut not just the expansions to Medicaid passed under the ACA, but cut deeply into traditional, pre-ACA Medicaid, shifting the burden of paying for health care onto states and/or poor households.
Think of the latest Republican entry, known as Graham-Cassidy, as the BCRA on steroids. After the CBO budget window passes, Graham-Cassidy is not a “repeal-and-replace the ACA” plan. It’s not even a straight “ACA repeal” plan. Instead, it’s a plan that repeals the ACA and cuts Medicaid over and on top of that. It’s, in short, an attempt to rollback not just the ACA, but even the coverage provided by the pre-ACA American health care system.
Just to remind everybody, this pre-ACA coverage system was unraveling at a rapid rate, with roughly 15 million workers losing employer-based coverage between 2000 and 2010.
An evidence-based Fed would hold rates steady in September
The Federal Open Market Committee (FOMC) meets today and tomorrow to determine whether or not to raise interest rates. The FOMC has raised rates three times since December 2016. The evidence arguing that these increases were wise or necessary was thin at best. That rationale for raising interest rates is to rein economic growth that threatens to drive down unemployment so low that workers will be empowered to achieve unsustainably large wage increases. The worry is that such wage increases could push price inflation over the Fed’s target rate.
But the real-world data that exists on every link of this causal chain shows that such worries are baseless. Economic growth in recent quarters is depressingly slow, not fast. Unemployment rates are in the low-end of historical experience, but have been lower (without wage or price inflation) several times in recent years. Other measures of labor market slack show the economy is far from recovered. Wage growth shows little sign of accelerating to levels that would spark wage-price spirals.
The rate increase that happened in June was particularly dispiriting for those hoping the Fed would continue to follow the evidence-based approach largely adhered to under the reign of Janet Yellen as Fed Chair. The economic data going into that meeting gave plenty of reasons why a data-dependent Fed might worry that it was riskier to raise rates too high too soon than to stand pat for a couple of months. Yet the Fed raised rates.
Data since June has been much softer. The Fed’s preferred inflation measure has decelerated significantly, and any upward creep of wage growth has stopped. There just is no case for continuing to raise rates in the face of this data.
While the outcome of any single FOMC meeting is not crucial for the American middle class, what this week’s meeting signals for the commitment of the Fed to genuine full employment is crucial. History has shown that low and middle-wage workers in the United States only get consistent annual wage increases when the economy is near genuine full employment. For example, for two solid years in 1999 and 2000 the unemployment rate averaged 4.1 percent and spent a number of months below 4 percent. And the late 1990s are the only time in recent economic history when wage growth was strong across the wage scale.
2016 ACS shows stubbornly high Native American poverty and different degrees of economic well-being for Asian ethnic groups
Thursday’s release of 2016 American Community Survey (ACS) data allows us to fill in the blanks for race and ethnic groups that were not covered in Tuesday’s Census Bureau report on income, poverty, and health insurance coverage in 2016. ACS is an annual nationwide survey that provides detailed demographic, social, and economic data for smaller populations like Native Americans and the thirteen distinct ethnic groups that make up the Asian American population. For the sake of comparability, in this blog post, the national estimates of median household income and poverty that I refer to are from the ACS.
Between 2015 and 2016, the real median household income for Native Americans increased 1.8 percent to $39,719. This was 69 percent of the national average in 2016 and $1,194 (-2.9 percent) lower than the group’s 2007 pre-recession level. While this data comes from a different source than Tuesday’s data on household income and covers a slightly different survey period, it suggests that Native American median household income is similar to that of black households, but Native American households experienced much slower income growth than blacks over the last year. Despite the income gains, poverty among all Native Americans was virtually unchanged between 2015 and 2016 (from 26.6 to 26.2 percent) and 33.8 percent of Native American children lived in poverty in 2016—the same as in 2015. Both rates are similar to those reported for blacks in the Current Population Survey, though slightly higher. The rate of poverty among Native Americans was nearly double the national average for all people and 1.7 times higher for children.
Median household income for Native Americans and total population (2016 dollars), 2005–2016
| Native Americans | Total population | |
|---|---|---|
| 2005 | $40,959 | $56,850 |
| 2006 | $40,198 | $57,675 |
| 2007 | $40,913 | $58,733 |
| 2008 | $42,157 | $57,879 |
| 2009 | $39,583 | $56,195 |
| 2010 | $38,595 | $55,090 |
| 2011 | $37,554 | $53,875 |
| 2012 | $36,914 | $53,697 |
| 2013 | $37,752 | $53,834 |
| 2014 | $37,745 | $54,404 |
| 2015 | $39,066 | $56,481 |
| 2016 | $39,719 | $57,617 |

Source: Author's analysis of American Community Survey data 2005-2016
Share of people in poverty, Native Americans and total population, 2015 and 2016
| Native Americans | Total population | |
|---|---|---|
| 2015 | 26.6% | 14.7% |
| 2016 | 26.2% | 14.0% |
Source: Author's analysis of American Community Survey data, 2015 and 2016
Share of children in poverty, Native Americans and total population, 2015 and 2016
| Native Americans | Total population | |
|---|---|---|
| 2015 | 33.8% | 20.7% |
| 2016 | 33.8% | 19.5% |
Source: Author's analysis of American Community Survey data, 2012 and 2013
According to my prior analysis of Tuesday’s Census report, Asian Americans were the only group for whom the increase in real median household income between 2015 and 2016 was statistically insignificant, but like non-Hispanic white and black households, still had not recovered their 2007 income level. The 2016 ACS data shows the variance in income across the different Asian ethnic populations, as well as their disparate rates of recovery. In 2016, median household income among Asian ethnic groups ranged from $110,026 for Indians to $38,971 for the Burmese. Indians also had the most income growth since 2007 (13.4 percent), although eight of the fourteen ethnic groups with reported income in 2007 had surpassed their 2007 income level. The wide range of incomes and income growth across Asian ethnic groups are also generally reflected in differences in poverty rates. Three groups—Indians (7.6 percent), Filipinos (6.6 percent) and Japanese (8.0 percent)— had poverty rates of 8 percent or lower, while over one-fourth of the Burmese (29.3 percent) and more than one-fifth of the Bangladeshi (22.6 percent) and Hmong (21.7 percent) populations lived in poverty.
Median household income and share of population in poverty, various Asian populations, 2016
| Share of U.S. Asian population | Poverty rate | Change in poverty | Median household income | Change in income | |||
|---|---|---|---|---|---|---|---|
| 2016 | 2016 | 2007-2016 | 2015-2016 | 2016 | 2007-2016 | 2015-2016 | |
| Bangladeshi | 1.0% | 22.6% | -2.3% | 1.5% | $46,806 | -3.2% | -6.7% |
| Burmese | 0.9% | 29.3% | N/A* | -5.6% | $38,971 | N/A* | -2.8% |
| Cambodian | 1.5% | 16.1% | -4.7% | -3.7% | $58,391 | 0.1% | 4.9% |
| Chinese (except Taiwanese) | 24.2% | 15.6% | 3.6% | 0.1% | $72,827 | -4.3% | 1.7% |
| Filipino | 16.1% | 6.6% | 1.1% | 0.1% | $88,745 | -0.3% | 3.7% |
| Hmong | 1.6% | 21.7% | -4.2% | -2.5% | $57,496 | 9.7% | 6.4% |
| Indian | 21.9% | 7.6% | -0.5% | 0.1% | $110,026 | 13.4% | 4.7% |
| Indonesian | 0.4% | 10.1% | N/A* | -4.7% | $70,539 | N/A* | 24.8% |
| Japanese | 4.5% | 8.0% | -0.5% | -0.3% | $76,175 | -0.3% | 0.9% |
| Korean | 8.2% | 13.1% | -0.5% | -0.3% | $63,677 | 4.3% | -0.2% |
| Laotian | 1.2% | 10.4% | -2.1% | -5.4% | $58,772 | -5.8% | 6.9% |
| Nepalese | 0.9% | 19.6% | N/A* | -1.5% | $50,497 | N/A* | 14.7% |
| Pakistani | 2.6% | 15.4% | 1.7% | 1.6% | $73,157 | 8.5% | -1.1% |
| Taiwanese | 1.0% | 11.9% | 0.3% | -0.8% | $90,221 | 2.9% | -2.0% |
| Thai | 1.2% | 14.7% | 2.2% | -1.3% | $66,976 | 7.6% | 12.1% |
| Vietnamese | 10.3% | 14.0% | 0.6% | -0.5% | $62,958 | 0.6% | 1.9% |
* ACS estimates for Indonesian, Nepalese, and Burmese populations started in 2011.
Note: The margin of error is greater in the ACS estimates for small sub-groups, which might account for the large percent changes in median household income and poverty rates for some Asian populations across years.
Source: Author's analysis of American Community Survey data 2007-2016