What to watch on Jobs Day: No evidence for another rate hike
Data on employment and unemployment in February will be released this coming Friday by the Bureau of Labor Statistics. Notably, this is the last jobs official jobs data we’ll get before the Federal Reserve meets in two weeks to decide whether or not to follow up December’s quarter point interest rate increase with another rate hike.
Forecasters are expecting Friday’s report to show quite weak performance in February, driven in large part by the major snowstorms that hit the East Coast during the week when jobs data was collected. However, even aside from expected temporary weakness, Friday’s jobs report is extremely unlikely to provide any strong evidence that the December rate hike should be followed with another increase in two weeks when the Fed meets again. In fact, data since the December hike contain mixed messages at best regarding the pace of recovery.
For example, after the December rate hike, data was released showing that gross domestic product grew at less than a 1 percent annualized rate in the last three months of 2015. Other data showed that the employment cost index, a closely-watched indicator of trends in labor costs pressure, grew just 2 percent year-over-year for the last quarter of 2015. And job growth in January was 151,000, down from the average monthly rate of 228,000 that the economy saw in 2015.
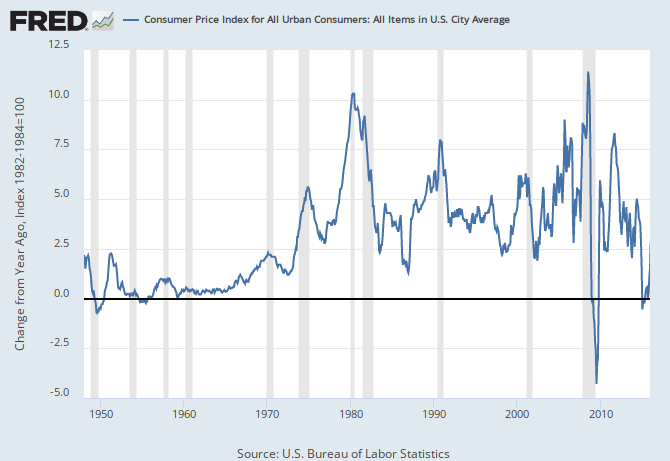
There have been encouraging (but quite small) upticks in some other economic data. Retail sales were strong in January. Core price inflation as measured by the consumer price index grew year-over-year in January at 2.2 percent, the fastest rate since 2012. (though Dean Baker highlights the role of rental price inflation in driving this, and the fact that attacking rental price inflation with higher interest rates is a flawed strategy).
Inflation makes proposed minimum wage increases more modest than they appear
This November, voters in several states will consider ballot measures to raise their state minimum wages. Because all of the proposals would incrementally phase in the higher minimum wages over a period of several years, it is important to look beyond the headline dollar amounts proposed, and consider what the new minimum wages would equal for someone in today’s economy. In other words, voters should evaluate proposed minimum wages after accounting for the inflation that will likely occur as the increases are gradually implemented.
Of course, it’s impossible to know what future inflation is going to be, but a variety of forecasters in both the public and private sector do make an attempt. The table at the bottom of this post shows the schedule of proposed minimum wage changes in California (under two possible ballot initiatives), Colorado, the District of Columbia, Maine, and Washington. It also shows the value of each proposed minimum wage in constant 2016 dollars1 using three different forecasts for consumer inflation—projections for the Consumer Price Index (CPI-U) from the Office of Management and Budget (OMB), the Congressional Budget Office (CBO), and Moody’s Analytics.2
As the table shows, a $12 minimum wage in 2020—proposed in Colorado and Maine—would have a current dollar value between roughly $11 and $10.75, depending on whose projections for inflation you believe. In Colorado, where the minimum wage is currently $8.31, this amounts to a real (inflation-adjusted) increase of between 29 and 32.5 percent over the current minimum. In Maine, where the minimum wage is currently $7.50, the proposed hike amounts to an increase of roughly 43 to 47 percent after inflation.
How we can save $17 billion in public assistance—annually
This post originally appeared on TalkPoverty.org.
Note to conservatives: Want to know the best way to find savings in government assistance programs? Here’s a hint—it’s not by cutting nutrition assistance to working people who are struggling.
It’s by paying them fairly for their labor.
A new report from the Economic Policy Institute indicates that raising the federal minimum wage to $12 by 2020 would lift wages for more than 35 million workers nationwide and generate about $17 billion annually in savings to government assistance programs.
This report shouldn’t come as a surprise. In contrast to the stereotypes and lies about people with low incomes, the reality is that a majority of public assistance recipients either have a job or have an immediate family member who is working. In fact, 41.2 million working Americans—or 30 percent of the workforce—receive means-tested public assistance. Nearly half of them work full-time.
Not surprisingly, workers who receive public assistance are concentrated in jobs that pay low hourly wages, like the retail, food services, and leisure and hospitality industries. A majority (53 percent) of workers earning $12.16 per hour or less—or the bottom 30 percent of wage earners—rely on public assistance. As wages go down, the percentage of workers relying on public assistance gets higher: 60 percent of workers earning less than $7.42—only slightly higher than the $7.25 federal minimum wage—receive some form of means-tested public assistance. Overall, 70 percent of the benefits in programs meant to aid non-elderly low-income households—programs like food stamps, Medicaid, and the Earned Income Tax Credits—go to working families.
Republicans (and two Democrats) in Congress want to derail commonsense protections for workers
Dozens of Republican members of Congress and two Democrats—Collin Peterson (D-Minn.) and Brad Ashford (D-Neb.)—have signed a letter to Secretary of Labor Thomas Perez about the Department of Labor’s (DOL) proposed rule on overtime pay for salaried employees, calling on him “to reconsider moving forward with this rule as drafted.” Oddly, a good part of the letter complains about provisions that are not in the proposed rule “as drafted.” The signers should be thanking the secretary, rather than complaining.
In particular, the letter complains that even though the proposed rule makes no change in the current regulation’s “duties test,” which identifies whether an employee’s job duties are those of an executive, professional, or administrative employee who might be exempt from overtime pay, the secretary does not spell out his future intentions. The signers worry, for example, that DOL is considering a common-sense tightening of the test to limit exemptions to employees who spend most of their time engaged in exempt duties. (The current duties test allows exemption of employees who spend nearly 100 percent of their time doing routine chores such as serving customers, running a cash register, stocking shelves, sweeping floors, and cleaning bathrooms.)
But, for better or worse, that change is not in the rule “as drafted.”
Workers, and honest employers, need a strong OSHA
Every day, events remind us why Congress created and continues to fund the Occupational Safety and Health Administration (OSHA). Cranes collapsing in New York and Cincinnati, mill explosions in Georgia, a foundry worker crushed in Ohio, construction workers falling to their deaths throughout the United States. When OSHA was created in 1970, 14,000 workers were killed on the job. Today in a much larger workforce, the number of on-the-job fatalities is less than 5,000 a year. Workplaces are undeniably safer today, in large part because of the training and education OSHA has provided and required employers to provide, its grants to union and non-profit worker safety training programs, the mandatory health and safety standards and guidance it issues, and its enforcement efforts. But they aren’t safe enough. In addition to the toll of deaths, nearly 4 million work-related injuries and illnesses are reported each year, and many more go unreported.
Enforcement is essential because standards and rules mean nothing if they aren’t followed, and a stubborn minority of businesses just don’t care enough about their employees to work safely and protect them from known hazards. Even hazards we’ve known about for a thousand years are routinely ignored by greedy contractors trying to cut corners and squeeze more profit out of their employees’ work.
Nothing better illustrates why workers need a strong enforcement effort from OSHA than trenching violations, such as putting workers into ten-foot deep trenches in loose soil without shoring the sides or protecting them with a metal trench box. Year after year, two to three dozen workers are killed when trench walls cave in, burying them in tons of dirt and rock, crushing their lungs. A single cubic yard of soil can weigh up to 3,000 pounds, and a worker caught by a cave-in can die even when his heads is not buried.
The Fed shouldn’t accept the “new normal” without a fight
Federal Reserve Chair Janet Yellen is testifying before Congress today and tomorrow, where she will be fielding questions about the state of the economy following the Fed’s recent rate hike.
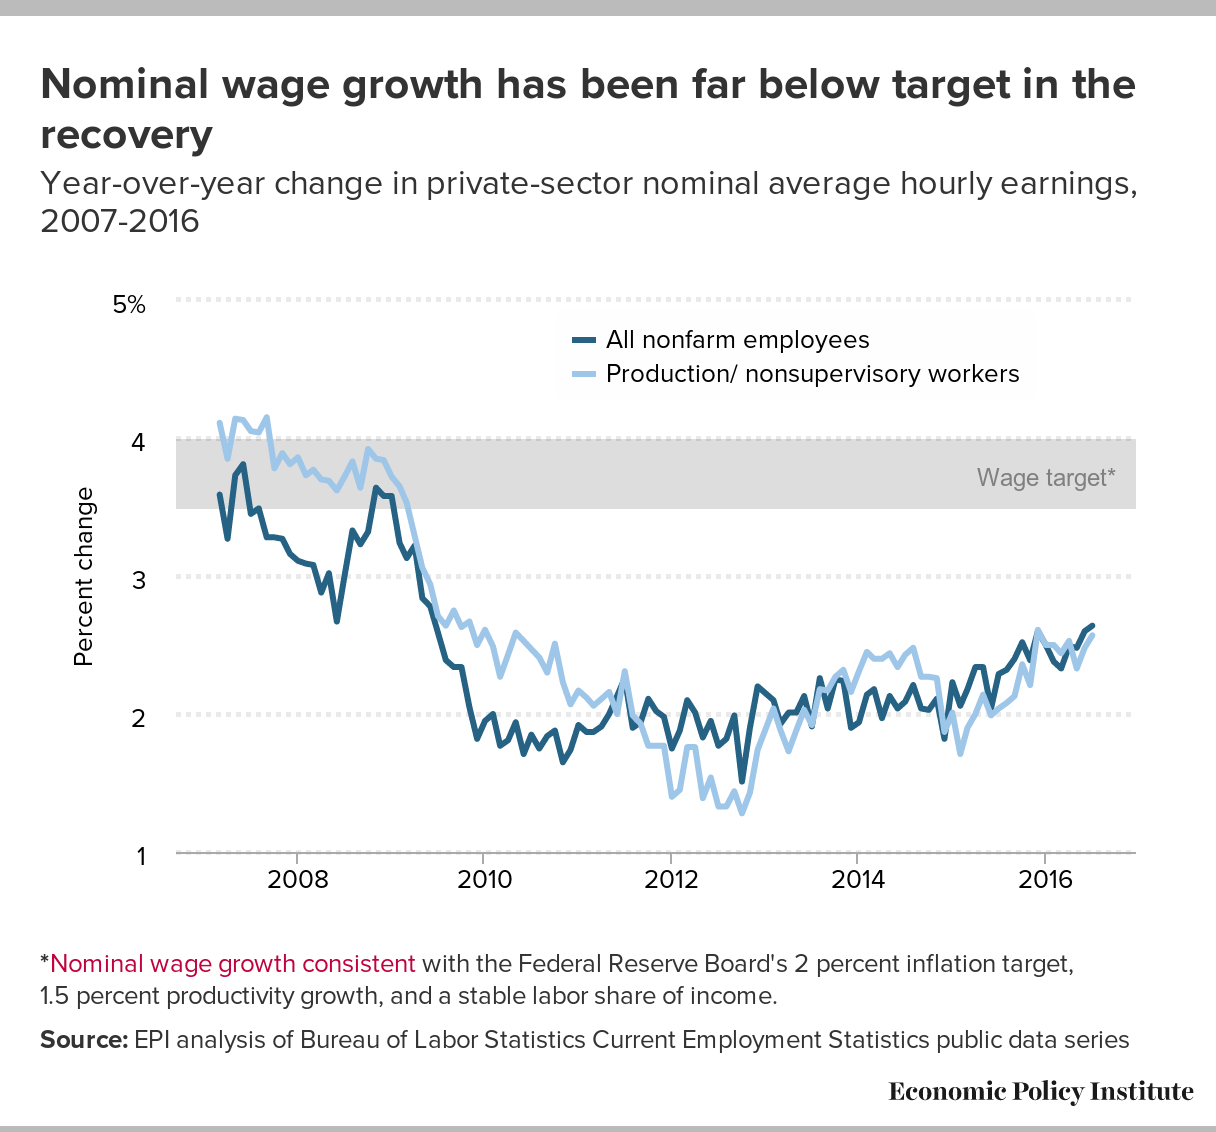
Despite steady progress on some fronts, the economy is far from healthy. Yes, the unemployment rate fell below 5 percent for the first time since 2008 in January. But wage growth is still far below what a healthy target would be, and a glaring new weakness has appeared in the economic data in recent years—a significant slowdown in the pace of productivity growth. Productivity is essentially the value of income and output produced in an average hour of work in the U.S. economy—it provides the ceiling on how high living standards can rise. Productivity growth also provides a buffer against inflationary pressures. If American workers can produce 2 percent more income and output in a given hour of work from one year to the next, this means their hourly wages can rise 2 percent without putting any upward pressure on costs at all (to walk through the intuition, remember that while labor costs per hour have risen 2 percent, output per hour has also risen 2 percent, so labor costs per unit of output hence remain flat). These effects on living standards and inflation make productivity slowdowns particularly worrisome.
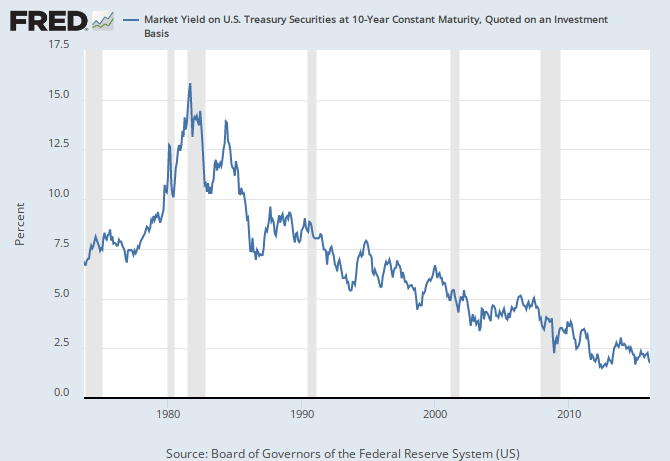
Historically, the combination of an unemployment rate low enough to spark Federal Reserve tightening and decelerating productivity growth would lead people to think that an overheating economy had pushed up inflation and interest rates, which crowded-out private sector investment. But this is definitely not the culprit behind recent productivity declines.
For one, interest rates and inflation remain historically low—and have shown no sign at all at lifting off the floor in recent years. It’s never been cheaper to borrow to make investments, so it’s not an overheating economy that has convinced private-sector firms to not invest.
So what has led to plunging productivity growth? It’s hard to know for sure, but we need to seriously consider the possibility that productivity growth (normally thought of by economists as a supply-side phenomenon) is just the last casualty of the chronic demand shortfall that brought on the Great Recession and which was never filled in sufficiently to push the economy back to full health.
When quitting is a good thing
This morning’s Job Openings and Labor Turnover Survey (JOLTS) report came in pretty much in line with other economic indicators that suggested a solid finish the 2015 labor market. Most notably, the hires and quits rates saw small upticks in December, a positive sign for an economy continuing to recovery. Unfortunately, those stronger results were somewhat tempered by January’s employment numbers, so the big question will be whether the upticks in today’s report will hold or will return back to their lower values. If these trends continue, it will mean we are still on the road towards full employment. Regardless, we need to stay on that road by encouraging the Federal Reserve to keep their foot off the brakes and encouraging policymakers at all levels of government to abandon austerity in favor of boosting local and state economies through increased investments and public sector employment.
While jobs day brings a whole series of great measures to analyze labor market slack, from the prime-age employment-to-population ratio to nominal wage growth, my favorite indicator on JOLTS day is the quits rate. A high quits rate is important because it means that workers feel confident enough in the economy to quit jobs that are not right for them and search for ones that are. It means a stronger labor market, where job opportunities abound and workers can find a better match. We often talk about all those workers who have been discouraged by economy, who aren’t seeing opportunities for them in the labor market or getting the hours they want. The quits rate is a similar measure. In a stronger economy, we should see the underemployment rate tick down while the quits rate ticks up. As you can see in the figure below, the quits rate has recently been moving up, but it’s still below a fully recovered rate and certainly below a full employment rate.
Despite seemingly stable U.S. trade balance, rapidly growing trade deficits in non-oil goods could lead to American job losses
The U.S. Census Bureau reported that the annual U.S. trade deficit in goods and services increased from $508.3 billion to $531.5 billion from 2014 to 2015, an increase of $23.2 billion (4.6 percent). The slow growth of the overall U.S. trade deficit hides massive underlying shifts in the trade deficit in petroleum products (which declined $157.3 billion, or 55.3 percent), compared with the trade deficit in all other goods, which increased from $547.7 billion to $673.1 billion—an increase of $125.4 billion, or 22.9 percent. In other words, the sharp decline in the petroleum trade deficit masked a large increase in the non-oil goods trade deficit, which could result in substantial U.S. job losses in the future.
Most U.S. goods trade consists of manufactured products. In 2015, manufacturing constituted 86.9 percent of total U.S. goods trade, and 94.3 percent of total trade in non-oil goods. Because manufacturing is such a large employer, rapidly growing trade deficits in non-oil goods are a threat to future employment in this sector. The growing trade deficit in manufactured products rose to 3.8 percent of GDP, only 0.7 percent (7 tenths) of a percentage point below the maximum reached in 2005. The manufacturing trade deficit also reached a record high of $681 billion in 2015, well in excess of the previous peak $619.7 in 2007. Rapidly growing manufacturing trade deficits were responsible for most, if not all, of the 4.8 million U.S. manufacturing jobs lost between December 2000 and December 2015, and there’s every reason to believe that these job losses will continue if the non-oil trade deficits keeps growing.
This analysis is primarily concerned with shifts in goods trade. The U.S. balance of trade in services declined slightly in 2015, falling from a trade surplus of $233.1 billion in 2014 to $227.4 billion in 2015. Trade in goods continues to dominate overall trade flows for the United States—trade in services totaled only 24.1 percent of total U.S. goods and services trade in 2015.
Should we care about slow nominal wage growth when price inflation is slow? YES.
Nominal wages for American workers rose by 2.6 percent in the 12 months ending in December 2015. Over the same time, prices have risen just under 0.7 percent (held down mostly by falling oil prices). This mean that real (that is, inflation-adjusted) wages have grown 1.9 percent in that year. In historical perspective, this is a very healthy rate of real wage growth (for example, real hourly wages for the bottom 70 percent of workers have averaged well under 0.5 percent annually since 1979).
Since it is this real, not nominal, wage growth that influences living standards, shouldn’t we be perfectly happy with this constellation of wage and price inflation? Not really, for a number a reasons.
For one, the extraordinarily low rates of price inflation won’t continue. They’ve been driven by large declines in commodity prices. The gains to real living standards are genuine—cheap gas really does make paychecks stretch further (though how good cheap gas is in the long run for climate change is a whole other story), but we know that commodity prices are volatile and are likely to stabilize or even rise in the next year. If either of these things happens, the overall rate of inflation in the next year will rise.
Further, even if commodity prices remained depressed forever and overall price inflation really did permanently shift to a slower pace, it is far from clear that this would be a good outcome or that the real wage growth seen in the past year would continue.
What to Watch on Jobs Day: Will we finally reach full employment in 2016?
We’ve seen solid growth in employment over the past couple of years, and the unemployment rate has come down dramatically, but by any reasonable definition we are still not that close to genuine full employment. So, what is full employment? In a great book (pdf), Jared Bernstein and Dean Baker define full employment as “the level of employment at which additional demand [injected into] the economy will not create more employment.” Full employment should show up in indicators on both the quantity and the price side (i.e., wages) of the labor market. Unemployment is low during periods of full employment, and due to high demand for labor, employed workers have more bargaining power—as a result they will be better able to negotiate higher wages and get the hours they want.
Let’s look at some measures of employment on the quantity side. A good measure of slack in employment and hours is the BLS’s U6 measure of labor underutilization. It measures total unemployed, plus all persons marginally attached to the labor force, plus total employed part time for economic reasons, as a percent of the civilian labor force. Basically, people who want to work, plus employed people who want to work more hours, plus people who have looked for work in the last year but stopped looking for some reason in the last four weeks and are hence not classified as currently “in the labor force.”
The figure below shows these data by race, which demonstrates that, as with the unemployment rate, the underemployment rate is much higher for people of color. While the U6 has come down substantially but it is still elevated and has a ways to go before it gets to pre-recession levels. (And these pre-recession levels are elevated relative to the last time we had unambiguous full employment in the late 1990s and 2000.)