Social Media Toolkit
Social media toolkits contain information and resources to push out and amplify EPI’s research, reports, and campaigns. They are similar to press kits for promoting a news item. Here’s how to use a toolkit:
- Download graphics by right-clicking an image to save it onto your desktop. You can also simply drag it onto your desktop. On mobile, hold down on the image and select “Download Image.” Refrain from using screenshots, as they distort quality.
- Log into your social accounts.
- Copy and paste one of the sample messages below into your status update. Don’t forget to use hashtags and link back to important research (usually a go.epi.org link)
- Upload the graphic saved onto your desktop/phone to accompany your status update.
- Post your status update and encourage others to join the conversation!
Factsheet Toolkits: Immigration Fact Sheets
Report Toolkits: Rooted in Racism • Chasing the Dream of Equity • Teacher Pay in 2022
FACTSHEET TOOLKIT
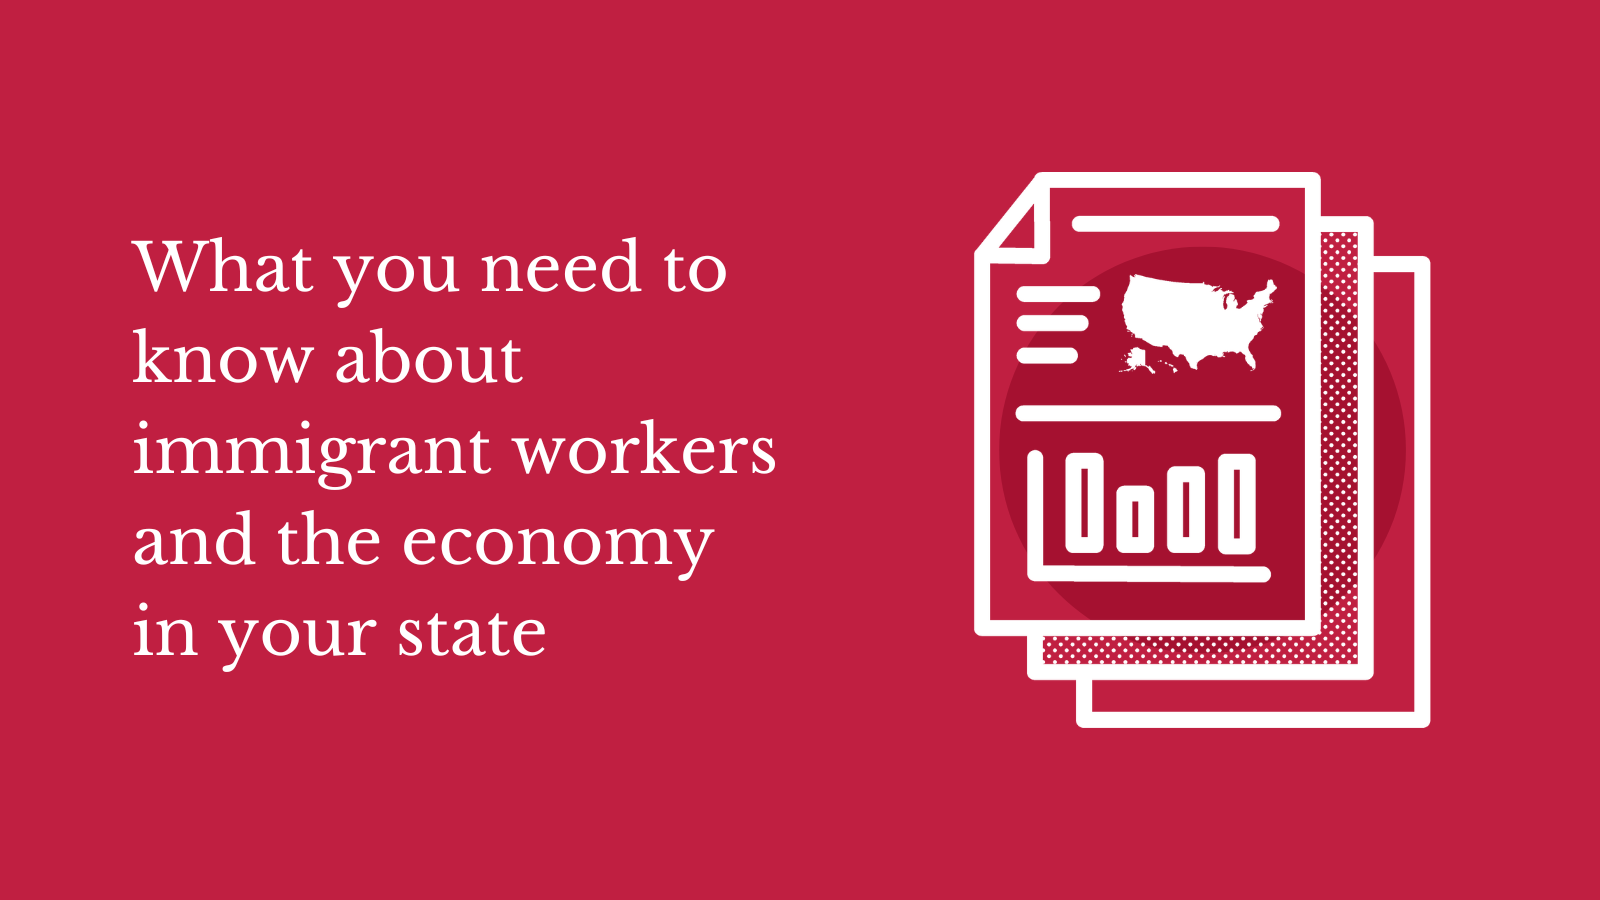
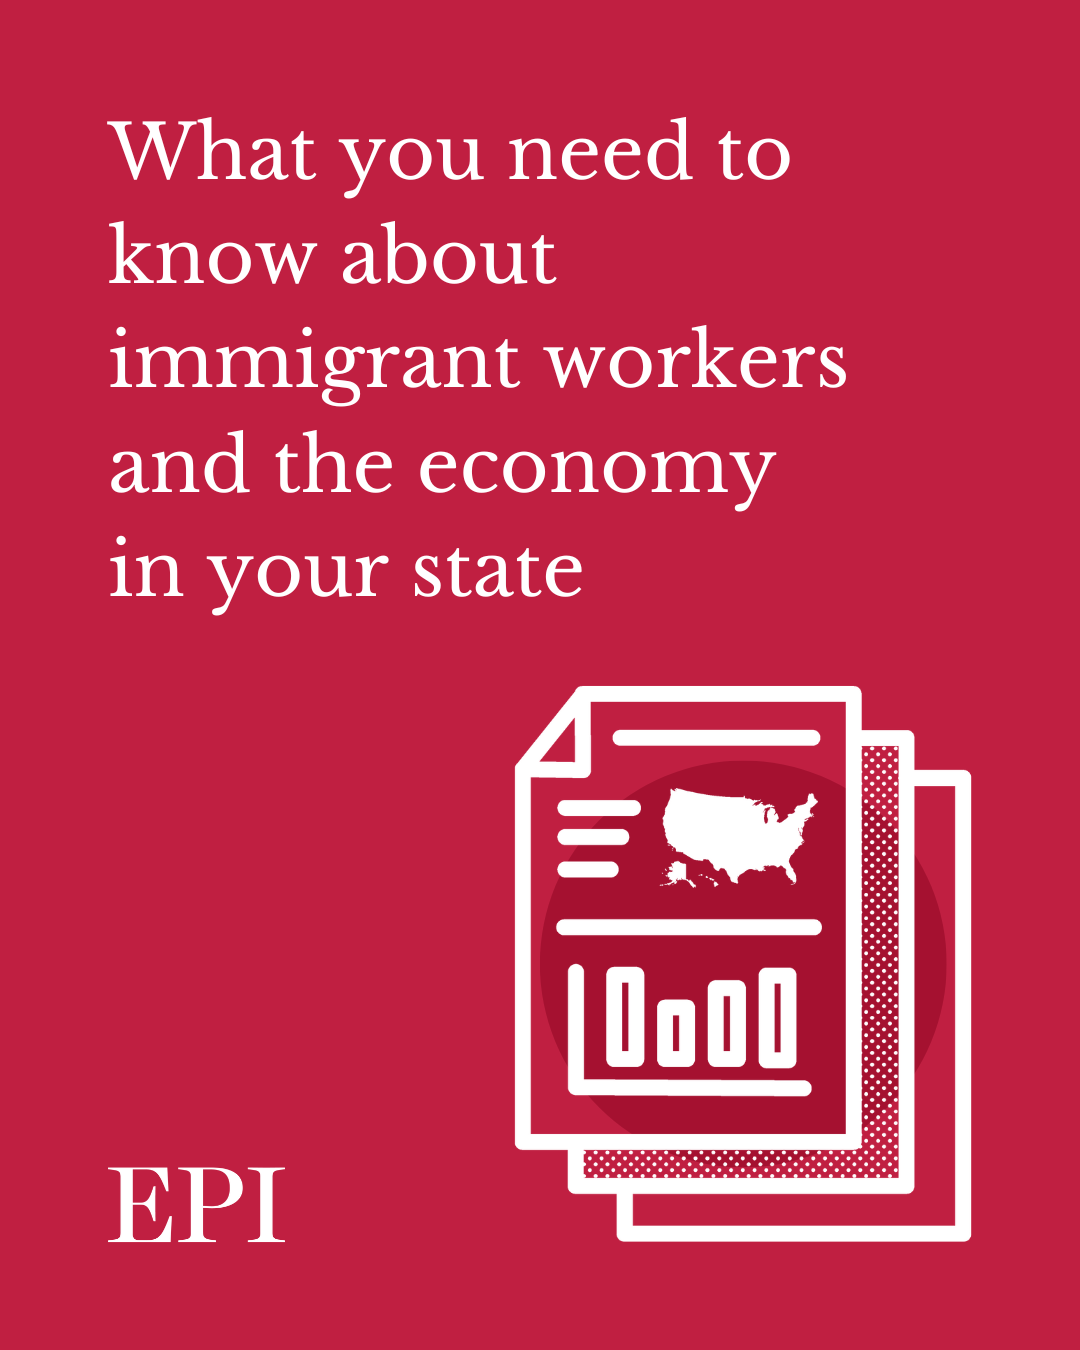
Immigration Fact Sheets
What you need to know about immigrant workers and the economy in your state
Messaging and Graphics
Bluesky/Threads
If you want to do your own post, or if you want to quote post our content, here’s some sample text. Don’t forget to fill in the blanks with state specific data!
- Post 1:
- Immigrants fill X% of all jobs in [state name]. Deporting [state initials] workers will rob city & state coffers of $X b/million in tax revenue. This will make it more difficult to provide basic services to all residents, harming workers & families in our state.
More info at @epi.org (bluesky) or @ economicpolicy (threads): go.epi.org/immigrationfactsheets
- Immigrants fill X% of all jobs in [state name]. Deporting [state initials] workers will rob city & state coffers of $X b/million in tax revenue. This will make it more difficult to provide basic services to all residents, harming workers & families in our state.
- Example:
- Immigrants fill 5% of all jobs in Alabama. Deporting AL workers will rob city & state coffers of $146 million in tax revenue. This will make it more difficult to provide basic services to all residents, harming workers & families in our state.
More info at @epi.org: go.epi.org/immigrationfactsheets
- Immigrants fill 5% of all jobs in Alabama. Deporting AL workers will rob city & state coffers of $146 million in tax revenue. This will make it more difficult to provide basic services to all residents, harming workers & families in our state.
- Post 2:
- Trump’s mass deportation agenda will tank economic growth, lead to massive job losses, disrupt key industries, spike inflation, separate families, & create a culture of fear in our workplaces & communities, says @epi.org (bluesky) or @ economicpolicy (threads).
Learn about how immigration benefits the economy in [state initials]: go.epi.org/immigrationfactsheets
- Trump’s mass deportation agenda will tank economic growth, lead to massive job losses, disrupt key industries, spike inflation, separate families, & create a culture of fear in our workplaces & communities, says @epi.org (bluesky) or @ economicpolicy (threads).
- Example:
- Trump’s mass deportation agenda will tank economic growth, lead to massive job losses, disrupt key industries, spike inflation, separate families, & create a culture of fear in our workplaces & communities, says @epi.org (bluesky) or @ economicpolicy (threads):
Learn about how immigration benefits the economy in AL: go.epi.org/immigrationfactsheets
- Trump’s mass deportation agenda will tank economic growth, lead to massive job losses, disrupt key industries, spike inflation, separate families, & create a culture of fear in our workplaces & communities, says @epi.org (bluesky) or @ economicpolicy (threads):
Facebook/Linkedin
Body Copy
Don’t forget to fill in the blanks with state specific data!
Sample post:
Fact: Immigrant workers help grow and are vital the US economy.
Immigrant workers fill X% of all jobs in [state name]. Deporting [state initials] workers will rob city and state coffers of $X b/million in tax revenue. This will make it more difficult to provide basic services to all residents, harming workers and families in our state.
Pursuing Trump’s mass deportation agenda will tank economic growth, lead to massive job losses, disrupt key industries, spike inflation, separate families, and create a culture of fear in our workplaces and communities, according to the @Economic Policy Institute.
Check out the fact sheet on how immigration benefits the economy in [state name]: go.epi.org/immigrationfactsheets
Example:
Fact: Immigrant workers help grow and are vital to the US economy.
Immigrant workers fill 5% of all jobs in Alabama. Deporting Alabaman workers will rob city and state coffers of $146 million in tax revenue. This will make it more difficult to provide basic services to all residents, harming workers and families in our state.
Pursuing Trump’s mass deportation agenda will tank economic growth, lead to massive job losses, disrupt key industries, spike inflation, separate families, and create a culture of fear in our workplaces and communities, according to the Economic Policy Institute.
Check out the fact sheet on how immigration benefits the economy in Alabama: go.epi.org/immigrationfactsheets
Graphics
Download a graphic from the links below and pair with body copy, or use this Canva template with updated language based on your state.
Click graphic to view in full size
REPORT TOOLKIT
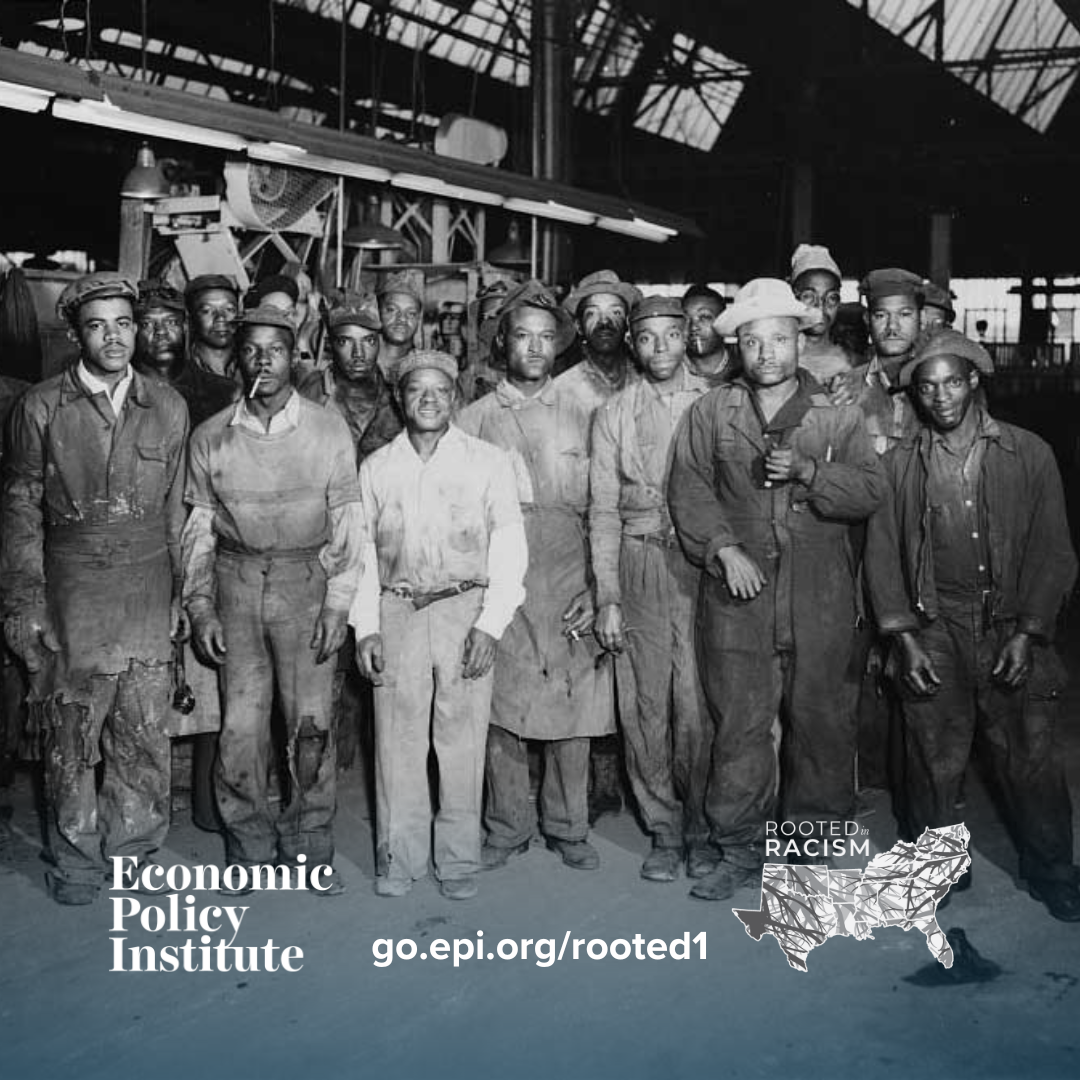
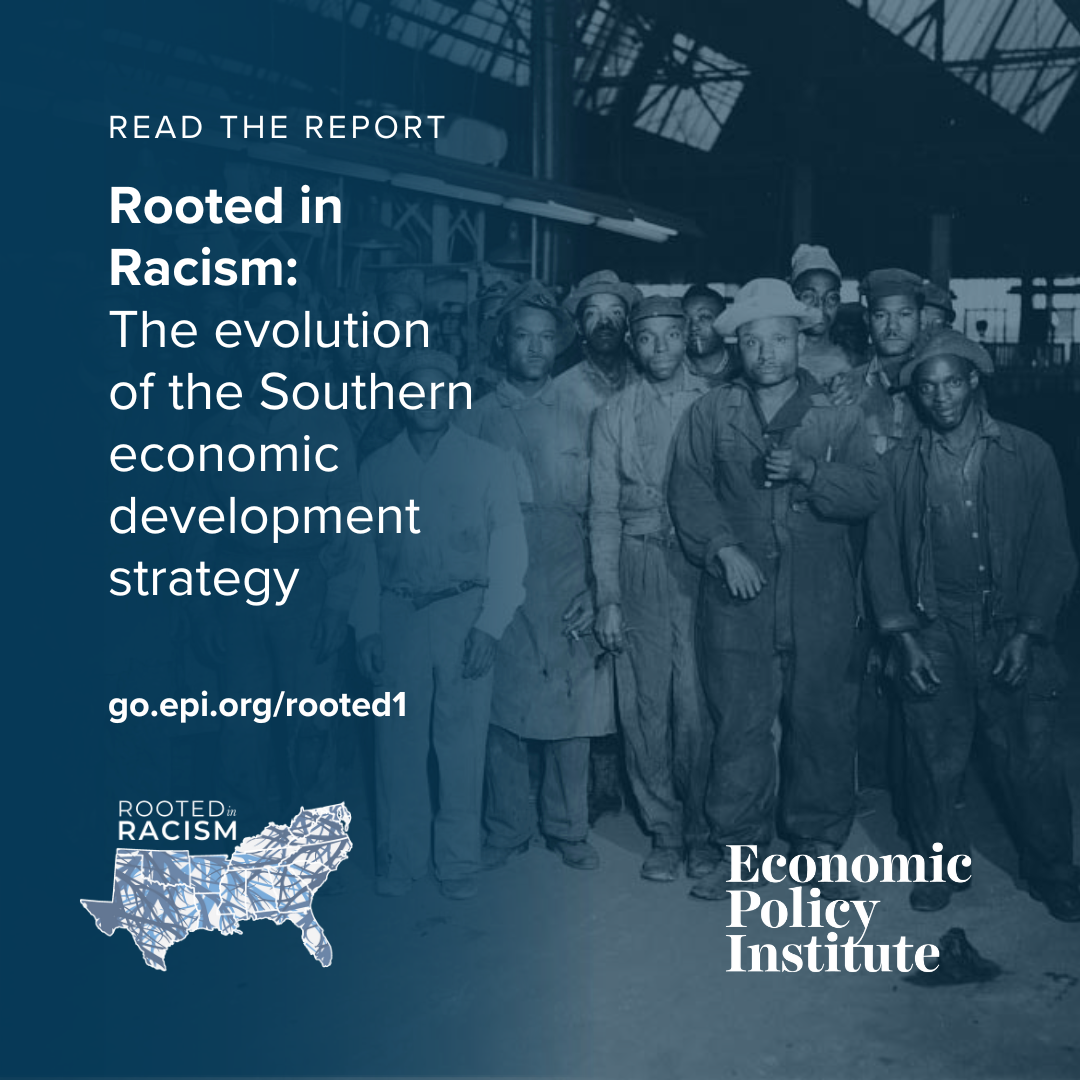
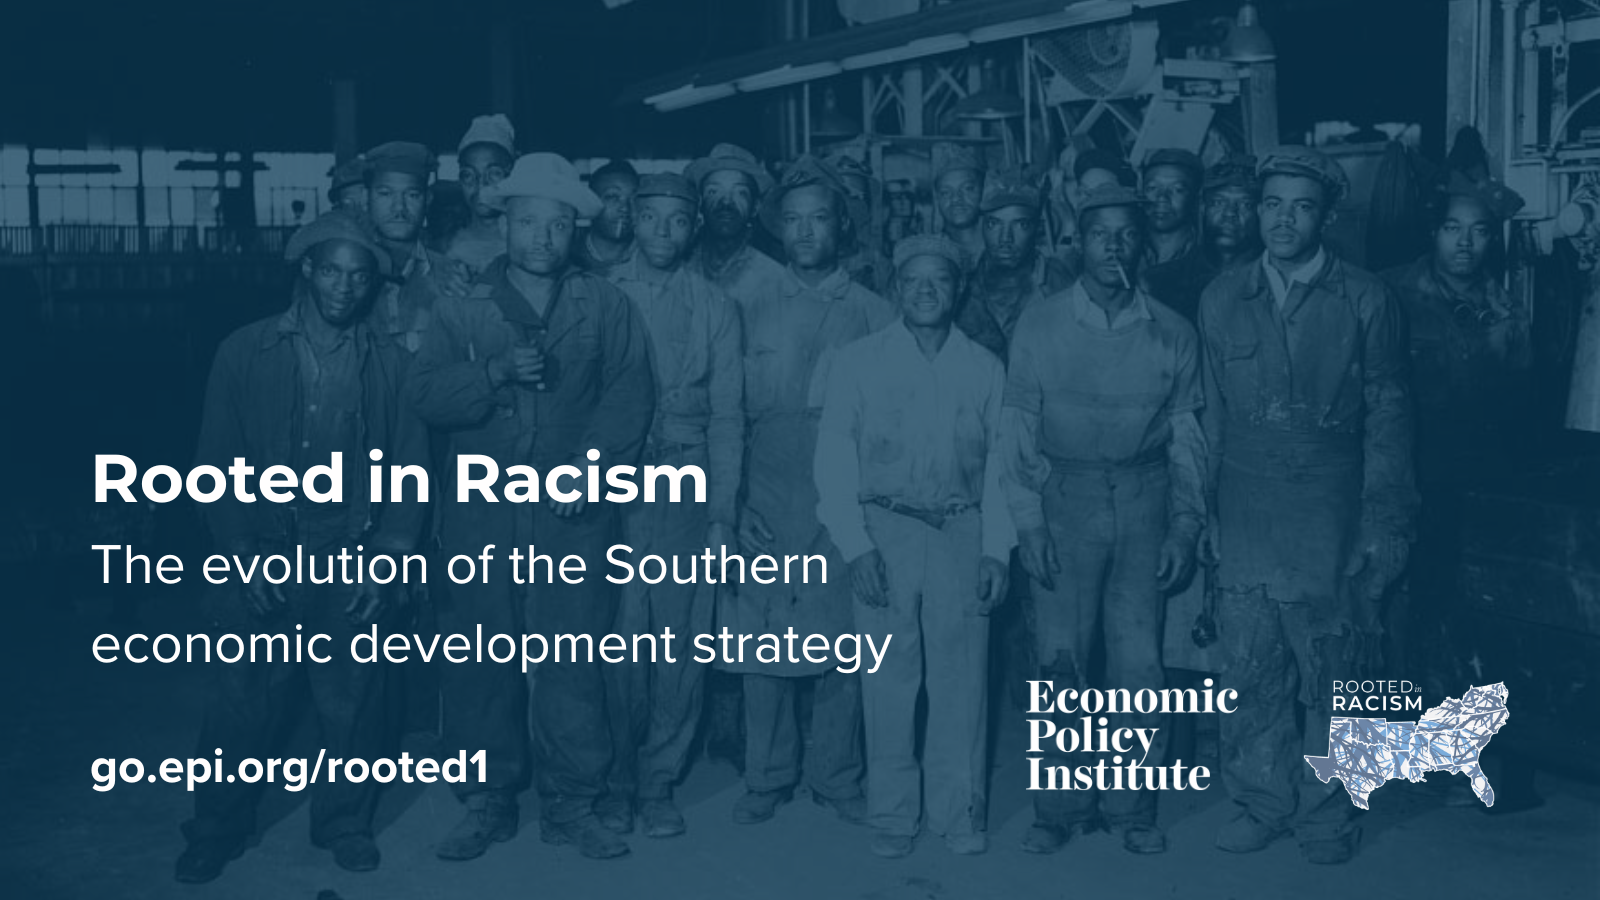
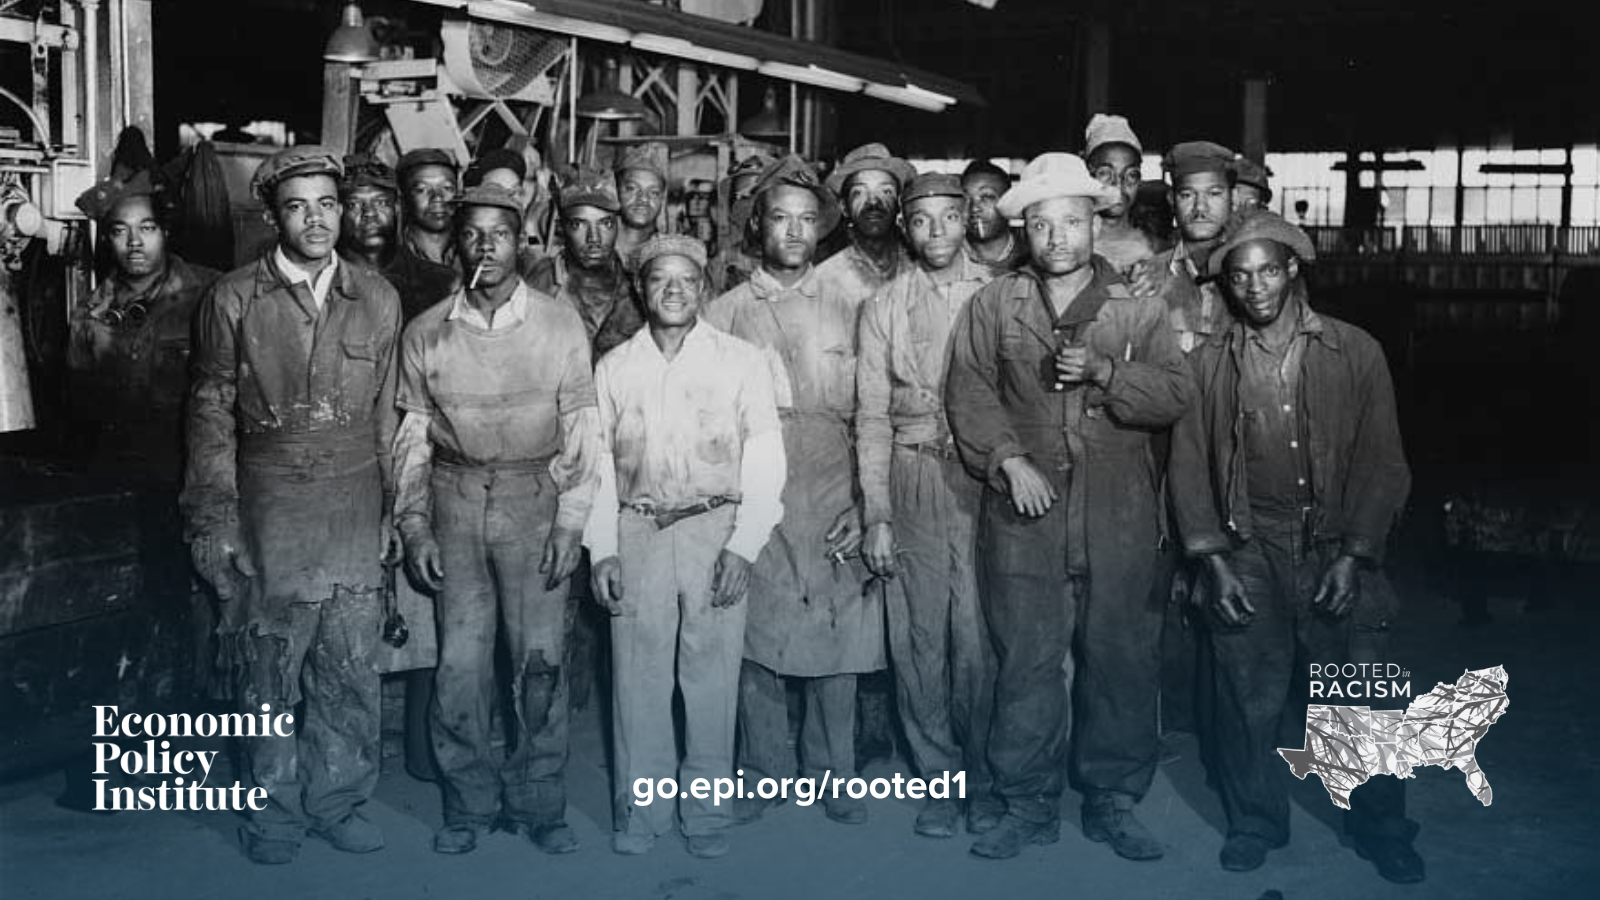
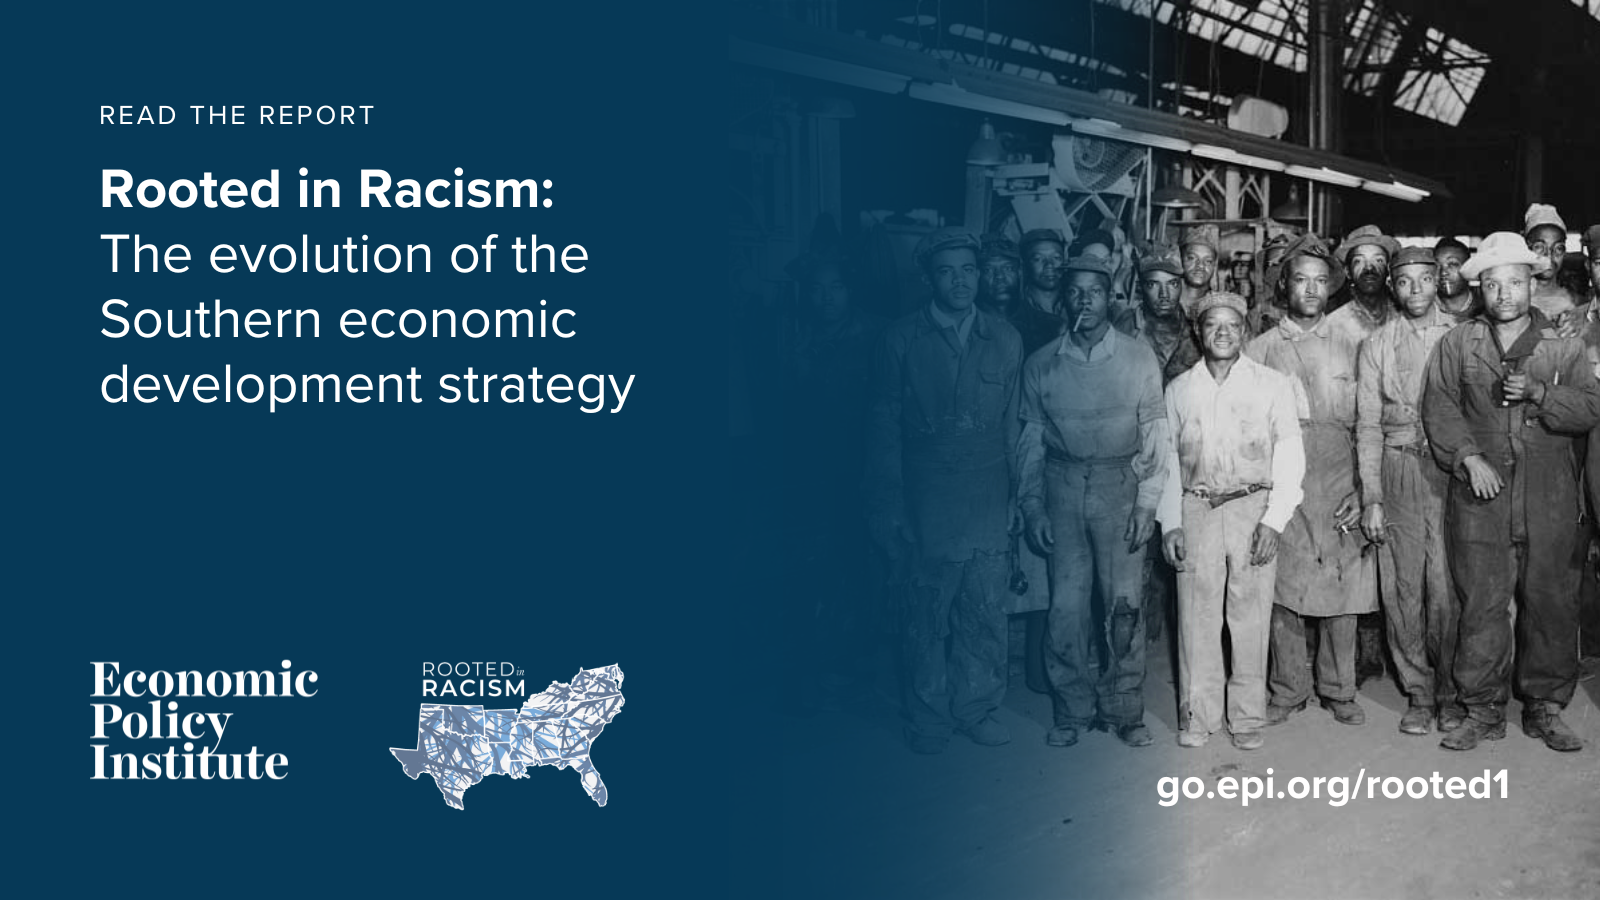
Rooted in Racism
The racist roots and evolution of the Southern economic development strategy
Read the blog post on Waffle House
Read the blog post on Operation Dixie
Read the blog post on Alabama and Maryland
Read the spotlight report on tipping
Messaging and Graphics
Twitter/Threads/Bluesky
These tweets can stand alone, or be part of a thread.
- This week marks almost 80 years since Operation Dixie, the largest effort to unionize workers across the South in US history. Operation Dixie was unfortunately defeated by a Southern economic development model that is #RootedinRacism @EconomicPolicy https://go.epi.org/rooted1
- Powerful interests in the South have used racism & white supremacy to divide the population & distract them from what they have in common: “They are all being exploited by those at the top,” says @EconomicPolicy. Read the #RootedinRacism report: https://go.epi.org/rooted1
- The Southern economic model is #RootedinRacism, but Southerners can choose a different way forward. It’s time to demand policies that will lift up EVERYONE in the region. Read the @EconomicPolicy report: https://go.epi.org/rooted1
Choose one graphic to accompany the following caption to post on Instagram.
Caption Copy
This week marks almost 80 years since Operation Dixie, the largest effort to unionize workers across the South in American history. Operation Dixie was unfortunately defeated by a Southern economic development model that is #RootedinRacism
But Southerners can choose a different way forward. It’s time to demand policies that will lift up EVERYONE in the region.
Read the @economicpolicy’s #RootedinRacism report at https://go.epi.org/rooted1
Graphics
Download a graphic from the links below and pair with your choice of caption copy.
Click graphic to view in full size
Facebook/Linkedin
Body Copy
This week marks almost 80 years since Operation Dixie, the largest effort to unionize workers across the South in American history. Operation Dixie was unfortunately defeated by a Southern economic development model that is #RootedinRacism
After slavery was abolished, politicians and the wealthy sought to continue extracting labor from Black and brown people. To keep costs low & workers down, Southern states implemented exploitative policies like low or no minimum wages, fierce opposition to unions, & few business regulations.
Powerful interests in the South have used racism and white supremacy to divide the population and distract them from what they have in common: “They are all being exploited by those at the top,” says EPI’s Chandra Childers.
But as the UAW’s recent win shows, southerners can choose a different way forward. It’s time to demand policies that will lift up EVERYONE in the region.
Read the #RootedinRacism report below: https://go.epi.org/rooted1
Graphics
Download a graphic from the links below and pair with your choice of body copy.
Click graphic to view in full size
Tiktok/Reels
Feel free to repost our Tiktok directly to your feed, or use any of the talking points above to stitch our video and add your own context.
![]()
REPORT TOOLKIT
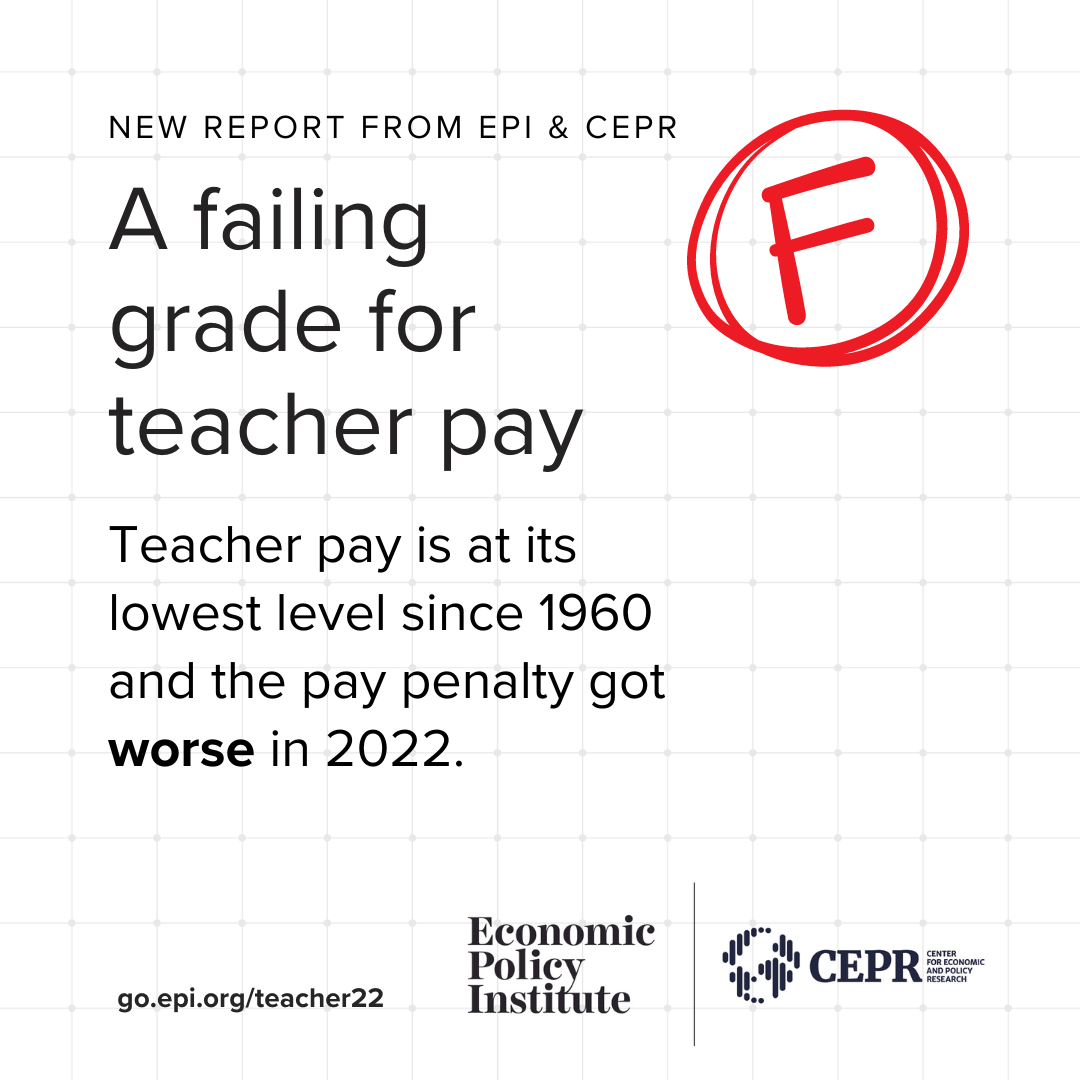
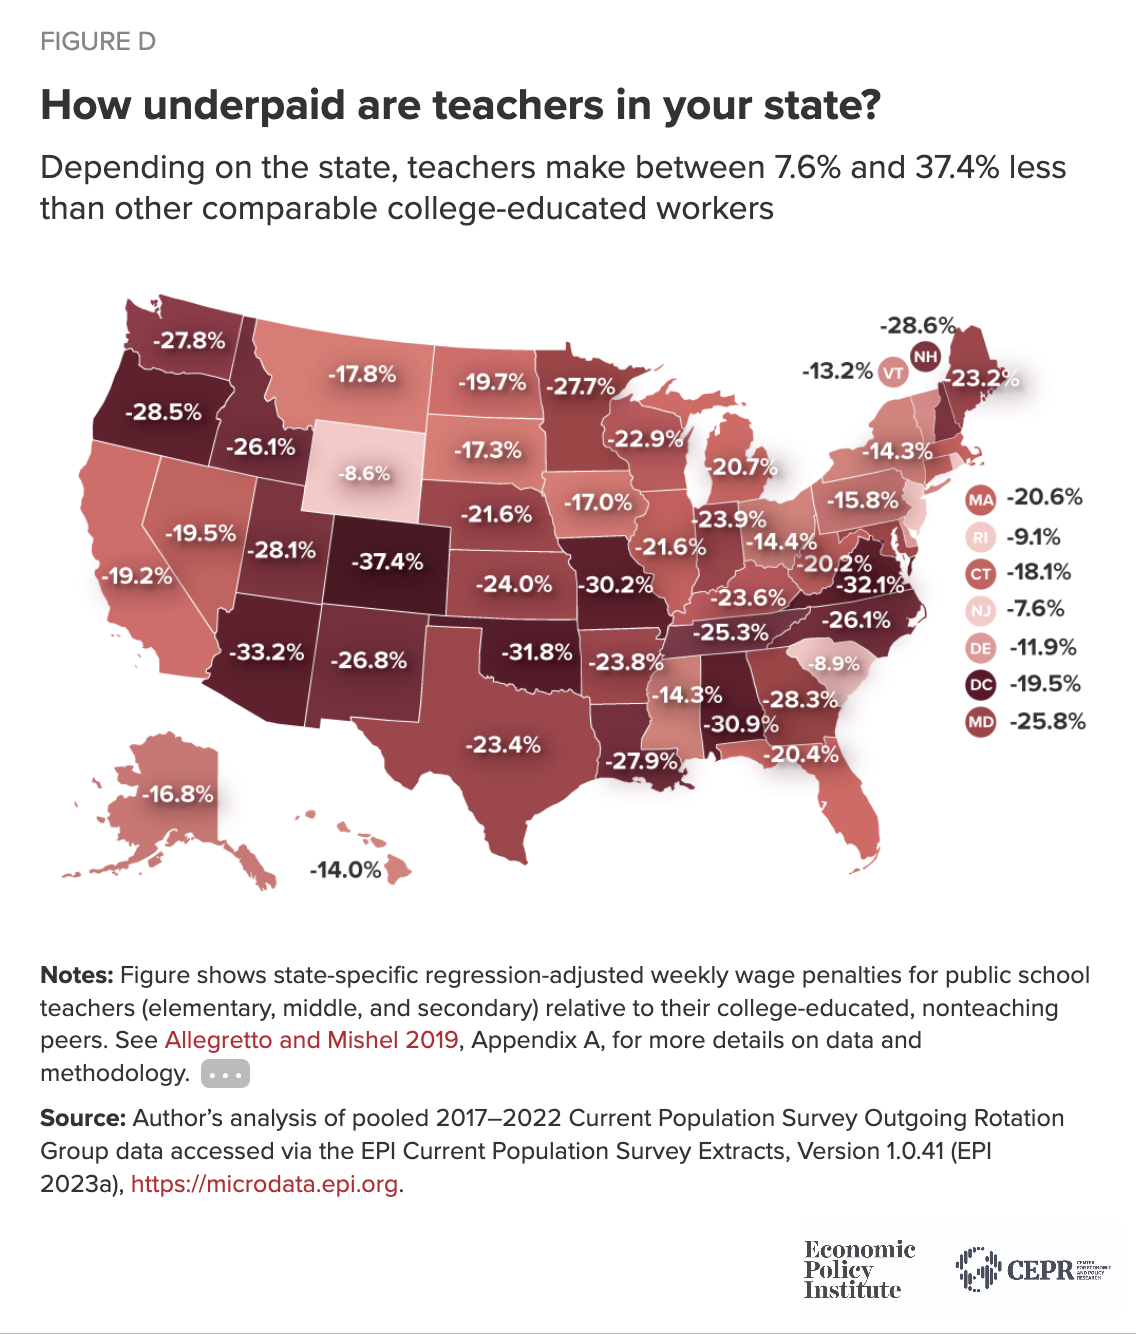
Teacher pay penalty still looms large
Trends in teacher wages and compensation through 2022
Messaging and Graphics
Twitter/Threads/Bluesky
These tweets can stand alone, or be part of a thread.
- A failing grade for teacher pay: Teacher pay is at its lowest level since 1960 and the pay penalty got worse in 2022. On average, last year teachers made 26.4% less than their peers with similar education. go.epi.org/teacher22
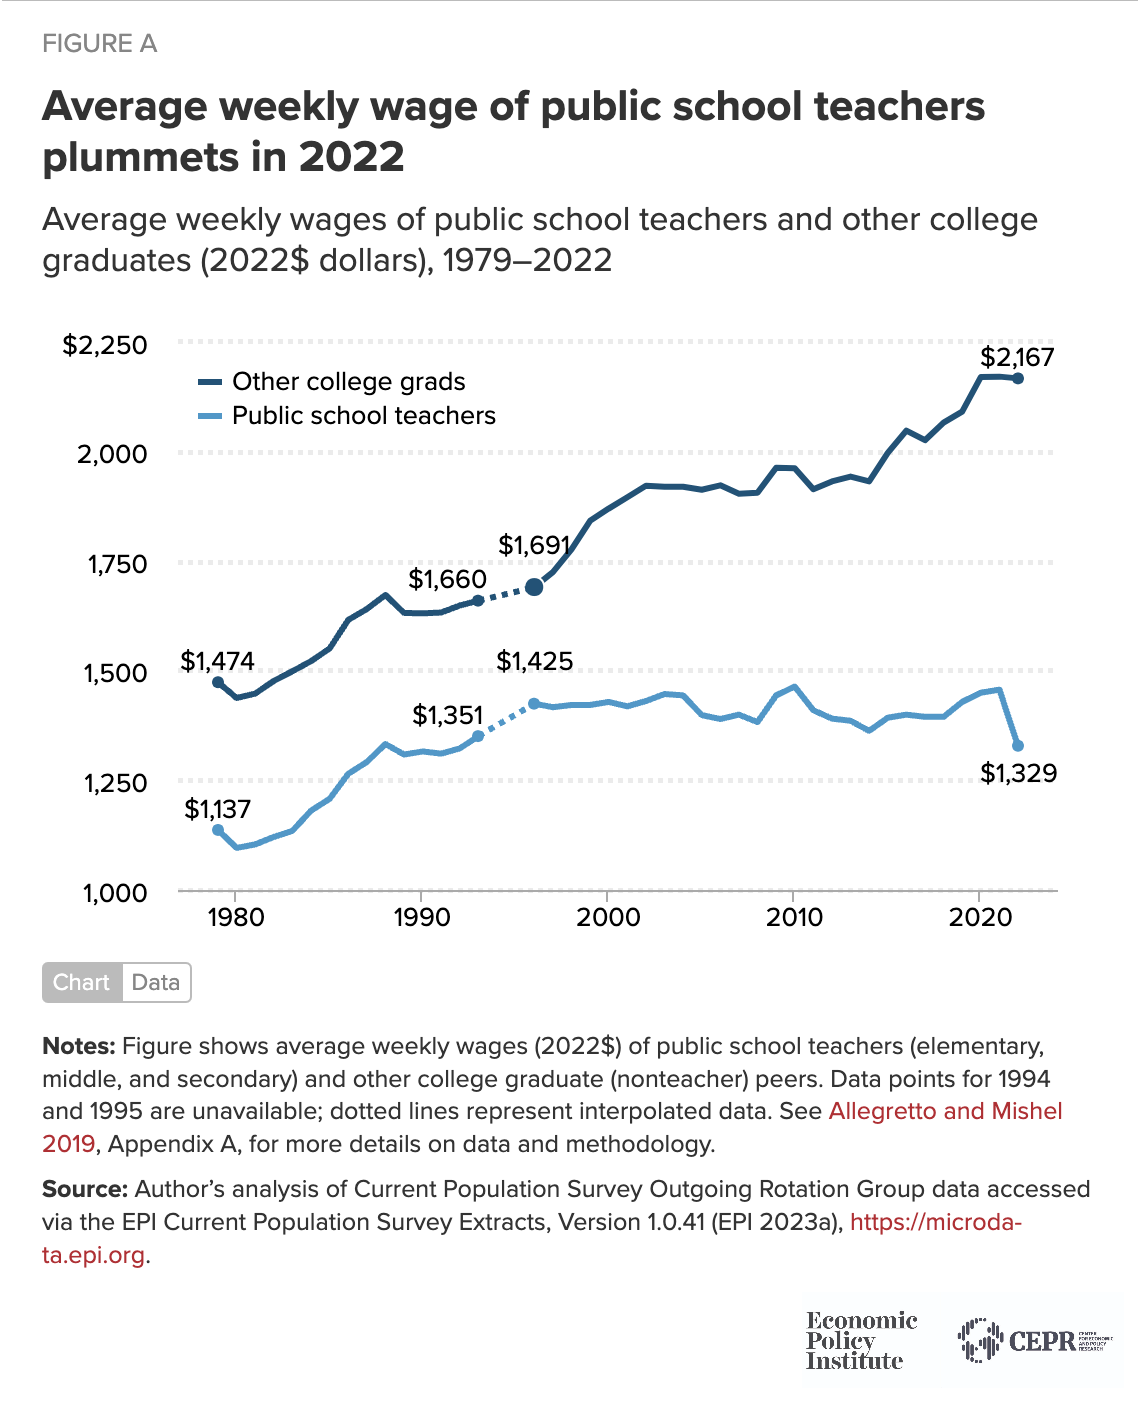
- Since 1996, the pay penalty for teachers—the gap between the weekly wages of teachers and college graduates working in other professions has more than quadrupled from 6.1 % to 26.4%. go.epi.org/teacher22
- Here’s what the teacher pay penalty means in dollars and cents:
- Today on average, teachers earn 73.6 cents for every dollar that their peers in other professions earn. In 1996, teachers made 93.9 cents for every dollar their peers in other fields made.
- Accounting for inflation, teacher weekly wages decreased by $128 from 2021 to 2022, from $1,457 to $1,329 (in 2022 dollars). go.epi.org/teacher22
- What do CO, AZ, VA, OK, AL, & MO all have in common? Those are six states where teachers earn LESS than 70 cents on the dollar compared to similar college grads in their respective states. go.epi.org/teacher22
- Teachers are showing up every day for our students while facing ongoing challenges with COVID-19, rising school violence, & curriculum battles. State & local governments, policymakers and others can help reverse the downward trend in teacher pay by boosting funding for teacher pay. go.epi.org/teacher22
- Here are other ways to reverse the decline in teacher pay:
- A larger role for unions-expanding collective bargaining to advocate for increased teacher pay, improved job quality and more resources for teachers.
- Federal support to maintain and improve resources for schools.
- Read the report: go.epi.org/teacher22
Facebook/Linkedin
Body Copy
In what should be a surprise to no one, teacher pay gets a failing grade in this country. Teacher pay is at its lowest level since 1960 and the pay penalty got worse in 2022. On average, last year teachers made 26.4% less than their peers with similar education. In fact, since 1996, the pay penalty for teachers—the gap between the weekly wages of teachers and college graduates working in other professions has more than quadrupled from 6.1 % to 26.4%.
Here’s what the teacher pay penalty means in dollars and cents:
- Today on average, teachers earn 73.6 cents for every dollar that their peers in other professions earn. In 1996, teachers made 93.9 cents for every dollar their peers in other fields made.
- Accounting for inflation, teacher weekly wages decreased by $128 from 2021 to 2022, from $1,457 to $1,329 (in 2022 dollars).
Read the report: go.epi.org/teacher22
Download the graphic and include accompanying caption copy
Caption Copy
- On average, last year teachers made 26.4% less than their peers with similar education. Read the report: go.epi.org/teacher22
Graphic
Click graphic to view in full size
Charts
Consider including charts along with your post.
Click graphic to view in full size
![]()
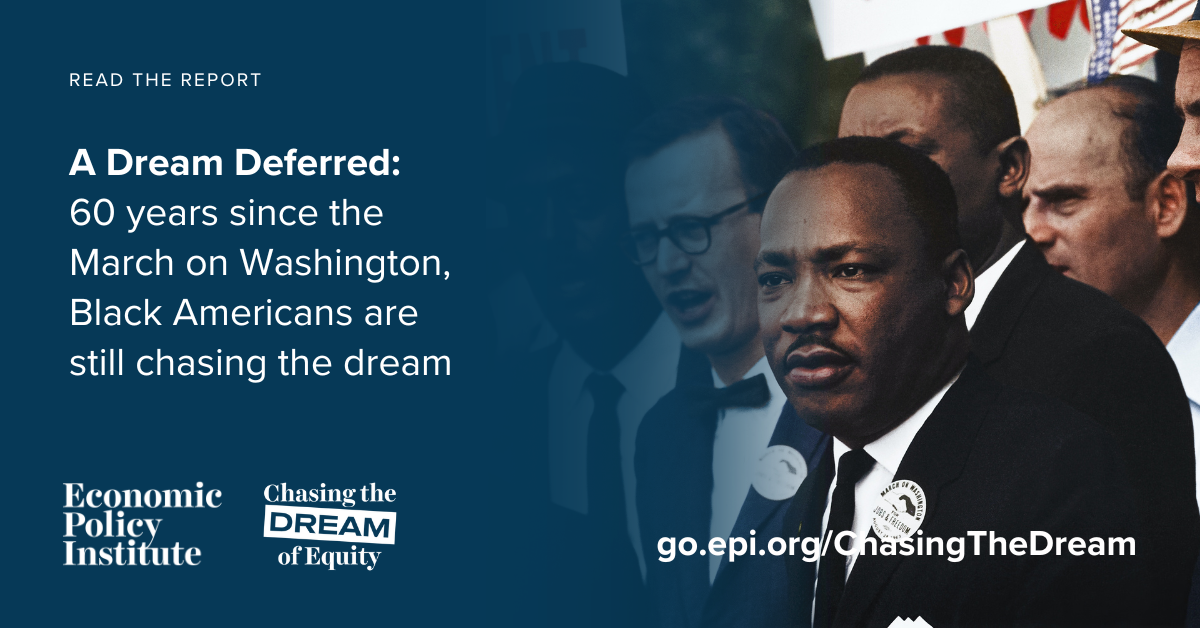
REPORT TOOLKIT
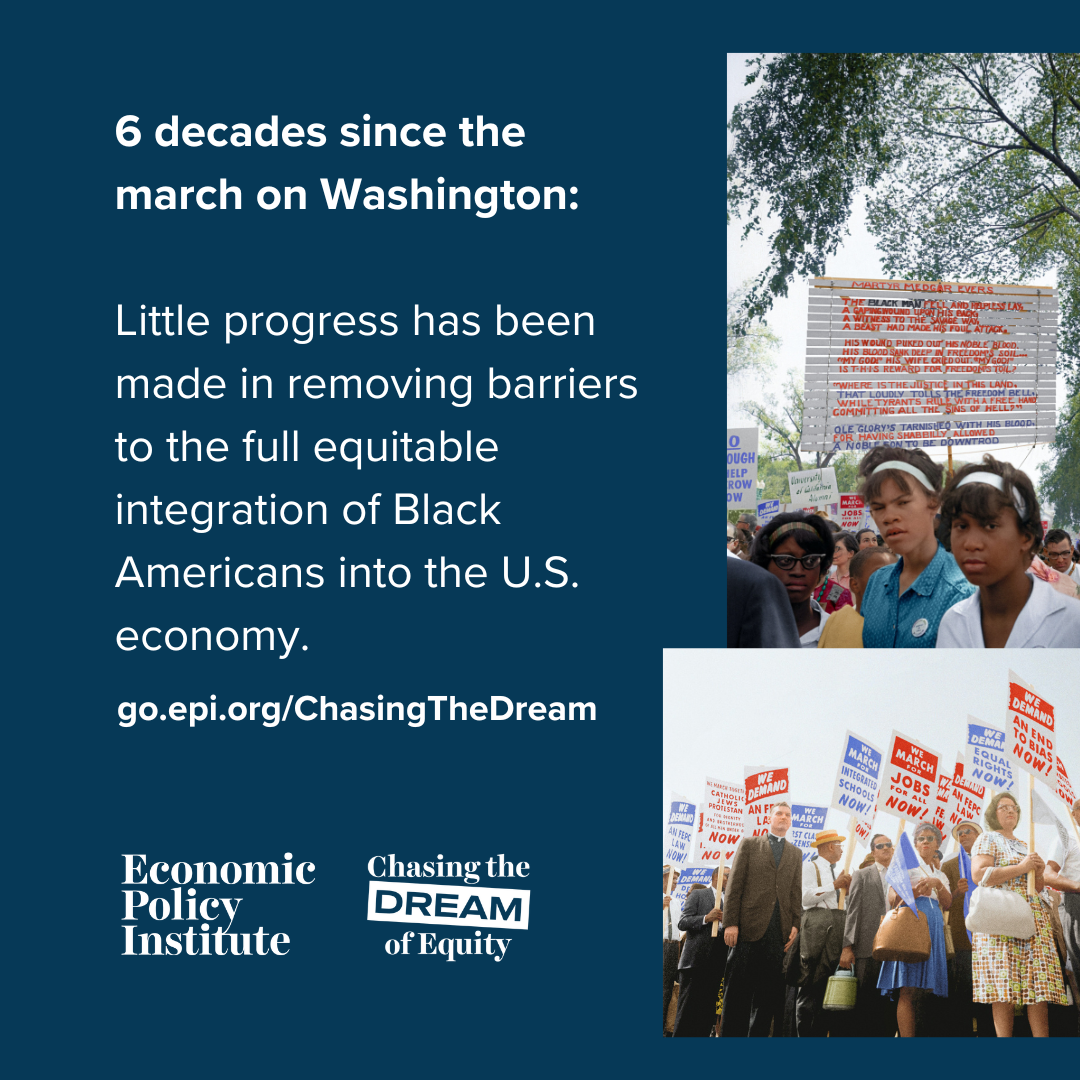
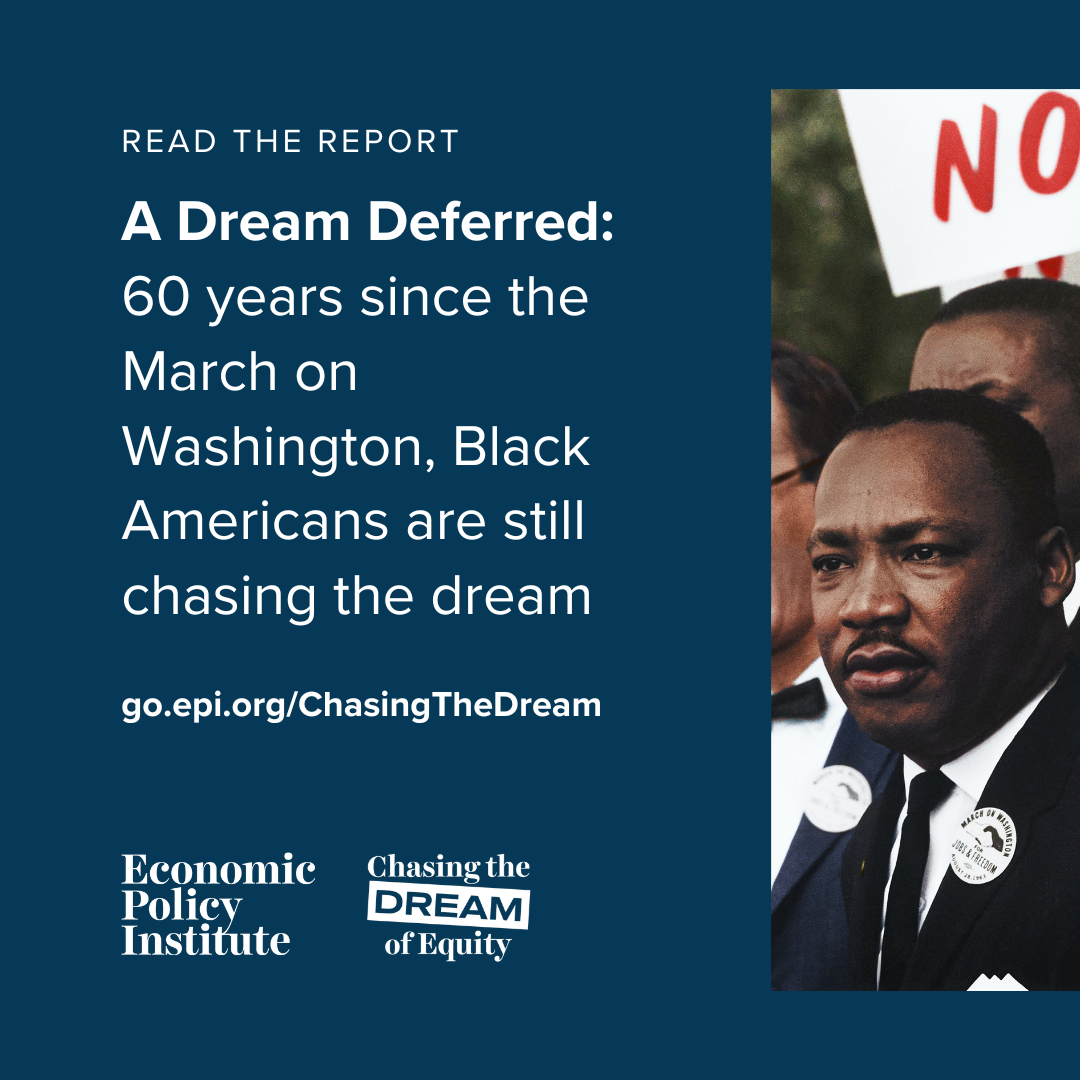
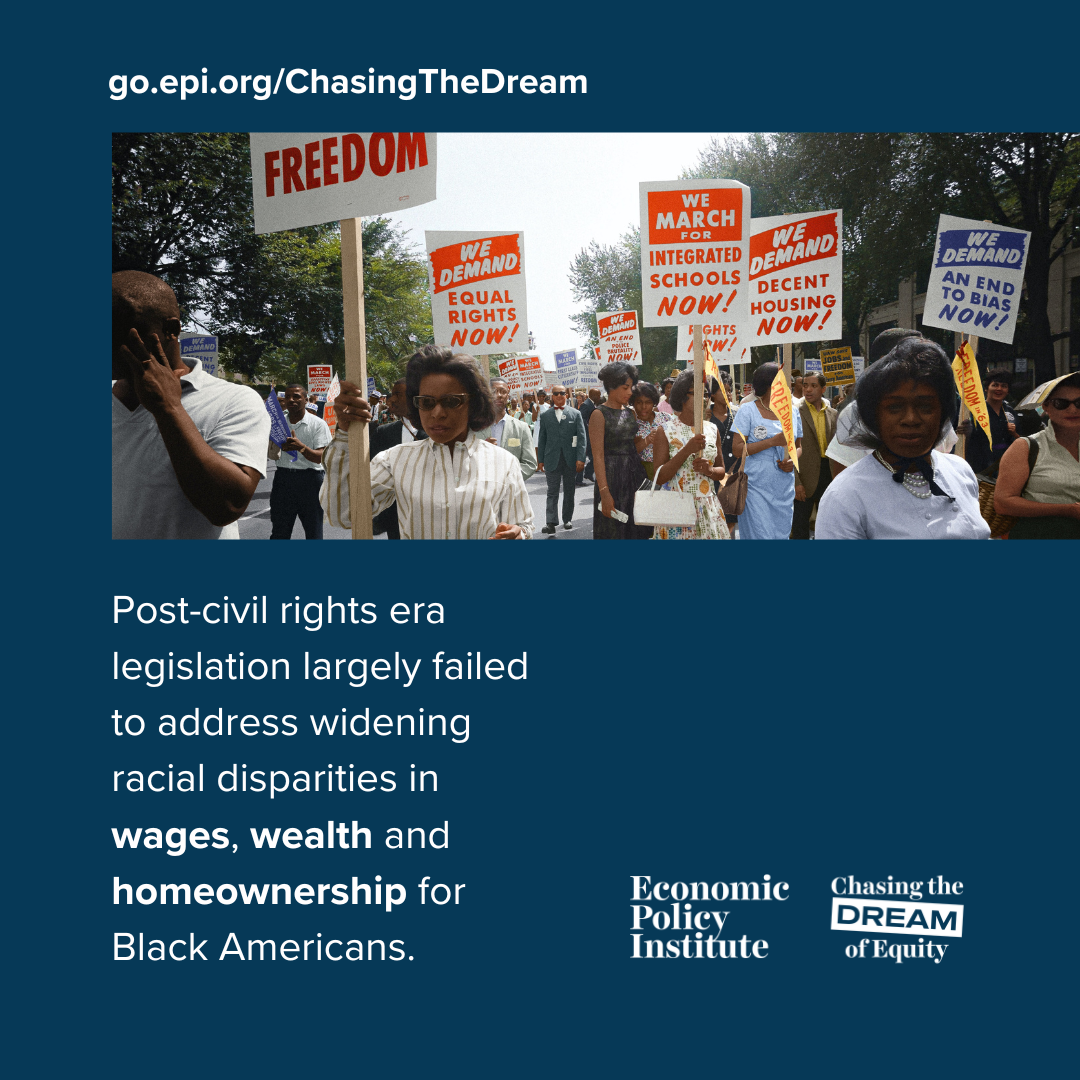
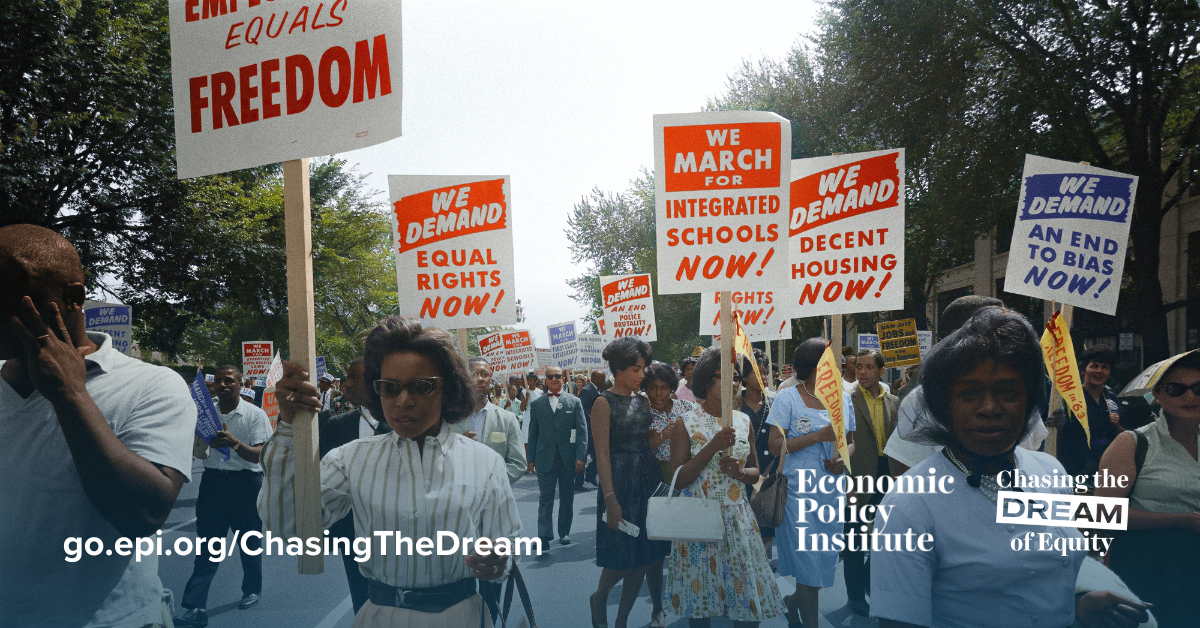
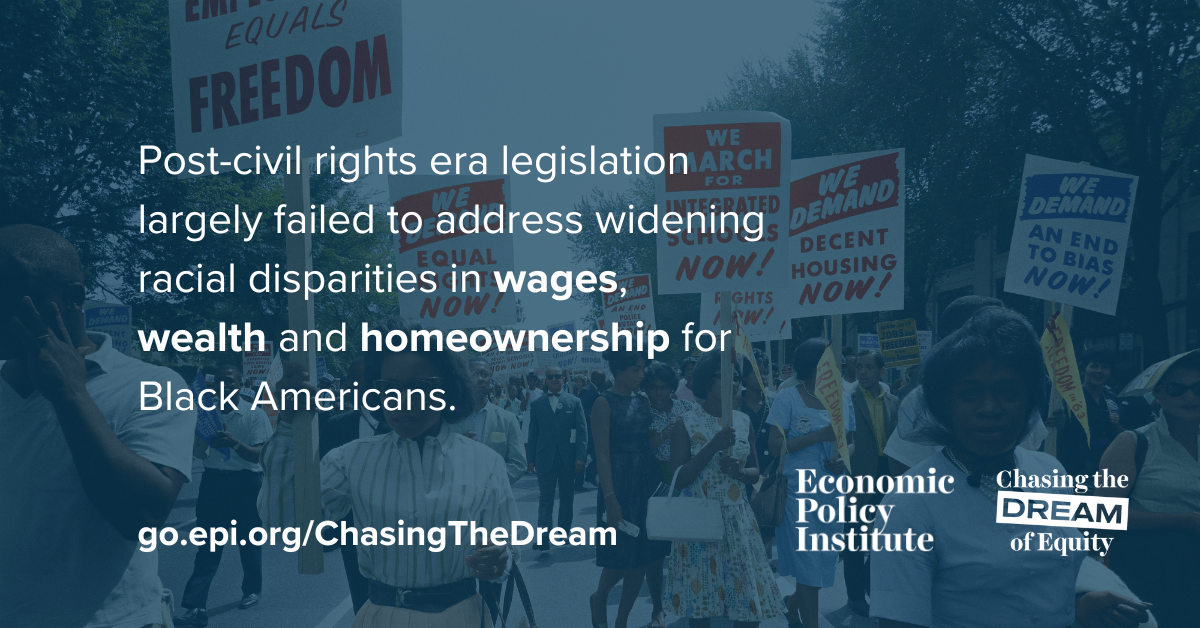
Chasing the Dream of Equity
How policy has shaped racial economic disparities
Messaging and Graphics
Twitter/Threads/Bluesky
These tweets can stand alone, or be part of a thread.
- Something Dr. Martin Luther King Jr. could never have imagined when he gave his “I Have a Dream” speech at the March on Washington 60 years ago: The dream of economic equity for Black Americans remains largely unrealized. #ChasingTheDream go.epi.org/chasingthedream
- “We refuse to believe that there are insufficient funds in the great vaults of opportunity of this nation.” Six decades since #MLK’s March on Washington speech, barriers still remain to full equitable integration of Black Americans in the US economy. #ChasingTheDream go.epi.org/chasingthedream
- The wealth gap between Black and white families is a long-standing vestige of centuries of government policies EXPLICITLY denying African Americans the opportunity to build wealth. Read the report: go.epi.org/chasingthedream #ChasingTheDream
Choose one graphic to accompany one of the following captions to post on Instagram.
Caption Copy
- August marks 60 years since the March on Washington, yet MLK’s dream has yet to be realized. Read the report: go.epi.org/chasingthedream. #MarchOnWashington #IHaveADream #ChasingTheDream #MLKjr
- Something Dr. Martin Luther King Jr. could never have imagined when he gave his “I Have a Dream” speech at the March on Washington 60 years ago: The dream of economic equity for Black Americans remains largely unrealized. go.epi.org/chasingthedream #MarchOnWashington #IHaveADream #ChasingTheDream #MLKjr
Graphics
Download graphics from the links below and pair with your choice of caption copy.
Click graphic to view in full size
Facebook/Linkedin
Body Copy
This month marks 60 years since the March on Washington for Jobs and Freedom. A new Economic Policy Institute report finds that insufficient progress has been made in narrowing large gaps in wages and wealth between Black Americans and white Americans. A typical Black worker is paid 23.4% less per hour than a typical white worker, a wider gap than in 1973. This kind of difference has a cumulative effect over time, resulting in the typical Black family having one-eighth the amount of wealth that the typical white family does.
Ineffective government policies since the civil rights era are a major reason for this lack of progress. These failed policies only support and contribute to widening gaps and inequities between different groups of Americans, making it harder for everyone to achieve the American Dream. go.epi.org/chasingthedream
Graphic
Choose one of the below graphics to accompany the copy above.
Click graphic to view in full size
Tiktok/Reels
Feel free to repost our Tiktok directly to your feed, or use any of the talking points above to stitch our video and add your own context.
Playlist
Add a link to our Spotify playlist to any posts or create content referencing the playlist directly.
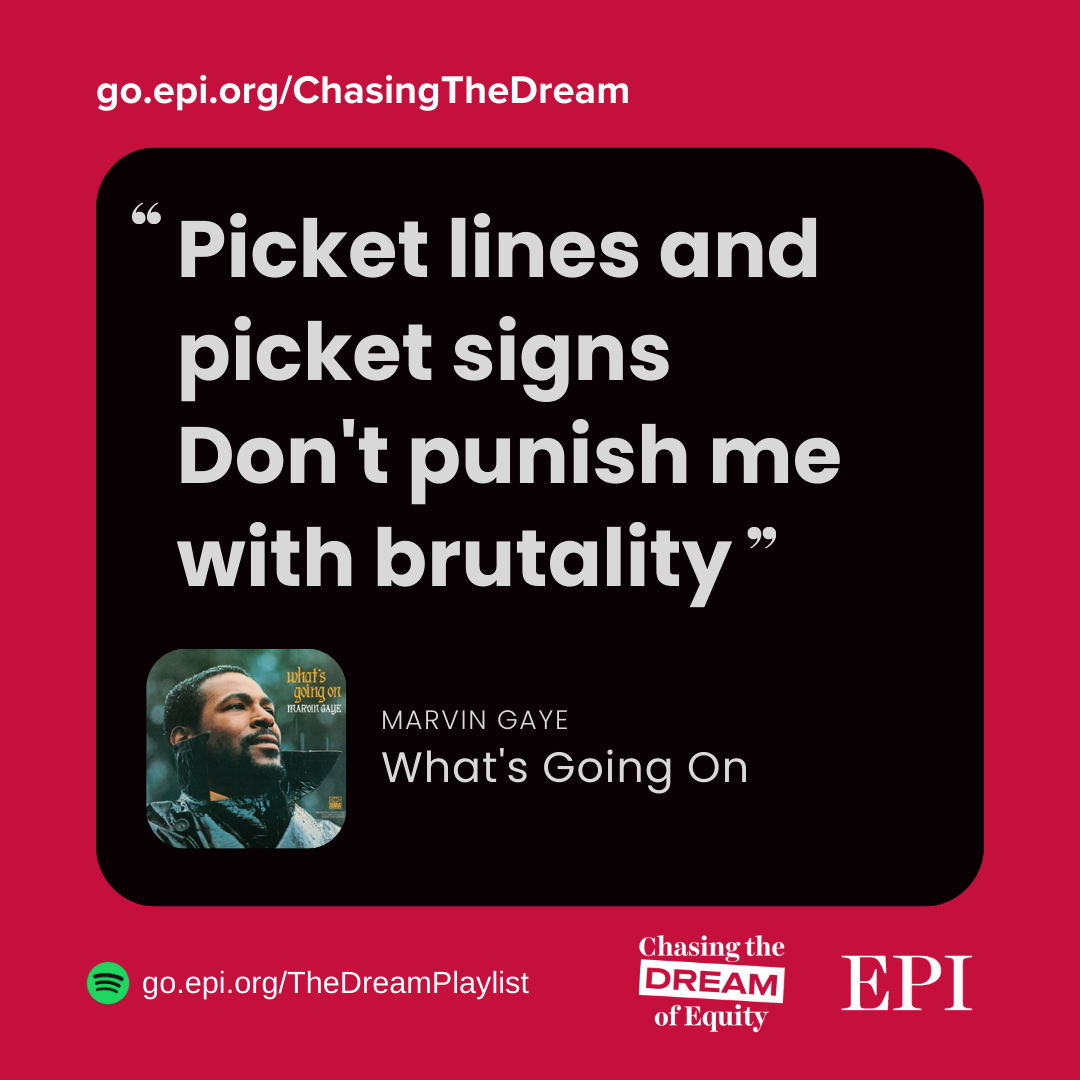
Copy & Graphic
Music was a cornerstone of the Civil Rights Movement and helped inspire artists like Marvin Gaye as well as future generations. Our #ChasingTheDream playlist highlights artists from the era and beyond. Check out the playlist of songs of struggle, protest, and progress at go.epi.org/TheDreamPlaylist.
Podcast
Share the podcast hosted by EPI’s Nick Kauzlarich.
Copy
EPI researcher Adewale Maye discusses how little has changed for Black Americans in the 60 years since The March on Washington for Jobs and Freedom. Listen to the podcast: epi.org/podcast
![]()