 Black laborers at Stockham Pipe and Fittings Company in Birmingham in 1950 (Library of Congress).
Full Report
Many states across the Southern United States utilize an economic development model that prioritizes business interests and the wealthy over ordinary citizens. This model—which we refer to as the “Southern economic development model”—is defined by low wages, low taxes, few regulations on businesses, few labor protections, a weak safety net, and fierce opposition to unions. This model is marketed as the way to attract businesses into the region, with the implicit promise that this will generate an abundance of jobs and shared economic prosperity for all Southerners.
In reality, this economic development model is fundamentally flawed as a strategy for improving living conditions for most Southerners. In fact, the Southern economic development strategy was never designed to help the vast majority of working Southerners; rather, it reflects efforts to ensure continued access to the cheap labor of Black people following emancipation, and that of Black and brown people more generally today.
In this report, we describe the Southern economic development model in detail and document the historical evolution of various components of the model. We show how politicians and the wealthy across the South have used racism and drawn on notions of white supremacy to divide the population along racial, ethnic, nativist, and economic lines. This has prevented Southerners from coming together in solidarity to demand policies that would uplift everyone in the region.
Many Southern politicians try to obscure and distort the historical record on race and the origins and purposes of many of their policies. They point to population growth over the last 50 years and the increasing number of businesses—primarily in manufacturing—that have located in some Southern states to try to sell their deceptive narrative. In this report, and in the companion reports and fact sheets in this series, we will scrutinize such claims and draw on empirical data to illustrate how the Southern economic development model has failed most workers and families across the U.S. South.
This project exposes the exploitative policies and practices that impoverish Southerners across demographic groups and highlights their complex connections to the prevailing power structure in the South. This report begins with a detailed description of the Southern economic development model. What follows is a brief history of the origins of the model, which developed as a way for wealthy and powerful people to ensure continued access to the labor of Black people following the Civil War and to that of Black and brown Southerners today, for little or no compensation. Finally, the report emphasizes that civil rights for Black and brown Americans are intimately intertwined with the rights of workers, independent of race. This reality is recognized by many conservative economic and political leaders and has led to their vociferous opposition to unions, an institution that can create cross-racial solidarity, empower workers, and undermine the racial hierarchy across the region.
How we define the South
In this report, we use the U.S. Census Bureau’s definition of the South Census Region, which includes Alabama, Arkansas, Delaware, Florida, Georgia, Kentucky, Louisiana, Maryland, Mississippi, North Carolina, Oklahoma, South Carolina, Tennessee, Texas, Virginia, West Virginia, and the District of Columbia. We note when analyses focus on only a subset of these states. Figure A shows the states that make up each of the regions compared in this report.
The South is made up of 16 states and the District of Columbia: Map of the four regions of the United States and the states that make up those regions
| State | Region | code |
|---|---|---|
| Alabama | South | 1 |
| Alaska | West | 2 |
| Arizona | West | 2 |
| Arkansas | South | 1 |
| California | West | 2 |
| Colorado | West | 2 |
| Connecticut | Northeast | 3 |
| Delaware | South | 1 |
| Washington D.C. | South | 1 |
| Florida | South | 1 |
| Georgia | South | 1 |
| Hawaii | West | 2 |
| Idaho | West | 2 |
| Illinois | Midwest | 4 |
| Indiana | Midwest | 4 |
| Iowa | Midwest | 4 |
| Kansas | Midwest | 4 |
| Kentucky | South | 1 |
| Louisiana | South | 1 |
| Maine | Northeast | 3 |
| Maryland | South | 1 |
| Massachusetts | Northeast | 3 |
| Michigan | Midwest | 4 |
| Minnesota | Midwest | 4 |
| Mississippi | South | 1 |
| Missouri | Midwest | 4 |
| Montana | West | 2 |
| Nebraska | Midwest | 4 |
| Nevada | West | 2 |
| New Hampshire | Northeast | 3 |
| New Jersey | Northeast | 3 |
| New Mexico | West | 2 |
| New York | Northeast | 3 |
| North Carolina | South | 1 |
| North Dakota | Midwest | 4 |
| Ohio | Midwest | 4 |
| Oklahoma | South | 1 |
| Oregon | West | 2 |
| Pennsylvania | Northeast | 3 |
| Rhode Island | Northeast | 3 |
| South Carolina | South | 1 |
| South Dakota | Midwest | 4 |
| Tennessee | South | 1 |
| Texas | South | 1 |
| Utah | West | 2 |
| Vermont | Northeast | 3 |
| Virginia | South | 1 |
| Washington | West | 2 |
| West Virginia | South | 1 |
| Wisconsin | Midwest | 4 |
| Wyoming | West | 2 |

Source: EPI analysis of U.S. Census Bureau 2021.
What is the Southern economic development model?
The Southern economic development model is designed to enable businesses to extract labor from large pools of workers as cheaply as possible. Businesses in the South have particularly sought the labor of Black and brown Southerners. For over 300 years, these laborers have been used to cultivate cotton and tobacco, produce the food we eat, care for our children and the elderly, build the nation’s infrastructure, and perform many other critical jobs—often for little or no compensation. The labor provided by enslaved men and women was overwhelmingly unpaid.1 After emancipation, many Black men and women—who faced limited employment opportunities—were often forced into sharecropping. They worked the land and grew crops on plantations owned by former enslavers who typically took half or more of the value of their crops (Bode 2020; USDA 2003). It was also common for Black men and women to work as porters and maids on Pullman railcars, where they were forced to rely on tips for most, if not all, of their income (Hasso 2021; Trotter Jr. 2019; Tye 2005). Today, incarcerated workers can be required to work without pay and they often are (ACLU and GHRC 2022; Mast forthcoming a).
The racist roots of this model have been obscured in favor of a more acceptable “pro-business” narrative. The pro-business narrative suggests that low wages, low taxes, anti-union policies, a weak safety net, and limited regulation on businesses creates a “rising tide that lifts all boats.”
Below we examine the key features of the Southern economic development model in detail. We then trace the development of this model over time, highlighting the ways civil rights for Black and brown Southerners are necessary for ensuring that all workers are empowered.
Low wages
Many states across the South promote low wages for many workers by the policies they implement or, in many cases, the policies they choose not to implement. For example, five Southern states—Mississippi, Louisiana, Alabama, Tennessee, and South Carolina—have no state minimum wage at all. Georgia has a minimum wage set at $5.15 per hour. Because the federal minimum wage is set at $7.25 per hour and $2.13 per hour for tipped workers, all workers across the South are supposed to be paid at least these minimums (EPI 2023).
Fewer than half of the Southern states (six states plus D.C.) have a minimum wage higher than the federal minimum wage of $7.25 per hour. In every other region, most states have minimum wages higher than $7.25 (EPI 2023). In fact, of the 20 states where the federal minimum wage applies, 10 are in the South.
Many Southern states have weak, if any, labor law enforcement. This means that workers in the South, who are already receiving low minimum wages, are particularly vulnerable to wage theft. This is especially true in industries such as food and drink services, agriculture, and retail (Cooper and Kroeger 2017).
Cooper and Kroeger (2017) analyze data on the share of workers who have experienced minimum wage violations—i.e., were paid less than the applicable minimum wage—in the 10 most populous U.S. states. They find that large shares of low-wage workers in Florida (24.9%), North Carolina (12.3%), Texas (10.8%), and Georgia (9.4%) have experienced minimum wage violations.
Failing to pay the minimum wage is just one of the ways employers cheat workers out of their earnings.2 Employers who commit wage theft are rarely punished (Cooper and Kroeger 2017). In Florida, for example, there is no state Department of Labor to enforce wage standards; all of the state’s wage and hour enforcement is deferred to federal authorities. While Alabama, Delaware, Georgia, Louisiana, Mississippi, and South Carolina are states which technically do have Departments of Labor (DOLs), their DOLs do not make any concrete effort to recover wages that are stolen by employers (Mangundayao et al. 2021).
Wage theft victims can technically pursue action against an unscrupulous employer by submitting claims with the U.S. Department of Labor’s Wage and Hour Division. However, in the absence of in-state enforcement, businesses face little risk of being held accountable if they cheat their employees.
Notably, some Southern states have actively fought against federal government efforts to raise wages in their states. In 2022, the attorneys general of Texas, Louisiana, and Mississippi sued the federal government to prevent an increase in the wages of federal contractors (Texas v. Biden 2022).
It is important to understand that federal standards governing minimum wages, overtime, and even what activities are to be included in the number of hours worked were designed to keep wages low in the South. When the Fair Labor Standards Act (FLSA) was enacted in 1938 establishing these rules, large categories of workers—primarily agricultural workers, domestic workers, tipped workers, and public-sector workers—were excluded from its protections.
Agricultural workers, domestic workers, and tipped workers were excluded specifically because the formerly enslaved were limited almost entirely to these lines of work across the South; Southern lawmakers would not agree to vote for the legislation without these exclusions (Dixon 2021; Perea 2011). The practice of using tips to compensate service workers in the United States in fact proliferated in the 19th century after the end of slavery; it allowed businesses to hire the formerly enslaved without having to pay them, instead forcing them to rely on tips (Dixon 2021; Tye 2005).
When the FLSA was amended in 1966 to include service workers—among other coverage expansions—a special “tip credit” was created that allowed employers to count tips received by staff against a portion of the minimum wage the employer was required to pay, effectively creating a separate, lower minimum wage (Allegretto and Cooper 2014). Today, Southern tipped workers continue to rely heavily on their tips. The federal minimum wage for tipped workers, which applies in most Southern states, is only $2.13 per hour—a level that has remained unchanged since 1991 (Schweitzer 2021).
We continue to see the influence of racism and sexism in the low wages and lack of protections offered to workers in jobs that were historically held by enslaved people. Domestic work, for example, has historically been—and continues to be—performed by Black, brown, and immigrant women. These women work as nursing, psychiatric, and home health aides; personal and home care aides; and nursing assistants in private households. Across the South, Black women make up 43% of home health care workers, followed by Hispanic women at 17% (Childers, Sawo, and Worker 2022). Workers in these jobs remain undercompensated despite the clear value of this work—providing care that allows families to work and that allows elderly and disabled Southerners to age in their homes (Childers, Sawo, and Worker 2022; Robertson, Sawo, and Cooper 2022).
Minimal levels of regulation
Another key component of the Southern economic development model is regulating businesses as little as possible. As noted in the previous section, this means lack of regulation or enforcement around labor laws such as federal minimum wage laws, overtime laws, and safety standards for workers (Cooper and Kroeger 2017; Fleischman and Franklin 2017; FPI 2022; Terrell and St. Julien 2023; Waldman 2017). It also includes minimal regulation of business activities that pollute the air, water, and soil, which disproportionately impact Black and brown communities.
In Louisiana, there is a roughly 130-mile-long area between Baton Rouge and New Orleans running along the Mississippi River that is known as “Cancer Alley.” Cancer Alley has a heavy concentration of 200 or more oil refineries and petrochemical plants spewing toxic chemicals into the air, elevating cancer and other health risks among the area’s predominantly Black residents (Laughland 2023; Terrell and St. Julien 2022). Terrell and St. Julien (2023) found that lax permitting processes in the state have resulted in Black and brown communities across Louisiana having a seven to 21 times greater exposure to air pollutants—especially those from chemical manufacturers—compared with white communities.3
Younes et al. (2021) mapped the spread of cancer-causing chemicals in air pollution across the country that moves into residential neighborhoods and exposes residents. They identified places across the country where residents were exposed to hazardous chemicals, with or without their knowledge. Younes et al.’s study found that almost all states with the highest levels of exposure are Southern states, with Texas and Louisiana being the states whose residents have the greatest excess exposure. In Texas, for example, one of the largest refineries globally has put millions of pounds of toxic chemicals in the air over the years. The result is an excess risk of cancer in these areas of three to six times what is considered acceptable by the EPA (Younes et al. 2021).
These communities are exposed to these dangerous chemicals because of the lax regulations of policymakers in Southern states. For example, in Louisiana, land use plans which label many majority-Black districts as “industrial” or “future industrial” have been approved despite these being residential communities (Laughland 2023). And according to a lawsuit by residents of these communities, every request by these large industrial corporations to locate in predominantly Black communities is approved by local governments (Laughland 2023).
Instead of expanding their staffing for pollution control, states with the worst environmental exposures have actually cut funding to state environmental agencies. In Texas and Louisiana, the states whose residents face the highest rate of exposure to toxic chemicals, funding for state environmental agencies was cut by 35.2% and 34.8% respectively between 2008 and 2018. Funding was down by 33.7% in North Carolina, 32.8% in Delaware, 20.8% in Georgia, 20.3% in Tennessee, and 10% in Alabama. But not all Southern states cut their operational funding for state environmental agencies: Maryland, South Carolina, Arkansas, Oklahoma, Florida, and West Virginia increased their funding (EIP 2019).
Low income and corporate taxes
Next, the Southern economic development model seeks to severely limit corporate and personal income taxes, particularly any that would increase the tax burden on higher-income households and individuals.
The roots of the South’s tax structure
To understand public attitudes toward taxes across the South, it is important to consider the roots of the current stance on taxes in the Southern economic development model. Before the Civil War, taxes on enslaved people were paid primarily by wealthy plantation owners and constituted a significant source of revenue for states across the South (Hill et al. 2019; Lyman 2017).
After slavery was abolished, plantation owners represented themselves as “concerned taxpayers” who opposed compensating for lost state revenue from taxes on enslaved people with rising property taxes. They were joined by poor white farmers who would now also be subject to rising property taxes raised by newly—and temporarily—empowered Black political leaders.
These leaders were raising taxes to provide basic services such as public education and to rebuild infrastructure after the devastation of the Civil War. But wealthy Southerners stoked racial animus to divide poor and working-class Southerners along the lines of race and ensure majority support to implement highly regressive tax policies (Williamson 2021; Young 2023).
Low corporate and income taxes force reliance on regressive sales taxes
Today, Southern politicians, business interests, and other wealthy Southerners continue to seek to eliminate or severely limit corporate and personal income taxes. For example, several Southern states used temporary budget surpluses—surpluses resulting from the distribution of federal dollars to states intended to address COVID-19 and the associated recession—as an excuse to further cut already low income-tax rates (Das 2022b).
Corporate and personal income taxes tend to be progressive, meaning they are structured such that higher-income earners pay a larger share of their income in taxes, while lower-income earners pay a smaller share. But when collection of corporate and personal income taxes declines, states are forced to rely more heavily on sales and property taxes, which are regressive. When sales and property taxes are assessed, lower-income people end up paying a larger share of their income for those taxes than higher-income people do (Wiehe et al. 2018; Young 2023).
Texas, Florida, and Tennessee have no income tax. In other Southern states with income taxes, tax rates are so low that they fail to raise adequate revenue, requiring the state to rely on sales and property taxes and fees and fines to pay for many public services including education, public health, public safety, infrastructure, and other services.
In 2019, sales tax accounted for more than 40% of all state and local tax revenue in many Southern states. These included Tennessee (56.6%), Louisiana (53.3%), Florida (50.9%), Arkansas (49.6%), Alabama (48.0%), and Mississippi (45.5%). These shares are substantially higher than the 34.4% of state and local tax revenue that sales taxes account for nationally (Das 2022a).
To generate this revenue, these states had sales taxes ranging from 4.0% in Alabama to 7.0% in Mississippi and Tennessee. And while most states at least exempt food from sales taxes, as of January 2023, Mississippi, Alabama, and Oklahoma did not (Tax Policy Center 2023).4
This approach to taxes means that public services are underfunded in the South
Proponents of this tax model argue that it increases the incomes of all households by allowing them to keep more of their money. Further, they argue that it allows businesses to reinvest and grow their businesses, thereby increasing tax revenue. But this regressive approach to taxes simply means there is not sufficient revenue to properly fund education, health care, public transportation, water and sewer system maintenance, and the many other public services Southerners rely on (Das 2022b).
The lack of resources to provide services for ordinary Southerners is further exacerbated when state governments give huge subsidies to private companies. For example, Mississippi gave a $247 million subsidy to Steel Dynamics in 2022, and South Carolina spent $1.3 billion on a subsidy for Scout Motors in 2023 (Good Jobs First 2023a, 2023b). To illustrate how these subsidies harm South Carolinians specifically, we can consider the impact of abatements on public education. In fiscal year 2021, South Carolina public schools reported that they lost $534 million in property tax revenues to abatements, money that would have gone to funding school staff and providing services to students (Wen 2022). The districts that lost the most funding had a majority of students coming from low-income households that qualified for free or reduced-price lunches (Wen 2022). This harms students, families, and communities—with the harshest impacts on those facing the greatest hardships.
A weak safety net
The Southern economic development model is further characterized by a weak social safety net. Most Southern states offer relatively few and weak protections against hardship for individuals and families who suffer some kind of economic shock, such as the loss of a job, an illness, or the need to care for someone. This weak social safety net cements low-income Southerners’ precarity, further disempowering the labor force by making any economic shock all the more harmful. In this context, a Southern worker with little private savings is more likely to take or endure exploitive or underpaid work.
Southerners face greater insecurity when they lose their jobs
Unemployment insurance (UI) , is a crucial component of the social safety net, meant to ensure families have economic security in the face of a job loss by replacing some percentage of their prior earnings (Bivens and Banerjee 2021). During times of crisis, such as the COVID-19 recession, UI also helps stabilize the broader economy by enabling households to continue spending, which helps maintain overall consumer demand (Bivens et al. 2021). While the UI system is funded jointly by federal and state funds, it is the state that has primary control over who is eligible to receive benefits, the levels and duration of benefits, and how the system is financed (Bivens et al. 2021).
UI is also a system that, if properly designed, helps support workers’ bargaining power. By giving workers support when they lose a job, UI allows those workers to take the time necessary to find a job that matches their skills and that pays as well as the one they lost. Conversely, weak UI benefits force many workers to take the first available job—even if it suits their skills poorly or pays less than the job they lost.
While many states’ UI systems need reform, the level and ease of accessing benefits in many Southern states is particularly problematic. Data show that of the 10 states with the lowest maximum weekly UI benefit amounts, seven—Mississippi ($235), Alabama ($275), Florida ($275), Louisiana ($275), Tennessee ($275), South Carolina ($326), and North Carolina ($350)—are in the South (The Century Foundation 2023). Many Southern states also have particularly onerous requirements for accessing benefits, which are made available for incredibly short durations. For example, most states make standard UI benefits available for a maximum of 26 weeks. Only 13 states set their maximum number of weeks below 26, more than half of which are Southern states: Alabama (14 weeks), Arkansas (16), Florida (12), Georgia (14), Kentucky (12), North Carolina (12), South Carolina (20), and Oklahoma (16) (CBPP 2023b).
The fact that the states where most Black Americans live have the least accessible UI systems with the least generous benefits, shortest durations for receiving benefits, and some of the most onerous requirements is not a coincidence or an accident. The UI system as structured is rooted in a racist agenda: Southern Democrats agreed to support the New Deal only if states controlled access to UI and other social benefits. This allowed them to design systems that would limit Black workers’ access to benefits (Edwards 2020; Traub and Diehl 2022).
Southerners face barriers to health care access
Full participation in the economy—not to mention in one’s family and community—are much easier when one is healthy both physically and mentally. Unfortunately, far too many people in the United States lack access to quality, affordable health care. This problem is particularly salient across Southern states; Southerners are less likely to have access to health insurance than those living in other regions. In 2020, 7.7% of all children living in Southern states lacked health insurance coverage compared with 3.3% in the Northeast, 4.4% in the Midwest, and 4.9% in the West. For working age adults, the share was 16.4% in the South, 6.6% in the Northeast, 8.6% in the Midwest, and 11.3% in the West (Keisler-Starkey and Bunch 2021).
The 2010 Patient Protection and Affordable Care Act (ACA) included an expansion of Medicaid eligibility to adults with incomes up to 138% of the official poverty line. While most states have adopted and implemented the expansion, 10 states have failed to adopt it, seven of which are in the South: Mississippi, Alabama, Georgia, South Carolina, Florida, Tennessee, and Texas (KFF 2023).5 This is one reason Southerners are less likely to have health insurance coverage, which is particularly concerning given high rates of illness and comorbidities across the South (Akinyemiju et al. 2016).
The failure to expand Medicaid creates additional challenges even for those who have insurance coverage but live in rural areas, denying increased revenue to many rural hospitals that were already facing closure (Levinson, Godwin, and Hulver 2023).
Southern states have some of the lowest levels of cash assistance for families with children
Aid to Families with Dependent Children (AFDC), a cash assistance program for poor families with children, was established in 1935 as Aid to Dependent Children (ADC).6 In 1996, the Personal Responsibility and Work Opportunity Act (PRWORA) replaced AFDC with the Temporary Assistance to Needy Families (TANF). TANF differs from AFDC in several important ways. Under AFDC, states could receive unlimited federal matching funds. Under TANF, federal support is distributed to states through a block grant. TANF also has five-year lifetime limits on the receipt of benefits and requires that states increase their work participation rates for TANF recipients (DHHS n.d.).
TANF is funded by the federal government, but states determine benefit levels, set income and resource limits, and administer or oversee administration of the program. They have a great deal of discretion in how they use TANF funds because the specific goals of the program are so broad. The stated goals of the program are to (1) assist families in need so children can be cared for in their own homes; (2) reduce parental dependence on government by promoting job training, work, and marriage; (3) prevent out-of-wedlock pregnancies; and (4) encourage two-parent families (CBPP 2022; DHHS n.d.).
Under the first goal, states can provide direct cash assistance to families to provide for their children (CBPP 2022; DHHS n.d.). In 1997, 71% of TANF dollars were spent in direct cash assistance, but by 2020, this share had fallen to just 22% nationally (Azevedo-McCaffrey and Safawi 2022). There are, however, large variations in TANF spending by state. In 2021, 15 states spent 10% or less of TANF dollars to provide cash assistance to families. Almost half of these—Alabama, Arkansas, Delaware, Louisiana, Mississippi, North Carolina, and Texas—are in the South.7 Alabama spent just 7% of their TANF dollars on general spending, most in cash dollars. They spent 1% of their TANF dollars on work supports, 11% on childcare, but 29% on “other” services (CBPP 2023a).8 Mississippi spent 6% in general spending, with only 3% going to childcare, while 17% of spending fell under the “other” category (CBPP 2023c). Across the South, only the District of Columbia and Kentucky spent 30% or more of their TANF funds on direct assistance, and in Kentucky, more than half of those funds went to foster care for children fostered by relatives and adoption and guardianship subsidies (Azevedo-McCaffrey and Safawi 2022).
Despite spending millions of dollars on TANF-related activities, states had millions of unspent TANF dollars as of 2021.9 For example, Alabama had $113 million in unspent TANF dollars in 2021—amounting to 122% of their $93 million block grant for the year (CBPP 2023a). At $98 million, Mississippi’s unspent TANF funds amounted to 113% of their $86 million grant for that year (CBPP 2023c). Texas and Oklahoma each had more than $300 million in unspent TANF funds (CBPP 2023d; CBPP 2023f). Tennessee was even worse, with $798 million in unspent funds (CBPP 2023e).
Compounding the impact of unspent TANF dollars are low benefit levels in many states, especially in the South. The maximum monthly benefit for a single mother with two children ranges from $204 in Arkansas to a high of $1,151 in New Hampshire. There are only four Southern jurisdictions with a benefit amount of $500 or more for a one adult three-person family: the District of Columbia ($665), Maryland ($727), Virginia ($587), and West Virginia ($542) (Thompson, Azevedo-McCaffrey, and Carr 2023).
The maximum nominal TANF benefit in 2022 is the same or lower than it was in 1996 in 16 states, seven of which—Arkansas, Delaware, Florida, Georgia, Kentucky, North Carolina, and Oklahoma—are in the South. The result is that the inflation-adjusted value of TANF benefits in these states is 45% to 56% lower than it was in 1996 (Thompson, Azevedo-McCaffrey, and Carr 2023).10
The current structure of TANF in many Southern states reflect efforts of politicians to control the behavior and reproduction of Black women and compel their participation in the low-wage labor market (Floyd et al. 2021; King v. Smith 1968; CBPP 2022). Historically, states have used concepts of “deservingness,” “suitable homes,” and the “man in the house” to exclude Black families from the program.
To be deserving, a mother needed to be widowed, have her husband be unable to provide due to disability, or have been abandoned by the children’s father “through no fault of the mother.” A home was “unsuitable,” by definition, if the mother was unwed or engaged in sexual activity outside of marriage (Floyd et al. 2021; Floyd and Pavetti 2022). The “man in the house” rule denied mothers benefits if a man was found in the house or if the mother was found to be sexually active even if no man lived in the house with her and her children. These rules applied regardless of whether the man the mother was involved with was the children’s father (Floyd et al. 2021; King v. Smith 1968; O’Connor 1969). Today, states with larger Black populations—primarily Southern states where most of the Black population lives—tend to have more stringent requirements for accessing TANF benefits, and those benefits tend to be more meager (Shrivastava and Thompson 2022).
Anti-union policies
Crucially, advocates of the Southern economic development model vociferously oppose unions and other collective actions in which workers band together—especially across racial, ethnic, and immigration statuses. Research has shown that higher rates of unionization are associated with higher wages, better working conditions, less inequality, less racial animosity, greater economic mobility, and greater civic participation (Banerjee et al. 2021; Freeman et al. 2015; Frymer and Grumbach 2020; Mishel 2021; Mishel, Rhinehart, and Windham 2020). Given these effects, it is unsurprising that states across the South have adopted policies that hamstring workers’ ability to form unions, which pose a threat to the Southern economic development model.
First, unions threaten the Southern economic model because they have historically been the primary counterweight against businesses seeking to keep workers’ wages and benefits low. In this way, unions threaten the central economic goal of the Southern model, which is to keep labor costs as low as possible. Second, the labor movement in the U.S. today is one of the foremost institutions promoting cross-racial solidarity. Strong unions could potentially undermine the racial and class divisions that the wealthy and their political supporters have used to promote and preserve the Southern model. Third, they are a key driver of greater equity in the workplace; racial and gender wage and wealth gaps are smaller among unionized workers, and union contracts ensure that all workers receive negotiated benefits. Further, unions protect Black and brown workers from discriminatory, retaliatory, or other arbitrary firing with the “just cause” and “due process” protections they provide (Bivens et al. 2023; EPI 2021; Gould and McNicholas 2017). Finally, unions threaten the Southern economic development model because they educate and encourage civic engagement among union members. Unions shape how voters understand their interests by discussing issues and candidates. They also activate their members to actively engage in campaigns and to turn out voters (EPI 2021; Feigenbaum, Hertel-Fernandez, and Williamson 2018).
Race and the Southern economy
Historically, the economy of the American South was largely agrarian and heavily dependent on cotton, tobacco, sugar cane, and other labor-intensive agricultural products (Baptist 2014, Conlin 2018). The intense need for large pools of labor and the desire to retain the wealth generated from that labor lies at the heart of the economic policies implemented across the South since even before the colonies became the United Sates. This includes policies of enslaving African people, supporting child labor, opposing unions, and allowing corporations to pollute the environment and poison the air and water—all in the name of keeping costs low and profits high.
Even as workers have fought to improve working conditions, many Southern lawmakers have used their power to ensure employers in their states retain access to large numbers of workers at poverty-level wages. While the economy was predominantly agrarian in the past, today there are significantly more auto manufacturing, professional, technological, and business services jobs across the South. There remain many jobs in oil and gas production, animal slaughter and processing, and service jobs as well. Yet even as the industrial composition of the South has modernized, much of the region’s business practices, labor standards, and underlying political economy has not. Below is a brief historical overview of the battle to maintain a low-wage labor force, particularly one comprised of Black and brown workers.
Extracting cheap labor from indentured and enslaved people
Since before the founding of the United States, the states that would become the American South have relied on cheap labor to drive economic growth and generate the illusion of widespread prosperity. The colonies imported white indentured servants and African people to meet their labor needs. The African people would eventually shift from being indentured to becoming enslaved people (Bennett 1962; Hannah-Jones 2021). Their enslavement ensured a consistent source for Southern businesses and landowners labor needs, while minimizing the costs of that labor. Plantation owners in the South used as much cruelty as was necessary to drive ever-increasing productivity from those enslaved Africans who worked in the fields producing ever-higher yields (Baptist 2014). This not only benefited wealthy Southern planters, but also Northern industrialists, financiers, and universities. The cotton that was produced in the South was processed in Northern factories and financed by Northern banks, creating wealth for everyone except those whose labor produced the wealth (see Baptist 2014).
Little changed following emancipation
Following the Civil War, the South remained tied to an agricultural economy. Instead of relying on enslaved people to provide much of the backbreaking labor required, they shifted to a sharecropping and tenant-farmer model which still relied on “freed” Black men and women’s labor. Plantation owners would “lend” newly freed men and women resources for sharecropping, but they ensured the vast majority would never be paid enough to pay off their debts. This was a system known as debt peonage which effectively meant that most freed Black men and women were often forced to work on the same plantations and for the same wealthy white landowners who had enslaved them. This effectively tied sharecroppers to their employers and, for many Black sharecroppers, their conditions under this system were difficult to distinguish from bondage.
States across the South also employed many other ways of ensuring they could retain access to Black labor for little or no compensation. They passed sets of laws known as Black Codes. These codes were designed to closely control the actions of Black men and women and maintain the racial hierarchy. These laws made it illegal for Black people to drink from white water fountains, attend white schools, or have a supervisory position over white workers (Dewey 1952; Hill 1965). In fact, Black men and women were often limited to the same menial jobs they held before the Civil War and were often pushed out of skilled work they had previously performed (Hill 1965). And to ensure that Black people would have no other choice but to take these jobs, it was common to require proof of employment from Black men and women. If they could not prove they were employed, they could be arrested and “rented” out to work on plantations, to build railroads, or just to provide general unskilled labor. Black women were often forced back into the same domestic work roles in white homes or in agricultural work alongside Black men. These laws were justified using the constitutional loophole in the 13th Amendment that allows “slavery” and “involuntary servitude” as a punishment for crime (Alexander 2020; Mercer 2022).
Extracting cheap labor from Black and brown Southerners today
This loophole enables Southern states to incarcerate a disproportionate number of Americans. For every 100,000 people nationally in 2021, the U.S. had 664 people incarcerated in prisons, jails, and other forms of confinement. This rate far exceeds the incarceration rates of our peer nations, such as the United Kingdom (129 for every 100,000 people), Canada (104), France (93), and many other democratic nations (Widra and Herring 2021).
While the national U.S. incarceration rate dwarfs those of our peers, the prison and jail incarceration rates of 13 of the 16 Southern states and the District of Columbia exceed the national average, with Louisiana (1094), Mississippi (1031), Oklahoma (993), and Georgia (968) having the highest rates of incarceration (Mast forthcoming a; Widra and Herring 2021). Further, Black Americans are disproportionately represented among the prison populations. While Black people are just over 32% of the population in Louisiana, they are 66% of those incarcerated in prisons and 57% of those in jails (PPI 2021a). In Mississippi, they are 37% of the population but 61% of the prison and 49% of the jail population (PPI 2021b). In Oklahoma they are 7% of the population but are 27% of the prison population and 23% of those incarcerated in jails (PPI 2021c).
Of the 1.2 million state and federal prisoners in the U.S., nearly 800,000 are forced to work in the prisons themselves, in prison industries, for other state or local government agencies, or for private-sector businesses (ACLU and GHRC 2022; Mast forthcoming a, PPI 2017).11 These prisoners, disproportionately Black men, are often paid very low wages, if they are paid at all—the vast majority of work done by prisoners in Alabama, Arkansas, Florida, Georgia, Mississippi, South Carolina, and Texas is unpaid (ACLU and GHRC 2022). In many instances, mass incarceration effectively reinstates the slave system (Alexander 2020).
Hispanic men and women, especially immigrant workers, also continue to face exploitation by wealthy business owners and corporations across the South. According to Gershon (2020), by the early 1960s, 95% of meatpacking workers outside the South were unionized with wages comparable to those of steel production workers. Meatpacking companies responded by moving operations to more rural areas, and, by the 1990s, they began seeking immigrant workers to keep wages low. Black workers make up the majority of meat processing workers in states across the South (56.4% in Maryland, 67.1% in South Carolina, and 73.1% in Mississippi) but the representation of immigrant and Hispanic workers in these grueling, low-wage jobs is high. Hispanic workers make up 25.8% of the South’s meat processing workers and 26.2% are foreign-born workers (Gershon 2020; Hickey forthcoming).12
The Southern economic development strategy helps maintain the racial hierarchy
Race and ethnicity have long been used by politicians and varied economic interests to divide Southerners along racial lines and increase animosity and distrust between groups (Haney López 2014; McGhee 2021). Southern politicians fearmonger about immigrants or Black and brown people receiving “unearned” benefits as the population of young Black and brown Southerners continues to increase. This is often achieved by drawing on stereotypes or racist tropes. One example is when politicians make receiving benefits (e.g., food stamps or Medicaid) conditional upon fulfilling work requirements or passing drug tests.13 Such practices create deep divisions, which are likely among the key reasons why the South has not become more progressive—given that Black and brown communities generally favor more progressive policies and politicians—despite the increasing diversity of the population.
In the current political climate, it has become common, particularly among conservative politicians and commentators, to hear arguments that “American” voters are being disenfranchised by voters who vote “illegally” or who “cheat.” Typically, “American” appears to apply to white voters while “cheaters” and “illegal” voters seem to refer to Black and brown Americans who are simply casting their ballots legally. For example, the places where challenges and lawsuits were filed in the 2020 presidential election were primarily places with large Black and brown populations (Phillips 2020).
We also see that in many states across the country, with the South being well represented, there is a push to privatize public education and to push public dollars into privately run charter schools (Pierce 2021). Pierce (2021) writes that this move toward privatization was largely in response to the Supreme Court decision in Brown v. Board of Education which ordered states to desegregate. In other words, the push towards privatizing education in the United States aimed to preserve the racial hierarchy. Similarly, it is not uncommon to hear arguments about immigrants coming to the United States and living on public benefits (Thomas 2020). The goal of these arguments is to make the broader white population feel that their tax dollars are going to people who are deemed “undeserving” and increase the white public’s support for policies that would exclude Black and brown Southerners.
Using dog whistles to divide
Politicians and other influential and powerful interests activate racism in ways that they and their supporters can deny by using dog whistles. A dog whistle in political speech refers to discourse that uses a code that specific segments of the population understand as racial but that gives people cover to deny that they are being racist to those who abhor racism. Haney López (2014) refers to the practice of dog whistles as “a steady drumbeat of subliminal racial grievances and appeals to color-coded solidarity” (3).
The development of the concept of the “taxpayer” provides one clear example of this practice. The common appeal to the “taxpayer” developed out of racism and white supremacy. During the Reconstruction period directly following the abolition of slavery, large Black populations in states like South Carolina were large enough, especially with the support of some poor whites, to elect Black leaders. Many poor white men voted in support of policies that required raising taxes on white landowners to fund things like schools, roads, and a basic safety net. Williamson (2021) reports that the wealthy white landowners developed the identity of the “taxpayer” as a means of dividing poor white landowners and Black freedmen. Since most Black freedmen lacked any substantial landholdings, wealthy landowners could engender hostility among poor white landowners toward Blacks, even if their material conditions were not dramatically different. This approach allowed powerful interests to oppose paying taxes for general welfare and encouraged poor white Southerners—especially poorer landowners who would also be taxed—to identify with the wealthy white landowners rather than with Black elected officials (Williamson 2021).
When the concept of “taxpayer” is invoked, it is used as a dog whistle to imply that “undeserving” people—particularly “undeserving” Black, Hispanic, and immigrant people—will take advantage of public resources paid for by hardworking white people who pay their own way and do not ask for “handouts.” This also instills the idea that asking for assistance is shameful, which further reinforces the status quo.
Meanwhile, poor, working- and middle-class workers of all racial backgrounds—especially Black and brown men and women who are disproportionately low-income—pay much larger shares of their incomes for sales, income, social security, and other taxes (see Mast forthcoming b).
The conservative strategy
While these dog whistles have been part of the conservative strategy at least since Reconstruction, they have been essential in convincing the majority to support racist, exploitative, and regressive politicians and policies. For example, John Ehrlichman, Assistant to the President for Domestic Affairs under then President Richard Nixon, admitted that the Nixon administration intentionally linked anti-war hippies and Black people with drug use and then proceeded to heavily criminalize drugs in order to “arrest their leaders, raid their homes, break up their meetings, and vilify them night after night on the evening news” (Baum 2016). Campaigns based on “law and order” or appeals to increase criminal punishments for violence and/or drug use were thinly veiled racial appeals. This was especially the case following the tumultuous era of the Civil Rights Movement when Black Americans were demanding equality. Many white Americans opposed that equality, and Black rebellions—often called “riots”—broke out across the nation. These so-called riots were in response to police violence, high poverty rates, poor housing, and the many other inequities that Black communities were, and are, facing (Alexander 2020; Haney López 2014; Purnell and Hinton 2021).
When Ronald Reagan kicked off his presidential campaign, he began in the South, specifically in Philadelphia, Mississippi, which is known for the murders of James Chaney, Andrew Goodman, and Michael Schwerner for trying to register Black people to vote. Reagan used this first campaign stop to state his support for states’ rights, a signal to segregationists to support him (Sharon 2021). As his campaign moved forward, he became ever-more explicit in his racist appeals. He painted a picture of a “Chicago welfare queen,” who drove a Cadillac while using 80 different names to receive Medicaid, food stamps, and welfare totaling over $150,000 annually and of “a strapping young buck” buying T-bone steaks (presumably with food stamps) while the implied hardworking white person whose taxes provided the food stamps could only afford to buy hamburger for their family (Haney López 2014).
The key to the effectiveness of dog whistles is to deny that they have anything to do with race. It is common to hear political and economic leaders claim that it is in fact the people calling out the racism that are racist. Fortunately, we have the words of one of these conservative political leaders who was willing to admit this was indeed what they were doing. According to Lee Atwater, they had to adjust the way they used race in their electoral strategy:
You start out in 1954 by saying, “Nigger, nigger, nigger.” By 1968 you can’t say “nigger”—that hurts you, backfires. So, you say stuff like, uh, forced busing, states’ rights, and all that stuff, and you’re getting so abstract. Now, you’re talking about cutting taxes, and all these things you’re talking about are totally economic things and a byproduct of them is, blacks get hurt worse than whites.… (Perlstein 2012)
This shift can also be seen in the work of MacLean (2021). She describes how white supremacists—who wanted to maintain Jim Crow segregation in education and who had been explicitly using race to resist the Brown v. Board of Education decision—learned from Milton Friedman that they could make more progress by using more “neutral” language. They thus began saying “personal liberty,” “government failure,” and the “need for market competition” to move toward school vouchers and private schools to preserve Jim Crow segregation.
In many of the Southern states with the largest Black populations—such as Mississippi, Louisiana, and Georgia—state legislatures have been more likely to implement regressive policies that produce higher negative outcomes such as poverty, food insecurity, incarceration, reliance on fees and fines to fund government, high infant and maternal mortality, and a host of other negative outcomes. Although all low- and middle-income Southerners are negatively impacted by these policies, Black Southerners experience the worst outcomes.
Despite large and growing Black and brown populations in many Southern states, communities and workers of color still struggle to enact policy changes that would improve their economic conditions. One reason for this is state lawmakers—who are overwhelmingly white—enacting “preemption” laws to prevent elected officials in cities and counties from enacting their own local policies. Southern legislatures have preempted local governments from passing laws on everything from environmental protections and progressive taxes to minimum wages and paid sick day requirements (Blair et al. 2020). State lawmakers further interfere with these communities’ ability to improve economic conditions through restrictions on voting and practices such as gerrymandering legislative districts. Gerrymandering disempowers and dilutes the voting power of Black and brown communities, denying them greater representation in state legislatures. Yet the Black and brown populations of cities, counties, and states across the South will keep growing—even as state lawmakers continue their efforts to prevent them from deviating from the Southern economic development model.
Civil rights and labor rights
While the fight for civil rights is often discussed separately from the fight for workers’ rights, these movements have often been one and the same. Race and racism have been leveraged to weaken both movements. Dr. Martin Luther King Jr., the face of the Civil Rights Movement in the 1950s and 1960s, was standing with striking sanitation workers in Memphis when he was assassinated. He was fighting for the poor and for workers and families independent of race and ethnicity.
Whenever civil rights and labor leaders have been able to bring Black and white workers together to fight to improve their working conditions, Southern elites wielded notions of white supremacy and implemented policies to undermine labor generally and labor unions specifically. This was designed to ensure permanent divisions along racial lines and maintain Jim Crow race and labor relations (Pierce 2017). While right-to-work laws were pushed across the country, they initially took root in the Southern states where—due to racial terrorism, poll taxes, literacy tests, and outright violence—most Black people (and many poor white people) could not vote. Working together would have empowered both Black and white workers, but it also would have undermined the racial order in the South.
According to Pierce (2017) and Griffith (1988), while unions like the Congress of Industrial Organizations (CIO) were organizing both Black and white workers, the Christian American Association was raising money from wealthy Southern planters and industrialists to get anti-union laws enacted. This same group was also enlisted to help fight against the New Deal. Similarly, when Black and white workers came together to form the Knights of Labor following the Civil War in Virginia, Black voters were disenfranchised once white politicians were able to regain control of state government and white workers were offered privileges not available to Black workers to maintain the racial hierarchy (Scribner 2021).
Opponents to interracial solidarity and union organizing warned:
White women and White men will be forced into organizations with Black African apes…whom they will have to call ‘brother’ or lose their jobs. (Pierce 2017)
Other material designed to maintain the racial divisions include Figure B, a flyer produced to motivate support for right-to-work in North Carolina, which highlights that George Benjamin, a Black man, would be in charge of organizing white workers.
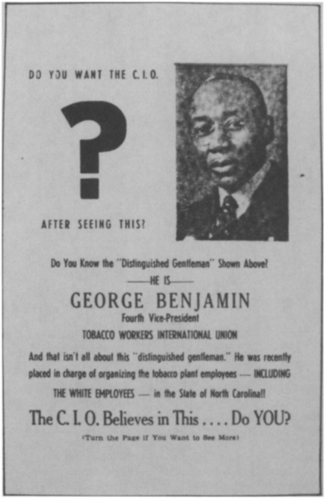
Figure B. This flyer was an effort to mobilize racial prejudice against the CIO. The irony here is that, according to Griffith (1988), the Tobacco Workers International Union under criticism was an American Federation of Labor (AFL) affiliate, one which did not share the CIO’s progressive position on interracial organizing. (Photo by David Haberstich. Courtesy of Donald McKee, cited in Griffith 1988.)
In 1944, Arkansas and Florida became the first two states to adopt the anti-worker right-to-work laws. When the key leader of these efforts, Vance Muse, was called out for his use of racism to achieve his goals, he reportedly said “They call me anti-Jew and anti-nigger. Listen we like the nigger—in his place” (Pierce 2017).
Southern politicians and employers were not only interested in using their state and local policies to maintain the racial hierarchy; they also wielded power at the national level as well, threatening to oppose federal legislation that did not exclude Black workers and families from the protections and benefits of federal laws. The exclusion of Black workers was not explicit in the legislation. Testimony and debates over federal legislation leaves little doubt about their goals, however. For example, when the Fair Labor Standards Act was being debated, Southern Democrats threatened to tank the legislation if Black workers were included:
The organized Negro groups of the country are supporting [the FLSA] because it will, in destroying state sovereignty and local self-determination, render easier the elimination and disappearance of racial and social distinctions…. (Congressman Cox of Georgia, cited in Perea 2011)
Another congressman, Representative J. Mark Wilcox of Florida remarked:
There has always been a difference in the wage scale of white and colored labor. So long as Florida people are permitted to handle the matter, this delicate and perplexing problem can be adjusted; but the federal government knows no color line and of necessity it cannot make any distinction between the races. We may rest assured, therefore, that …it will prescribe the same wage for the Negro that it prescribes for the White man. …Those of us who know the true situation know that it just will not work in the South. You cannot put the Negro and the White man on the same basis and get away with it. (Perea 2011)
It was not just politicians; however, employers shared the same sentiments with one employer stating:
A Negro makes a much better workman and a much better citizen, insofar as the South is concerned, when he is not paid the highest wage. (Perea 2011)
These attitudes and threats to the passage of important legislation was not limited to the FLSA. The same threats were made to ensure the exclusion of agricultural and domestic workers—jobs primarily filled by Black men and women across the South—from the protections of the National Labor Relations Act. As noted above, racism and maintaining the racial hierarchy in the South was at the root of many policies including taxation, policing, and economic policies. In institution after institution, efforts were made to ensure that Black labor could be extracted as cheaply as possible. And while there was also a great desire to get white labor cheaply as well, there was a clear sense that white workers must always be above Black workers to maintain the racial hierarchy (Perea 2011; Dixon 2021).
The changing demography of the South is an opportunity to uplift everyone
The American South is a dynamic region of the country with a growing population that is increasingly diverse. Made up of 16 states and the District of Columbia—including Texas and Florida, two of the largest states in the country—the South is home to almost four in 10 Americans. These are Americans whose lives and livelihoods are heavily shaped by the state and local policies implemented across the region. Not only is the South the largest region of the country, but it is also the fastest growing. Figure C shows that over the last few decades the share of the population living in the South grew faster and larger than the population of any other region. In fact, the share of Americans living in the Midwest and the Northeast declined.
The share of Americans living in the South is the largest of any region and growing: Share of U.S. population by region, 1910 to 2020.
| South | Northeast | Midwest | West | |
|---|---|---|---|---|
| 1910 | 31.9% | 28.0% | 32.4% | 7.7% |
| 1920 | 31.2% | 28.0% | 32.1% | 8.7% |
| 1930 | 30.7% | 27.9% | 31.3% | 10.0% |
| 1940 | 31.5% | 27.2% | 30.4% | 10.9% |
| 1950 | 31.2% | 26.1% | 29.4% | 13.3% |
| 1960 | 30.7% | 24.9% | 28.8% | 15.6% |
| 1970 | 30.9% | 24.1% | 27.8% | 17.1% |
| 1980 | 33.3% | 21.7% | 26.0% | 19.1% |
| 1990 | 34.4% | 20.4% | 24.0% | 21.2% |
| 2000 | 35.6% | 19.0% | 22.9% | 22.5% |
| 2010 | 37.1% | 17.9% | 21.7% | 23.3% |
| 2020 | 38.1% | 17.4% | 20.8% | 23.7% |
Source: Author's analysis of U.S Census Bureau’s Historical Population Change Data.
This growth in the population of the South reflects a natural increase in the region—more births than deaths. It also reflects international immigration–especially across the Southern border from Mexico, Central and South America, and the Caribbean—as well as domestic migration to the region. While politicians point to population growth across the South to argue for the positive impacts of their policies, this increase tends to be concentrated in specific states and cities. For example, while Texas and Florida had the highest population growth from 2021 to 2022, Louisiana, West Virginia, Maryland, and Mississippi were in the top 10 for population decline (U.S. Census Bureau 2022).
Many of those moving to the South from other regions, including New York and California, are seeking cheaper housing (Henderson 2016). Land generally tends to be cheaper across the South, contributing to housing that is much more affordable than places like California and New York. Texas and Florida also benefit from immigration across the Southern border and the Caribbean.
The widespread use of air conditioning during the 1960s and 1970s further contributed to population growth across the region. The oppressive heat during summer months along with high humidity left many Southerners in misery. This has been fundamentally changed, however, by air conditioning in cars, homes, and businesses (Arsenault 1984). As Figure C shows, before 1980 the share of the population living in the South fluctuated around 30–31%. From 1980 onward, it has continued to increase in each subsequent decade.
This report highlights the true origins of key components of the failed Southern economic development strategy—the extraction of labor from Black Americans after the end of slavery and from Black and brown Americans today as cheaply as possible. The emphasis on low wages, lack of regulation, regressive taxation and giveaways to corporations has not, and cannot, produce broadly shared prosperity. It was never designed to do so.
The youthful and increasingly diverse population across the South, however, presents a great opportunity to shift the policy landscape across the region. While wealthy and powerful people across the region have fought long and hard to keep the people divided and to maintain the racial hierarchy that maintains these divisions, Southerners can choose a different way forward. Southerners can demand an economic strategy that raises wages, strengthens the safety net, implements fair and progressive taxation, and perhaps most importantly, empowers workers to act on their own behalf by unionizing. This approach can help eliminate the racial hierarchy that holds all Southerners back from an economically secure future. But, as long as the powerful can keep low- and middle-income Southerners focused on racial, political, and economic divisions, they can keep them from seeing what they have in common: They are all being exploited by those at the top.
Notes
1. Enslaved men and women might be “hired out” to a third party if their labor was not immediately needed. In some instances, they might be allowed to retain a portion of the money generated (Butler 2022).
2. See Cooper and Kroeger 2017 for descriptions of other forms of wage theft.
3. While “Cancer Alley” is a high-profile area in the environmental racism literature, Terrell and St. Julien (2023) report that there are other industrial areas of the state with higher exposure to these toxins.
4. As of September 1, 2023, the sales tax on food in Alabama dropped from 4.0% to 3.0%. For more information, see Sell 2023.
5. North Carolina has adopted the expansion of Medicaid, but as of September 2023, it had not yet been implemented; implementation is dependent on the passage of the 2023–2024 budget. Virginia and Oklahoma adopted the Medicaid expansion in 2016 and 2021, respectively (KFF 2023).
6. ADC was changed to AFDC in 1962.
7. The remaining states spending 10% or less of funds in direct assistance were primarily in the Midwest, with two in the Northeast. The Midwestern states spending 10% or less are North Dakota, Michigan, Illinois, Indiana, Missouri, and Kansas. The Northeastern states are Connecticut and New Jersey. See the complete map here.
8. “Other” includes a wide range of expenditures across states, but can include short-term benefits for families in crisis; transfers to the social services block grant; after school programs; pregnancy prevention; and programs promoting two-parent families (Azevedo-McCaffrey and Safawi 2022).
9. States can carry unspent federal TANF dollars over into future years.
10. To a see graphic representation of change in the real value of TANF benefits, see here.
11. Mast (forthcoming a) is a fact sheet focused on mass incarceration and how it continues the tradition of extracting cheap labor from primarily Black Americans in states across the South. It describes ways that Black Americans continue to have their labor extracted by the state or leased out to private companies.
12. Hickey forthcoming includes fact sheets that will address the experiences of immigrant workers and provide a deep dive on domestic workers and food processing workers, especially meat processing workers.
13. Arkansas Department of Human Services 2023 and Reuters Fact Check 2022 are examples of these dog whistles.
References
Akinyemiju, Tomi, Megha Jha, Justin Xavier Moore, and Maria Pisu. 2016. “Disparities in the Prevalence of Comorbidities Among U.S. Adults by State Medicaid Expansion Status.” National Institute of Health.
Allegretto, Sylvia, and David Cooper. 2014. Twenty-Three Years and Still Waiting for Change: Why It’s Time to Give Tipped Workers the Regular Minimum Wage. Economic Policy Institute, July 2014.
Alexander, Michelle. 2020. The New Jim Crow: Mass Incarceration in the Age of Colorblindness. New York: The New Press.
American Civil Liberties Union and Global Human Rights Clinic (ACLU and GHRC). 2022. Captive Labor: Exploitation of Incarcerated Workers.
Arkansas Department of Human Services. 2023. “Governor Sarah Huckabee Sanders Directs DHS to Add Work Requirements to Medicaid Program” (press release). February 15, 2023.
Arsenault, Raymond. 1984. “The End of the Long Hot Summer: The Air Conditioner and Southern Culture.” Journal of Southern History 50, no. 4: 597–628.
Azevedo-McCaffrey, Diana, and Ali Safawi. 2022. To Promote Equity, States Should Invest More TANF Dollars in Basic Assistance. Center on Budget and Policy Priorities, January 2022.
Banerjee, Asha, Margaret Poydock, Celine McNicholas, Ihna Mangundayao, and Ali Sait. 2021. Unions Are Not Only Good for Workers, They’re Good for Communities and for Democracy. Economic Policy Institute, December 2021.
Baptist, Edward. 2014. The Half Has Never Been Told: Slavery and the Making of American Capitalism. New York: Basic Books.
Baum, Dan. 2016. “Legalize it All: How to Win the War on Drugs.” Harpers Magazine, April 2016.
Bennett, Lerone Jr. 1962. Before the Mayflower: A History of the Negro in America 1619-1962. Chicago: Johnson Publishing Company, Inc.
Bivens, Josh, and Asha Banerjee. 2021. How to Boost Unemployment Insurance as a Macroeconomic Stabilizer: Lessons from the 2020 Pandemic Programs. Economic Policy Institute, October 2021.
Bivens, Josh, Celine McNicholas, Kyle K. Moore, and Margaret Poydock. 2023. Unions Promote Racial Equity (fact sheet). Economic Public Policy, July 31, 2023.
Bivens, Josh, Melissa Boteach, Rachel Deutsch, Francisco Díez, Rebecca Dixon, Brian Galle, Alix Gould-Werth, Nicole Marquez, Lily Roberts, Heidi Shierholz, William Spriggs, and Andrew Stettner. 2021. “Primer: How the Unemployment Insurance System Operates.” In Reforming Unemployment Insurance: Stabilizing a System in Crisis and Laying the Foundation for Equity, a joint project of Center for American Progress, Center for Popular Democracy, Economic Policy Institute, Groundwork Collaborative, National Employment Law Project, National Women’s Law Center, and Washington Center for Equitable Growth, June 2021.
Blair, Hunter, David Cooper, Julia Wolfe, and Jaimie Worker. 2020. Preempting Progress: State Interference in Local Policymaking Prevents People of Color, Women, and Low-Income Workers from Making Ends Meet in the South. Economic Policy Institute, September 2020.
Bode, Frederick A. 2020. “Tenant Farming.” New Georgia Encyclopedia. Last updated September 25, 2020.
Butler, Nic. 2020. “Episode #147: Self-Purchase: The Price of Freedom from Slavery.” Charleston Time Machine (podcast), February 28, 2020.
Cagin, Seth, and Philip Dray. 1988. We Are Not Afraid: The Story of Goodman, Schwerner, and Chaney and the Civil Rights Campaign for Mississippi. New York: Macmillan.
Center on Budget and Policy Priorities (CBPP). 2022. Policy Basics: Temporary Assistance for Needy Families. Updated March 2022.
Center on Budget and Policy Priorities (CBPP). 2023a. Alabama TANF Spending (fact sheet).
Center on Budget and Policy Priorities (CBPP). 2023b. Policy Basics: How Many Weeks of Unemployment Compensation Are Available? Center on Budget and Policy Priorities. Updated December 2023.
Center on Budget and Policy Priorities (CBPP). 2023c. Mississippi TANF Spending (fact sheet).
Center on Budget and Policy Priorities (CBPP). 2023d. Oklahoma TANF Spending (fact sheet).
Center on Budget and Policy Priorities (CBPP). 2023e. Tennessee TANF Spending (fact sheet).
Center on Budget and Policy Priorities (CBPP). 2023f. Texas TANF Spending (fact sheet).
The Century Foundation. 2023. Unemployment Insurance Data Dashboard. Accessed June 2023.
Childers, Chandra, Marokey Sawo, and Jaimie Worker. 2022. “State Policy Solutions for Good Home Health Care Jobs—Nearly Half Held by Black Women in the South—Should Address the Legacy of Racism, Sexism, and Xenophobia in the Workforce.” Working Economics Blog (Economic Policy Institute), August 15, 2022.
Conlin, Erin L. 2018. “African American and Latino Workers in the Age of Industrial Agriculture.” In Reconsidering Southern Labor History: Race, Class, and Power, edited by Matthew Hild and Keri Leigh Merritt, 174–190. Gainesville, Fla.: University of Florida Press.
Cooper, David, and Teresa Kroeger. 2017. Employers Steal Billions from Workers’ Paychecks Each Year: Survey Data Show Millions of Workers Are Paid Less Than the Minimum Wage, at Significant Cost to Taxpayers and State Economies. Economic Policy Institute, May 2017.
Das, Kamolika. 2022a. Creating Racially and Economically Equitable Tax Policy in the South. Institute on Taxation and Economic Policy, June 2022.
Das, Kamolika. 2022b. Most States Used Surpluses to Reduce Taxes but Not in Sustainable or Progressive Ways. Institute on Taxation and Economic Policy, July 2022.
Department of Health and Human Services (DHHS). n.d. “Aid to Families with Dependent Children (AFDC) and Temporary Assistance for Needy Families (TANF)—Overview” (web page). Office of the Assistant Secretary for Planning and Evaluation.
Dewey, Donald. 1952. “Negro Employment in Southern Industry,” Journal of Political Economy 60, no. 4: 279–293.
Dixon, Rebecca. 2021. “From Excluded to Essential: Tracing the Racist Exclusion of Farmworkers, Domestic Workers, and Tipped Workers from the Fair Labor Standards Act.” Testimony before the U.S. House Committee on Education and the Workforce, Subcommittee on Workforce Protections, Washington, D.C., May 3, 2021.
Economic Policy Institute (EPI). 2021. Unions Help Reduce Disparities and Strengthen Our Democracy (fact sheet). April 23, 2021.
Economic Policy Institute (EPI). 2023. Minimum Wage Tracker. Last updated July 1, 2023.
Edwards, Kathryn A. 2020. “The Racial Disparity in Unemployment Benefits.” RAND Blog, July 15, 2020.
Environmental Integrity Project (EIP). 2019. The Thin Green Line: Cuts in State Pollution Control Agencies Threaten Public Health. December 2019.
Feigenbaum, James, Alexander Hertel-Fernandez, and Vanessa Williamson. 2018. “Right-to-Work Laws Have Devastated Unions–and Democrats.” New York Times, March 8, 2018.
Fleischman, Lesley, and Marcus Franklin. 2017. Fumes Across the Fence-Line: The Health Impacts of Air Pollution from Oil and Gas Facilities on African American Communities. NAACP and Clean Air Task Force, November 2017.
Florida Policy Institute (FPI). 2023. “Enforcing the Minimum Wage: Statewide Wage Theft Threatens the Potential Gains of Amendment 2.”
Floyd, Ife, and LaDonna Pavetti. 2022. Improvements in TANF Cash Benefits Needed to Undo the Legacy of Historical Racism. Center on Budget and Policy Priorities, January 2022.
Floyd, Ife, LaDonna Pavetti, Laura Meyer, Ali Safawi, Liz Schott, Evelyn Bellew, and Abigail Magnus. 2021. TANF Policies Reflect Racist Legacy of Cash Assistance: Reimagined Program Should Center Black Mothers. Center on Budget and Policy Priorities, August 2021.
Freeman, Richard, Eunice Han, David Madland, and Brendan V. Duke. 2015. “How Does Declining Unionism Affect the American Middle Class and Intergenerational Mobility?” National Bureau of Economic Research (NBER) Working Paper no. 21638, October 2015. http://www.nber.org/papers/w21638.
Frymer, Paul, and Jacob M. Grumbach. 2020. “Labor Unions and White Racial Politics.” American Journal of Political Science 65, no. 1: 225–240. https://doi.org/10.1111/ajps.12537.
Gershon, Livia. 2020. “Why Does Meatpacking Have Such Bad Working Conditions?”. JSTOR Daily, May 8, 2020.
Griffith, Barbara S. 1988. The Crisis of American Labor: Operation Dixie and the Defeat of the CIO. Philadelphia: Temple University Press.
Good Jobs First. 2023a. “Subsidy Tracker Individual Entry: Scout Motors.” Accessed June 2023. Data for 2023.
Good Jobs First. 2023b. “Subsidy Tracker Individual Entry: Steel Dynamics.” Accessed June 2023. Data for 2022.
Gould, Elise, and Celine McNicholas. 2017. “Unions Help Narrow the Gender Wage Gap.” Working Economics Blog (Economic Policy Institute), April 3, 2017.
Haney López, Ian. 2014. Dog Whistle Politics: How Coded Racial Appeals Have Reinvented Racism and Wrecked the Middle Class. Oxford: Oxford University Press.
Hannah-Jones, Nikole, and the New York Times. 2021. The 1619 Project: A New Origin Story. New York: One World.
Henderson, Tim. 2016. “Americans are Moving South, West Again.” Stateline, January 8, 2016.
Hickey, Sebastian. The U.S. Food Production System Extracts a High Price from Black, Brown and Immigrant Food Production Workers. Economic Policy Institute, forthcoming.
Hill, Herbert. 1965. “Racial Inequality in Employment: The Patterns of Discrimination.” Annals of the American Academy of Political and Social Science 357, no. 1: 30–47.
Hill, Misha, Jenice Robinson, Alan Essig, Meg Wiehe, Steve Wamhoff, and Carl Davis. 2019. The Illusion of Race-Neutral Tax Policy. Institute on Taxation and Economic Policy, February 2019.
Hasso, Jennifer. 2021. “Pullman Porters.” Jim Crow Museum.
Kaiser Family Foundation (KFF). 2023. Status of State Medicaid Expansion Decisions: Interactive Map. December 2023.
Keisler-Starkey, Katherine, and Lisa N. Bunch. 2021. Health Insurance Coverage in the United States: 2020. U.S. Census Bureau, September 2021.
King v. Smith, 392 U.S. 309 (1968).
Laughland, Oliver. 2023. “Residents of Louisiana’s ‘Cancer Alley’ Announce Lawsuit Against Local Officials.” The Guardian, March 21, 2023.
Levinson, Zachary, Jamie Godwin, and Scott Hulver. 2023. Rural Hospitals Face Renewed Financial Challenges, Especially in States that Have not Expanded Medicaid. Kaiser Family Foundation, February 2023.
Lyman, Brian. 2017. “Alabama’s Slave Tax Forever Warped the State’s Finances, Politics.” Montgomery Advertiser, February 4, 2017.
MacLean, Nancy. 2021. “How Milton Friedman Exploited White Supremacy to Privatize Education.” Institute for New Economic Thinking Working Paper no. 161, September 2021. https://doi.org/10.36687/inetwp161.
Mangundayao, Ihna, Celine McNicholas, Margaret Poydock, and Ali Sait. 2021. More Than $3 Billion in Stolen Wages Recovered for Workers Between 2017 and 2020. Economic Policy Institute, December 2021.
Mast, Nina. Forthcoming a. Incarceration and Prison Labor in the ‘Land of the Free’. Economic Policy Institute, forthcoming.
Mast, Nina. Forthcoming b. Lack of Regulation of Workplace and Environmental Standards, Regressive Taxation, and Privatization. Economic Policy Institute, forthcoming.
McGhee, Heather. 2021. The Sum of Us: What Racism Costs Everyone and How We Can Prosper Together. New York: One World.
Mercer, Marsha. 2022. “Yes, Slavery Is on the Ballot in These States.” Stateline, August 22, 2022.
Mishel, Lawrence. 2021. The Enormous Impact of Eroded Collective Bargaining on Wages. Economic Policy Institute, April 2021.
Mishel, Lawrence, Lynn Rhinehart, and Lane Windham. 2020. Explaining the Erosion of Private-Sector Unions: How Corporate Practices and Legal Changes Have Undercut the Ability of Workers to Organize and Bargain. Economic Policy Institute, November 2020.
O’Connor, Michael. 1969. “Welfare Law—Aid to Dependent Children and the Substitute Parent Regulation—The State Loses a Scapegoat, the ‘Man-in-the-House.’” DePaul Law Review 18, no. 2: 897–906.
Perea, Juan F. 2011. “The Echoes of Slavery: Recognizing the Racist Origins of the Agricultural and Domestic Worker Exclusion from the National Labor Relations Act.” Ohio State Law Journal 72, no.1: 95–138.
Perlstein, Rick. 2012. “Exclusive: Lee Atwater’s Infamous 1981 Interview on the Southern Strategy”. The Nation, November 12, 2012.
Phillips, Kristine. 2020. “‘Damaging to our Democracy’: Trump Election Lawsuits Targeted Areas with Large Black, Latino Populations.” USA Today, December 1, 2020.
Pierce, Michael. 2017. “The Origins of Right-to-Work: Vance Muse, Anti-Semitism, and the Maintenance of Jim Crow Labor Relations.” LaborOnline (The Labor and Working-Class History Association blog), January 12, 2017.
Pierce, Raymond. 2021. “The Racist History of ‘School Choice’.” Forbes, May 6, 2021.
Prison Policy Initiative (PPI). 2017. “State and Federal Prison Wage Policies and Sourcing Information.” [Html table]. Last updated April 10, 2017.
Prison Policy Initiative (PPI). 2021a. “Comparing Louisiana’s Resident and Incarcerated Populations.” [Html graph], September 2023.
Prison Policy Initiative (PPI). 2021b. “Comparing Mississippi’s Resident and Incarcerated Populations.” [Html graph], September 2023.
Prison Policy Initiative (PPI). 2021c. “Comparing Oklahoma’s Resident and Incarcerated Populations” [Html graph], September 2023.
Purnell, Derecka, and Elizabeth Hinton. 2021. “Reclaiming the Power of Rebellion.” Boston Review, May 19, 2021.
Reuters Fact Check. 2022. “Inaccuracies in Claims Florida, Kentucky, and Missouri All Require Drug Testing for Welfare Recipients.” Reuters, December 14, 2022.
Robertson, Cassandra, Marokey Sawo, and David Cooper. 2022. All States Must Set Higher Wage Benchmarks for Home Health Care Workers. Economic Policy Institute, June 2022.
Schweitzer, Justin. 2021. Ending the Tupped Minimum Wage Will Reduce Poverty and Inequality. Center for American Progress, March 2021.
Scribner, Connor. 2021. “Fight Over Right to Work Evokes History of Richmond Unions.” VPM News, April 13, 2021.
Sell, Mary. 2023. “Grocery Sales Tax Cut Kicks in on Friday.” Alabama Daily News, August 31, 2023.
Sharon, Keith. 2021. “Can a Community Overcome Its Horrible Past? An Inside Look at Philadelphia, MS.” The Tennessean, July 15, 2021.
Shrivastava, Aditi, and Gina Azito Thompson. 2022. Cash Assistance Should Reach Millions More Families to Lessen Hardship: Access to TANF Hits Lowest Point Amid Precarious Economic Conditions. Center on Budget and Policy Priorities. February 2022.
Tax Policy Center. 2023. “State Sales Tax Rates.” Rates as of January 1, 2023.
Terrell, Kimberly A., and Gianna St. Julien. 2022. “Air Pollution Is Linked to Higher Cancer Rates Among Black or Impoverished Communities in Louisiana.” Environmental Research Letters 17, no. 1.
Terrell, Kimberly A., and Gianna St. Julien. 2023. “Discriminatory Outcomes of Industrial Air Permitting in Louisiana, United States.” Environmental Challenges 10. https://doi.org/10.1016/j.envc.2022.100672.
Texas v. Biden S.D. Tx. (2022).
Thomas, Kenneth P. 2019. The State of State and Local Subsidies to Business (policy brief). Mercatus Center, October 2019.
Thomas, Claire R. 2020. “The Invisible Wall: Public Charge Policy Impacts on Immigrant Families.” New York Law School Review 65, no. 2: 197–223.
Thompson, Gina Azito, Diana Azevedo-McCaffrey, and Da’Shon Carr. 2023. Increases in TANF Cash Benefit Levels are Critical to Help Families Meet Rising Costs. Center on Budget and Policy Priorities. February 2023.
Traub, Amy, and Kim Diehl. 2022. Reforming Unemployment Insurance Is a Racial Justice Imperative. National Employment Law Project, February 2022.
Trotter Jr., Joe William. 2019. Workers on Arrival: Black Labor in the Making of America. Berkeley, Calif.: University of California Press.
Tye, Larry. 2005. Rising from the Rails: Pullman Porters and the Making of the Black Middle Class. New York: Henry Holt.
U.S. Census Bureau. 2021.”Geographic Levels.” Last updated October 2021.
U.S. Census Bureau. 2021. “Historical Population Change Data (1910-2020)” [Html table]. Published April 26, 2021.
U.S. Census Bureau. 2022. “Table A-5. Reason for Move (Collapsed and Specific Categories): 1999–2022” [Excel file], CPS Historical Migration/Geographic Mobility Tables. Last updated August 2023.
U.S. Census Bureau. 2022. “Growth in U.S. Population Shows Early Indication of Recovery Amid COVID-19 Pandemic” (press release). December 22, 2022.
U.S. Department of Agriculture (USDA). 2003. Black Farmers in America, 1865-2000: The Pursuit of Independent Farming and the Role of Cooperatives. RBS Research Report 194, October 2002. Reprinted October 2003.
Waldman, Peter. 2017. “Inside Alabama’s Auto Jobs Boom: Cheap Wages, Little Training, Crushed Limbs: The South’s Manufacturing Renaissance Comes with a Heavy Price.” Bloomberg, March 23, 2017.
Wen, Christine. 2022. The Revenue Impact of Corporate Tax Incentives on South Carolina Public Schools 2017-2021. Good Jobs First, May 2022.
Widra, Emily, and Tiana Herring. 2021. States of Incarceration: The Global Context 2021. Prison Policy Initiative, September 2021.
Wiehe, Meg, Aidan Davis, Carl Davis, Matt Gardner, Lisa Christensen Gee, and Dylan Grundman. 2018. Who Pays? A Distributional Analysis of the Tax Systems in All 50 States. Institute on Taxation and Economic Policy, October 2018.
Williamson, Vanessa. 2021. “The Austerity Politics of White Supremacy.” Dissent, Winter 2021.
Younes, Lylla, Ava Kofman, Al Shaw, Lisa Song, and Maya Miller. 2021. “Poison in the Air.” ProPublica, November 2, 2021.
Young, Caitlin. 2023. “What Policymakers Need to Know About Racism in the Property Tax System.” Housing Matters (Urban Institute), March 15, 2023.