Full Report
Is the United States compensating teachers at a sufficient level to retain current staff and recruit a highly skilled pool of future college students into the profession? My former co-authors and I have been concerned with this question for the last two decades.1 We have been warning for years that the worsening trends documented in this series have become a significant and growing challenge for the teaching profession.
Because public school teachers must attain at least a bachelor’s degree to teach in the U.S., this research compares teachers with college graduates working in other professions. Providing teachers with compensation commensurate with that of other similarly educated and experienced professionals is necessary to retain and attract qualified workers into the profession. Over the past two decades, the weekly wages and total compensation of public school teachers have fallen further and further behind. This update adds 2022 data to this long-running series.
Key findings
- Recent high inflation has significantly reduced the average weekly wages of teachers but has had less of an effect on other college graduates. The average weekly wages of public school teachers (adjusted for inflation) decreased by $128 from 2021 to 2022, from $1,457 to $1,329 (in 2022 dollars). In contrast, inflation-adjusted weekly wages of other college graduates stayed about the same from $2,170 to $2,167 over the same period.
- The erosion of relative weekly wages for teachers continued apace in 2022. The weekly wage penalty for teachers (regression adjusted) grew considerably after controlling for factors such as differences in age, education, and state of residence. Calculated this way, the penalty reached a record 26.4% in 2022, a significant change from 6.1% in 1996 for all teachers. For men in the teaching profession, the penalty hit 36.6%, and for women, it was 21.3% in 2022.
- The benefits advantage for teachers has not been enough to offset the growing wage penalty. The total compensation penalty for teachers grew to 17.0% in 2022 from 14.2% in 2021. Large increases in the teacher wage penalty have not been offset by smaller increases in the teacher benefits advantage.
- The relative teacher wage penalty exceeds 20% in 31 states. State-specific estimates of weekly wage penalties for teachers range from 7.6% in New Jersey to 37.4% in Colorado. In 31 states, teachers are paid less than 80 cents for each dollar earned by similar college-educated workers in those states.
Data and relevant information
The report uses two sources of data, both from the Bureau of Labor Statistics (BLS), to analyze public school teachers and other nonteaching college graduates. A prior report provides a comprehensive discussion of the data and methodologies that were used to produce our teacher weekly wage and total compensation estimates (Allegretto and Mishel 2019, Appendix A). The following is a concise summary of that discussion.
First, I use Current Population Survey Outgoing Rotation Groups (CPS-ORG) data for the wage analyses. To account for the “summers off” issue for teachers, I focus on weekly wages, which avoids comparisons of weekly hours worked or length of the work year between teachers and other college graduates.2 The sample is restricted to full-time workers (working at least 35 hours per week), 18 to 64 years old, with at least a bachelor’s degree. The education restriction is made because teachers today need at least a bachelor’s degree to teach. The sample is further limited to those who reported their wage information directly (those who didn’t respond and whose wages were estimated by BLS are excluded).3
To preserve data confidentiality, the Bureau of Labor Statistics records weekly wages only up to a defined threshold, so the wage amounts above this threshold aren’t specifically identifiable in the data. This is called top-coding. The threshold, however, has not been updated for inflation since 1998. As a result, more workers are assigned top-coded wages, which has generated a growing understatement of college graduate wages relative to those of teachers. EPI replaces original top-coded values with Pareto-distribution implied means above the CPS top-code for men and women.4
The second data source used to assess benefits is from BLS’s National Compensation Survey’s Employer Costs for Employee Compensation (ECEC) program. Specifically, I pull data on employer costs per hour worked for detailed categories of compensation for “primary, secondary, and special education schoolteachers” in the public sector and “civilian professionals”—the latter being the broadest category available that largely corresponds to college graduates. “Benefits” in my analysis refer to employer costs for health and life insurance, retirement plans, and payroll taxes (covering Social Security, unemployment insurance, and workers’ compensation).
The remaining components of compensation are “W-2 wages,” a wage measure that corresponds to the wages captured in the Current Population Survey data used above. W-2 wages are the wages reported to employees and to the Internal Revenue Service. They include “direct wages,” defined by the Bureau of Labor Statistics as “regular payments from the employer to the employee as compensation for straight-time hourly work, or for any salaried work performed” and other wage items, including “supplemental pay.” Supplemental pay includes premium pay for overtime, bonus pay, profit-sharing, and “paid leave.”
Findings
The results of this research are presented in four sections. I first show the trends in the simple (not regression-adjusted) average weekly wages for public school teachers and other college graduates from 1979 through 2022 (adjusted for inflation). Second, I report annual estimates of the national weekly wage penalty for teachers using standard regression techniques, which control for systematic differences in age, education, state of residence, and other factors known to affect wage rates—referred to throughout as “relative” differences. Third, I present relative (or regression-adjusted) estimates of the teacher wage penalty for each state and the District of Columbia. Lastly, I factor in nonwage benefits to estimate a total compensation penalty that takes into account the estimated teacher wage penalty along with the teacher benefits advantage to estimate a total compensation differential at the national level (which is not possible to calculate for each state).
Average weekly wage trends
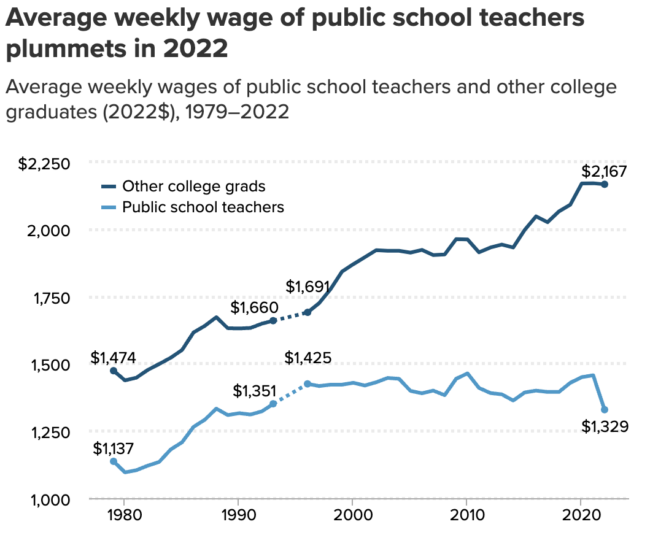
I start by showing the simple level of average weekly wages of public school teachers and other college graduates in Figure A. These data are national annual averages for the two groups adjusted only for inflation (not regression adjusted).
Average weekly wage of public school teachers plummets in 2022: Average weekly wages of public school teachers and other college graduates (2022$), 1979–2022
| Year | Public school teachers | Other college grads | Public school teachers | Other college grads | Public school teachers | Other college grads |
|---|---|---|---|---|---|---|
| 1979 | $1,137 | $1,474 | ||||
| 1980 | $1,096 | $1,438 | ||||
| 1981 | $1,104 | $1,448 | ||||
| 1982 | $1,121 | $1,477 | ||||
| 1983 | $1,135 | $1,499 | ||||
| 1984 | $1,181 | $1,522 | ||||
| 1985 | $1,208 | $1,551 | ||||
| 1986 | $1,265 | $1,616 | ||||
| 1987 | $1,292 | $1,641 | ||||
| 1988 | $1,333 | $1,673 | ||||
| 1989 | $1,309 | $1,632 | ||||
| 1990 | $1,316 | $1,631 | ||||
| 1991 | $1,311 | $1,633 | ||||
| 1992 | $1,323 | $1,649 | ||||
| 1993 | $1,351 | $1,660 | $1,351 | $1,660 | ||
| 1994 | $1,376 | $1,670 | ||||
| 1995 | $1,400 | $1,680 | ||||
| 1996 | $1,425 | $1,691 | $1,425 | $1,691 | ||
| 1997 | $1,417 | $1,725 | ||||
| 1998 | $1,422 | $1,777 | ||||
| 1999 | $1,422 | $1,842 | ||||
| 2000 | $1,429 | $1,870 | ||||
| 2001 | $1,419 | $1,896 | ||||
| 2002 | $1,431 | $1,922 | ||||
| 2003 | $1,447 | $1,920 | ||||
| 2004 | $1,444 | $1,920 | ||||
| 2005 | $1,399 | $1,913 | ||||
| 2006 | $1,390 | $1,923 | ||||
| 2007 | $1,400 | $1,904 | ||||
| 2008 | $1,383 | $1,906 | ||||
| 2009 | $1,444 | $1,963 | ||||
| 2010 | $1,464 | $1,962 | ||||
| 2011 | $1,410 | $1,914 | ||||
| 2012 | $1,391 | $1,932 | ||||
| 2013 | $1,386 | $1,943 | ||||
| 2014 | $1,363 | $1,932 | ||||
| 2015 | $1,393 | $1,997 | ||||
| 2016 | $1,400 | $2,048 | ||||
| 2017 | $1,395 | $2,026 | ||||
| 2018 | $1,395 | $2,066 | ||||
| 2019 | $1,429 | $2,091 | ||||
| 2020 | $1,450 | $2,170 | ||||
| 2021 | $1,457 | $2,171 | ||||
| 2022 | $1,329 | $2,167 |
Notes: Figure shows average weekly wages (2022$) of public school teachers (elementary, middle, and secondary) and other college graduate (nonteacher) peers. Data points for 1994 and 1995 are unavailable; dotted lines represent interpolated data. See Allegretto and Mishel 2019, Appendix A, for more details on data and methodology.
Source: Author’s analysis of Current Population Survey Outgoing Rotation Group data accessed via the EPI Current Population Survey Extracts, Version 1.0.41 (EPI 2023a), https://microdata.epi.org.
The first thing to note in Figure A is the significant drop in teachers’ weekly wages from 2021 to 2022. Keep in mind these wages are “real,” meaning that they are adjusted for inflation. In 2022 inflation was 8.1%—the highest level since 1981 and more than three times as high as inflation has been in recent years. For context, annual inflation averaged just 2.2% over the previous two decades.5 To put it another way, high inflation reduced the buying power of teachers in 2022.
A second point to note is how flat real wages for teachers have been for decades. This means that modest nominal increases in weekly wages—increases that haven’t been adjusted for inflation—were similar to increases in inflation. In effect, high inflation cancels out the benefits of modest wage increases. Although wages may rise, prices rise even more because of inflation. In order for there to be increases in standards of living, nominal increases in pay need to exceed the rate of inflation—something that teachers, on average, have not experienced for a long time.
Between 1979 and 1993, the average weekly wage of teachers was below that of other college graduates, but for the most part, the wages of teachers and other college graduates trended together6 until 1996 when they began diverging considerably. In 1996, the inflation-adjusted average weekly wage of teachers was 15.7% less than that of other college graduates. That difference grew by 23 percentage points to 38.7% in 2022.
From 2021 to 2022, real wages for teachers fell by a bit more than inflation (8.8% vs 8.1%), meaning that the lion’s share of the decline was due to inflation, not a large drop in nominal wages. Regardless, the buying power of teachers took a big hit, and significant future pay increases will be needed to recoup the large loss. This was not the case for the earnings of other college graduates as weekly wages, on average, just about kept pace with the large increase in inflation.
This dynamic is likely explained (at least in part) because teachers’ wages are often set by long-term union contracts and dependent on government budgets. In contrast, the private sector can often respond more quickly to improving or deteriorating economic conditions by adjusting wages. Other college graduates were able to garner an increase in nominal wages to keep pace with inflation, thereby keeping their buying power relatively steady in 2022. Future increases in teacher pay—that are significantly above future annual rates of inflation—are needed to recoup the large loss of buying power that occurred in 2022.
Relative differences: Regression-adjusted trends
The weekly wages discussed above are simple averages (not regression-adjusted) for teachers and other college graduates. However, the two groups may differ fundamentally in factors that typically affect pay on margins such as age, educational attainment, race/ethnicity, and state of residence. For instance, all else being equal, one would expect experienced workers to earn more than young workers just starting out in their careers. Therefore, controlling for age within a regression model will account for such differences across the two samples. Thus, standard regression techniques are used to estimate weekly wages of public school teachers relative to other similarly situated college graduates in the labor market, which can provide an apples-to-apples comparison of earnings.7 I report regression-adjusted estimates for all teachers (which includes a gender control), as well as separately for women and men.
Relative wage results are presented to show how much less (or more) teachers earn in weekly wages relative to other college graduates estimated via regression analysis. A weekly wage “penalty” for teachers is reported when the regression estimates suggest that teachers, all else being equal, are paid less than other college graduates. A penalty appears as a negative number in Figure B. When teachers are paid relatively more, the number is positive and is referenced as a “premium.”
Teachers earn 26.4% less than comparable college graduates: Public school teacher weekly wage penalty (or premium) for all teachers and by gender, 1979–2022
| Year | All | Women | Men | All | Women | Men | All | Women | Men |
|---|---|---|---|---|---|---|---|---|---|
| 1979 | -7.1% | 6.5% | -16.6% | ||||||
| 1980 | -9.30% | 4.50% | -19.20% | ||||||
| 1981 | -10.10% | 3.10% | -19.00% | ||||||
| 1982 | -10.20% | 2.80% | -19.40% | ||||||
| 1983 | -11.80% | 1.00% | -20.70% | ||||||
| 1984 | -10.00% | 2.50% | -19.70% | ||||||
| 1985 | -10.20% | 1.90% | -19.50% | ||||||
| 1986 | -8.80% | 3.20% | -18.40% | ||||||
| 1987 | -7.90% | 3.90% | -18.10% | ||||||
| 1988 | -8.00% | 5.10% | -18.20% | ||||||
| 1989 | -8.20% | 3.00% | -17.00% | ||||||
| 1990 | -7.70% | 4.00% | -17.90% | ||||||
| 1991 | -9.10% | 0.60% | -16.30% | ||||||
| 1992 | -7.00% | 3.10% | -15.60% | ||||||
| 1993 | -5.1% | 4.1% | -13.1% | -5.10% | 4.10% | -13.10% | |||
| 1994 | -5.40% | 2.70% | -13.70% | ||||||
| 1995 | -5.70% | 1.30% | -14.40% | ||||||
| 1996 | -6.1% | -0.1% | -15.1% | -6.1% | -0.1% | -15.1% | |||
| 1997 | -6.20% | 1.20% | -18.60% | ||||||
| 1998 | -9.00% | -1.50% | -20.50% | ||||||
| 1999 | -10.40% | -2.70% | -21.70% | ||||||
| 2000 | -11.80% | -5.10% | -22.70% | ||||||
| 2001 | -12.10% | -4.00% | -25.30% | ||||||
| 2002 | -12.10% | -5.10% | -24.10% | ||||||
| 2003 | -11.30% | -4.90% | -21.20% | ||||||
| 2004 | -12.80% | -6.20% | -23.30% | ||||||
| 2005 | -13.30% | -6.30% | -24.50% | ||||||
| 2006 | -15.00% | -8.00% | -27.30% | ||||||
| 2007 | -11.70% | -4.70% | -23.40% | ||||||
| 2008 | -14.50% | -7.70% | -25.70% | ||||||
| 2009 | -12.50% | -4.50% | -24.70% | ||||||
| 2010 | -11.90% | -4.60% | -23.70% | ||||||
| 2011 | -12.80% | -6.40% | -24.20% | ||||||
| 2012 | -16.00% | -10.00% | -26.20% | ||||||
| 2013 | -16.40% | -10.10% | -27.30% | ||||||
| 2014 | -16.50% | -10.50% | -26.20% | ||||||
| 2015 | -18.40% | -13.40% | -26.70% | ||||||
| 2016 | -19.40% | -12.20% | -31.60% | ||||||
| 2017 | -20.90% | -15.50% | -30.50% | ||||||
| 2018 | -22.00% | -15.90% | -31.80% | ||||||
| 2019 | -19.20% | -13.20% | -30.20% | ||||||
| 2020 | -21.60% | -15.20% | -33.80% | ||||||
| 2021 | -23.5% | -17.1% | -35.2% | ||||||
| 2022 | -26.4% | -21.3% | -36.6% |
Notes: Figure shows regression-adjusted weekly wage penalties (or premiums) for public school teachers (elementary, middle, and secondary) relative to their college-educated, nonteaching peers. Data points for 1994 and 1995 are unavailable; dotted lines represent interpolated data. See Allegretto and Mishel 2019, Appendix A, for more details on data and methodology.
Figure reports regression-adjusted teacher weekly wage penalties: how much less, in percentage terms, public school teachers (elementary, middle, and secondary) earn in weekly wages relative to their college-educated, nonteaching peers. College-educated workers refers to workers who have a bachelor’s degree or more education. The dependent variable is (log) weekly wages with indicator controls on public school teacher, private school teacher, gender, and married, along with indicator sets on education (M.A., professional degree, Ph.D.) and race/ethnicity (Black, Hispanic, other); also included are age as a quartic and state fixed effects. See Allegretto and Mishel 2019, Appendix A, for more details on data and methodology.
Source: Author’s analysis of Current Population Survey Outgoing Rotation Group data accessed via the EPI Current Population Survey Extracts, Version 1.0.41 (EPI 2023a), https://microdata.epi.org.
In 2022, I estimated the largest weekly wage teacher penalties ever recorded in this series. For all teachers, the penalty worsened to 26.4%. Otherwise, on average, teachers earned 73.6 cents on the dollar in 2022 nationally compared with what similar college graduates earned working in other professions. This is much less than the relative 93.9 cents on the dollar that teachers earned in 1996. As depicted in Figure B, the occasional easing of the penalties over time never lasts as strong downward trends persist for all teachers and separately by gender.
The trending wage penalty for female teachers (compared with other female professionals) crossed over the 20% threshold for the first time in 2022 to 21.3%, a quickening decline from parity in 1996. Over a longer sweep of history, previous research (using Census data) indicates that the wage estimates for female teachers moved from significant premiums to large penalties. For example, in previous work, I documented that relative female teacher earnings saw a 14.7% premium in 1960, which dipped to 10.4% in 1970 to near parity in 1980 (pre-1979 years not shown in Figure B).8 Starting in 1996, there has been a continued erosion of teachers’ relative wages (shown in Figure B). By 2022, the cumulative change has been a 36.0 percentage-point deterioration in the relative wage of female teachers since 1960.9
The context for this trend of declining relative wages for teachers is a positive one for women—labor market opportunities have greatly improved over the last six decades, as have educational opportunities. The teaching profession once had a somewhat captive labor pool of women to depend on. Thankfully that is no longer the case, but increased opportunity costs do matter. As wider opportunities for women in the labor force push up wages for female college graduates, simply maintaining the same quality of the labor market pool for teachers will require steady raises in real teachers’ pay now that the teaching profession must compete with other fields for qualified women. Otherwise, educational quality will be compromised.
Over the last six decades, estimates of relative teacher wages for men have always been larger than the teaching penalty for women. Historically, the penalty for men has worsened from 20.5% in 1960 (not shown in Figure B) to 36.6% in 2022 (Allegretto, Corcoran, and Mishel 2008). The enormous teaching penalty for men that persists today goes a long way in explaining why men who may want to choose teaching as a career may not be able to afford to do so. The large and worsening teacher pay penalty for men is one of the reasons why approximately three in four teachers are women, which is largely unchanged since 1960.
Teacher weekly wage penalties by state
Thus far I have reported that the national weekly wage penalty for teachers was 26.4% in 2022. But there is much variation across states. To produce regression estimates by state, I pool six years of Current Population Survey data, 2017 through 2022, to ensure adequate sample sizes for each state. Again, I compare public school teachers with nonteacher college graduates within each state and estimate weekly wage gaps for each state and the District of Columbia.
The teacher weekly wage penalty exceeds 20% in 31 states: Teacher weekly wage penalty, by state
| State | Teacher weekly pay penalty |
|---|---|
| Colorado | -37.4% |
| Arizona | -33.2% |
| Virginia | -32.1% |
| Oklahoma | -31.8% |
| Alabama | -30.9% |
| Missouri | -30.2% |
| New Hampshire | -28.6% |
| Oregon | -28.5% |
| Georgia | -28.3% |
| Utah | -28.1% |
| Louisiana | -27.9% |
| Washington | -27.8% |
| Minnesota | -27.7% |
| New Mexico | -26.8% |
| North Carolina | -26.1% |
| Idaho | -26.1% |
| Maryland | -25.8% |
| Tennessee | -25.3% |
| Kansas | -24.0% |
| Illinois | -23.9% |
| Arkansas | -23.8% |
| Kentucky | -23.6% |
| Texas | -23.4% |
| Maine | -23.2% |
| Wisconsin | -22.9% |
| Nebraska | -21.6% |
| Indiana | -21.6% |
| Michigan | -20.7% |
| Massachusetts | -20.6% |
| Florida | -20.4% |
| West Virginia | -20.2% |
| North Dakota | -19.7% |
| Nevada | -19.5% |
| District of Columbia | -19.5% |
| California | -19.2% |
| Connecticut | -18.1% |
| Montana | -17.8% |
| South Dakota | -17.3% |
| Iowa | -17.0% |
| Alaska | -16.8% |
| Pennsylvania | -15.8% |
| Ohio | -14.4% |
| Mississippi | -14.3% |
| New York | -14.3% |
| Hawaii | -14.0% |
| Vermont | -13.2% |
| Delaware | -11.9% |
| Rhode Island | -9.1% |
| South Carolina | -8.9% |
| Wyoming | -8.6% |
| New Jersey | -7.6% |
Notes: Figure shows state-specific regression-adjusted weekly wage penalties for public school teachers (elementary, middle, and secondary) relative to their college-educated, nonteaching peers. See Allegretto and Mishel 2019, Appendix A, for more details on data and methodology.
Figure reports state-specific regression-adjusted teacher weekly wage penalties: how much less, in percentage terms, public school teachers (elementary, middle, and secondary) earn in weekly wages relative to their college-educated, nonteaching peers. College-educated workers refers to workers who have a bachelor’s degree or more education. The dependent variable is (log) weekly wages with indicator controls on public school teacher, public school teacher interacted with each state (relevant estimate), private school teacher, gender, and married, along with indicator sets on education (M.A., professional degree, Ph.D.) and race/ethnicity (Black, Hispanic, other); also included are age as a quartic, state fixed effects. See Allegretto and Mishel 2019, Appendix A, for more details on data and methodology.
Source: Author’s analysis of pooled 2017–2022 Current Population Survey Outgoing Rotation Group data accessed via the EPI Current Population Survey Extracts, Version Version 1.0.41 (EPI 2023a), https://microdata.epi.org.
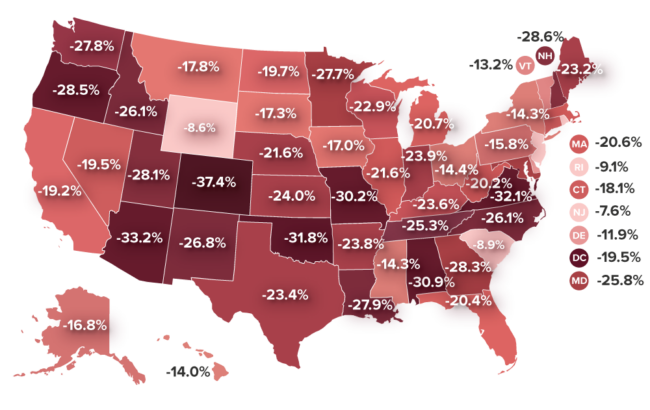
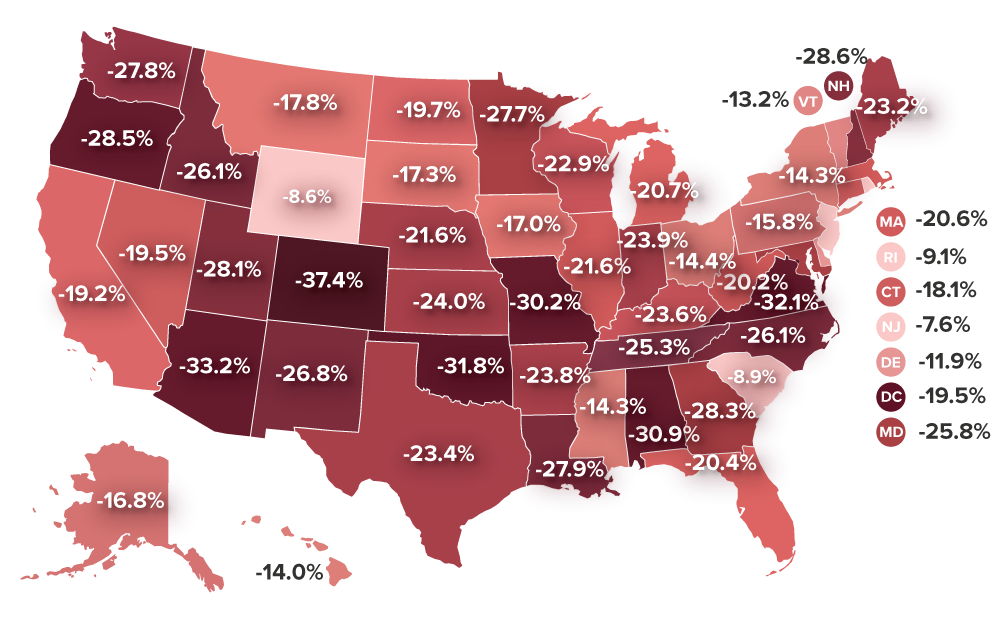
As in previous reports, Figure C shows that in no state does the relative (regression adjusted) weekly wage of teachers equal or surpass that of their nonteaching college graduate counterparts. The bars are sorted from the largest (37.4%) to the smallest (7.6%) state penalties.
There are six states where teachers, on average, earn less than 70 cents on the dollar compared with similar college graduates in their respective states. The largest state penalties are in Colorado (37.4), Arizona (33.2%), Virginia (32.1%), Oklahoma (31.8%), Alabama (30.9), and Missouri (30.2%). Not surprisingly, the first four states listed had walkouts in response to low pay and other issues around public education funding in 2018–2019.10
Figure D is a map presentation of the state penalties reported in Figure C.
How underpaid are teachers in your state?: Depending on the state, teachers make between 7.6% and 37.4% less than other comparable college-educated workers
Notes: Figure shows state-specific regression-adjusted weekly wage penalties for public school teachers (elementary, middle, and secondary) relative to their college-educated, nonteaching peers. See Allegretto and Mishel 2019, Appendix A, for more details on data and methodology.
Figure reports state-specific regression-adjusted teacher weekly wage penalties: how much less, in percentage terms, public school teachers (elementary, middle, and secondary) earn in weekly wages relative to their college-educated, nonteaching peers. College-educated workers refers to workers who have a bachelor’s degree or more education. The dependent variable is (log) weekly wages with indicator controls on public school teacher, public school teacher interacted with each state (relevant estimate), private school teacher, gender, and married, along with indicator sets on education (M.A., professional degree, Ph.D.) and race/ethnicity (Black, Hispanic, other); also included are age as a quartic, state fixed effects. See Allegretto and Mishel 2019, Appendix A, for more details on data and methodology.
Source: Author’s analysis of pooled 2017–2022 Current Population Survey Outgoing Rotation Group data accessed via the EPI Current Population Survey Extracts, Version 1.0.41 (EPI 2023a), https://microdata.epi.org.
Adding benefits to the picture
The weekly wages analyzed to this point make up an important and significant part of compensation, but to get an accounting of the total compensation of teachers and non-teacher professionals, I add in other benefits of employment such as health and other insurance, and retirement plans. Teachers generally receive a higher share of their total compensation as benefits than other professionals do, partially offsetting the weekly wage penalty. In this section I examine the teacher benefits advantage and how it impacts total compensation.
The Bureau of Labor Statistics Employer Costs for Employee Compensation (ECEC) series measures the average employer cost per employee hour worked for total compensation, wages and salaries, and benefits, and costs as a percent of total compensation. I compare benefits packages of primary, secondary, and special education public school teachers with those of comparable workers (specifically, workers in professional occupations).11 The summary of my calculations is presented in Table 1.
The teacher compensation penalty grew to 17.0% in 2022: Trends in the teacher total compensation penalty, selected years, 1979–2022
| W-2 wage share of compensation | Public school teachers | ||||
|---|---|---|---|---|---|
| Year | Professionals | Public school teachers | Wage penalty | Benefits advantage | Compensation penalty |
| 1979 | n.a. | n.a. | -7.3% | n.a. | n.a. |
| 1993 | n.a. | n.a. | -5.1% | 2.4% | -2.7% |
| 2004 | 81.3% | 79.3% | -12.8% | 2.2% | -10.7% |
| 2007 | 80.7% | 77.2% | -11.7% | 4.0% | -7.7% |
| 2010 | 79.8% | 75.6% | -11.9% | 4.9% | -7.1% |
| 2017 | 78.1% | 71.4% | -20.9% | 7.4% | -13.5% |
| 2018 | 78.5% | 70.9% | -22.0% | 8.3% | -13.7% |
| 2019 | 78.6% | 70.7% | -19.2% | 9.0% | -10.2% |
| 2020 | 78.4% | 70.5% | -21.6% | 8.8% | -12.8% |
| 2021 | 78.5% | 70.1% | -23.5% | 9.3% | -14.2% |
| 2022 | 78.7% | 69.8% | -26.4% | 9.4% | -17.0% |
| Percentage-point change | |||||
| 1993-2007 | n.a. | n.a. | -6.6 | 1.6 | -5.0 |
| 1994-2007 | -0.6 | -2.1 | n.a. | n.a. | n.a. |
| 2004-2019 | -2.7 | -8.6 | -6.4 | 6.8 | 0.4 |
| 2019-2022 | 0.2 | -0.9 | -7.2 | 0.4 | -6.8 |
| 2021-2022 | 0.2 | -0.2 | -2.9 | 0.1 | -2.8 |
| 2004-2022 | -2.6 | -9.5 | -13.6 | 7.2 | -6.4 |
Notes: The benefits advantage is the degree to which higher benefits offset the wage penalty. See the “Computing the Benefits Advantage” section in Appendix A of Allegretto and Mishel 2019 for data and methodology details. “n.a.” indicates that data are not available. Explanations of missing data and other data issues are documented in the “Historical Data Issues” section of the 2019 appendix.
Source: Author’s analysis of Current Population Survey Outgoing Rotation Group data and Bureau of Labor Statistics Employer Costs for Employee Compensation data.
The first pair of columns in Table 1 under “W-2 wage share of compensation” presents the share of W-2 wages that make up total compensation for professionals in all occupations and for K–12 public school teachers. The W-2 wage share of compensation and the benefits share of compensation sum to 100. These W-2 shares permit an examination of how important wages are relative to benefits in the total compensation package.
In 2022, W-2 wages made up 69.8% of teachers’ total compensation. For professionals, the share was 78.7%. That means that for every dollar of teachers’ total compensation, 69.8 cents went to wages and 30.2 cents went to benefits, while for professionals, 78.7 cents went to wages and 21.3 cents went to benefits. Therefore, for every dollar of total compensation, public school teachers receive more in benefits than other professionals do. I refer to this as the “benefits advantage.”12
The columns under “public school teachers” in Table 1 provide the information needed to assess total compensation. The “wage penalty” column reports the teacher wage penalty estimates from Figure B, followed by the “benefits advantage” calculation per teachers. Combining the two provides a measure of how teachers compare with other professionals on total compensation, which is reported in the last column. Per usual, the benefits advantage for teachers partially offsets their estimated relative wage disadvantage but still leaves teachers with a significant total compensation penalty of 17.0% in 2022—the largest to date.
The benefits advantage that favors teachers has been growing in the 21st century from 2.2% in 2004 to 9.4% in 2022. This increase was not nearly enough to offset the growing teacher wage penalty that worsened from 12.8% to 26.4% over the same timeframe. The large teacher wage penalty, in combination with the larger share that earnings make up of total compensation, suggests that it is likely that the total compensation penalty for teachers will not improve without significant changes to teachers’ wages.
Final thoughts
This report updates my long-running series on teacher pay through 2022. I have found once again that relative teacher weekly wages have continued their long eroding trend. These trends in teacher wages and total compensation have had profound consequences for the profession. Certainly, the alarms have been sounding from teacher staffing challenges (Fortin and Fawcett 2023; LPI 2023; García and Weiss 2020) to college students forgoing teaching careers because of low pay (Croft, Guffy, and Vitale 2018) to a majority of parents steering their children into better paying professions (PDK 2018). These staffing shortages have led to fast tracking credentials (Povich 2023), using unqualified teachers, and states allowing almost anyone to substitute teach (Franco and Kemper Patrick 2023).
One of our nation’s highest ideals is the promise to educate every child without regard to means. In many respects, we have always fallen short on that promise. And there are many issues to be addressed around public education and its funding (Allegretto, García, and Weiss 2022). But one thing is for sure. A world-class public educational system cannot be accomplished without the best and the brightest heading our classrooms. And it cannot be done on the cheap.
About the author
Sylvia A. Allegretto is a senior economist at the Center for Economic and Policy Research and a research associate at the Economic Policy Institute (EPI). She worked for 15 years at the Institute for Research on Labor and Employment at the University of California, Berkeley, where she co-founded the Center on Wage and Employment Dynamics (CWED). CWED’s body of work on wage floors has been highly influential in academia and policy circles. Allegretto co-authored two editions of The State of Working America while at EPI and continues her work on teacher compensation, public education, and labor markets. Dr. Allegretto provides frequent commentary on economic trends. She has a Ph.D. in economics from the University of Colorado, Boulder.
Notes
1. See How Does Teacher Pay Compare (Allegretto, Corcoran, and Mishel 2004); The Teacher Penalty (Allegretto, Corcoran, and Mishel 2008); and the following issue briefs and reports in the series: Allegretto, Corcoran, and Mishel 2011; Allegretto and Tojerow 2014; Allegretto and Mishel 2016, 2018, 2019; and Allegretto 2022.
2. In Allegretto and Mishel 2019, we provide evidence that teachers work weekly hours similar to those of other professionals.
3. Our earlier work documents that BLS’s imputation method overstates teacher earnings, which is not the case for the other college graduate sample (Allegretto, Corcoran, and Mishel 2008, 9).
4. For more about top-code adjustments, see EPI 2023b.
5. BLS Consumer Price Index data here: R-CPI-U-RS Homepage: U.S. Bureau of Labor Statistics (bls.gov)
6. The Current Population Survey was redesigned in 1994 making improvements that benefited this type of comparison, such as the categories of education. Also, CPS allocation flags used to define our sample are missing for 1994 and 1995. Dotted lines simply connect 1993 to 1996 data.
7. The wage model includes controls for both public and private school teachers. The weekly wage penalty estimates are based on the coefficient on the public school teacher indicator. Regression for all teachers includes a gender control. See Allegretto and Mishel 2019, Appendix A, for specification details.
8. See Allegretto, Corcoran, and Mishel 2008.
9. See Allegretto, Corcoran, and Mishel 2008 for 1960, 1970, and 1980 estimates using decennial censuses.
10. Keep in mind that state estimates reported in this paper use pooled 2017-2022 CPS data, while the state results reported in the previous paper (Allegretto 2022) used pooled 2016-2021 CPS data. Thus, there is data overlap. Even so, penalties increased in 39 states in this update.
11. The ECEC provides compensation data for a narrower category of “primary, secondary, and special education school teachers” and for a broader category of “teachers.” We analyze the narrower category, which closely matches the definition of teachers in our CPS-ORG data, using data limited to state and local public-sector workers. The inclusion of kindergarten and special education teachers in the benefits analysis does not produce any more substantial differences than if they were excluded (as they are in the CPS sample used to estimate the wage penalty). Greater methodological detail is provided in Appendix A of Allegretto and Mishel 2019.
12. Our analysis accounts for differences in annual weeks worked, as it is based on the usual weekly wages of teachers and other college graduates, not hourly wages or annual earnings. One reason health and pension costs are higher for teachers is that teacher health benefits are provided for a full year while teacher salaries are for less than a full year.
References
Allegretto, Sylvia A. 2022. “The Teacher Pay Penalty Has Hit a New High.” Washington, DC: Economic Policy Institute, August 2022.
Allegretto, Sylvia A., Sean P. Corcoran, and Lawrence Mishel. 2004. How Does Teacher Pay Compare? Methodological Challenges and Answers. Washington, D.C.: Economic Policy Institute.
Allegretto, Sylvia A., Sean P. Corcoran, and Lawrence Mishel. 2008. The Teaching Penalty: Teacher Pay Losing Ground. Washington, D.C.: Economic Policy Institute.
Allegretto, Sylvia A., Sean P. Corcoran, and Lawrence Mishel. 2011. The Teaching Penalty: An Update Through 2010. Economic Policy Institute Issue Brief no. 298, March 2011.
Allegretto, Sylvia A., Emma García, and Elaine Weiss. 2022. Public Education Funding in the U.S. Needs an Overhaul: How a Larger Federal Role Would Boost Equity and Shield Children from Disinvestment During Downturns. Economic Policy Institute, July 2022.
Allegretto, Sylvia A., and Lawrence Mishel. 2016. The Teacher Pay Gap Is Wider Than Ever: Teachers’ Pay Continues to Fall Further Behind Pay of Comparable Workers. Economic Policy Institute, August 2016.
Allegretto, Sylvia A., and Lawrence Mishel. 2018. The Teacher Pay Penalty Has Hit a New High: Trends in the Teacher Wage and Compensation Gaps Through 2017. Economic Policy Institute, September 2018.
Allegretto, Sylvia A., and Lawrence Mishel. 2019. The Teacher Weekly Wage Penalty Hit 21.4 Percent in 2018, a Record High. Economic Policy Institute, April 2019.
Allegretto, Sylvia A., and Ilan Tojerow. 2014. “Teacher Staffing and Pay Differences: Public and Private Schools.” Monthly Labor Review (U.S. Department of Labor, Bureau of Labor Statistics), September 2014.
Bureau of Labor Statistics (BLS). 2023a. “Employer Costs for Employee Compensation Summary” (news release). June 16, 2023.
Bureau of Labor Statistics (BLS). 2023b. Employer Costs for Employee Compensation Historical Listing: National Compensation Survey, data tables accessed August 1, 2023.
Croft, Michelle, Gretchen Guffy, and Dan Vitale. 2018. Encouraging More High School Students to Consider Teaching. ACT Policy Research, June 2018.
Economic Policy Institute (EPI). 2023a. Current Population Survey Extracts, Version 1.0.41, https://microdata.epi.org. Accessed July 2023.
Economic Policy Institute (EPI). 2023b. “Methodology: Wage Variables.” EPI Microdata Extracts documentation.
Fortin, Jacey, and Eliza Fawcett. 2023. “How Bad Is the Teacher Shortage? Depends Where You Live.” New York Times, August 29, 2022.
Franco, Marguerite, and Susan Kemper Patrick. 2023. State Teacher Shortages: Teaching Positions Left Vacant or Filled by Teachers Without Full Certification. Learning Policy Institute, July 27, 2023.
García, Emma, and Elaine Weiss. 2020. Examining the Factors That Play a Role in the Teacher Shortage Crisis: Key Findings from EPI’s “Perfect Storm in the Teacher Labor Market” Series. Economic Policy Institute, October 2020.
Learning Policy Institute (LPI). 2023. Blog Series on Educator Quality: Recruitment & Retention. LPI Blog. Accessed July 2023.
Phi Delta Kappan (PDK). 2018. Teaching: Respect but Dwindling Appeal. The 50th Annual PDK Poll of the Public’s Attitudes Toward the Public Schools. Supplement to Kappan magazine, September 2018.
Povich, Elaine S. 2023. “Plagued by Teacher Shortages, Some States Turn to Fast-Track Credentialing.” Stateline, July 24, 2023.