
Jump to
CEO-to-worker pay ratio CEO pay growth over time CEO pay and the stock market CEO pay-to-top 0.1% Excessive, no matter how you measure it Policy solutions Discussion of our methods References Our latest analysis Past reportsCEO-to-worker pay has skyrocketed over the last six decades
In 2024, CEOs were paid 281 times as much as a typical worker—in contrast to 1965, when they were paid 21 times as much as a typical worker.

CEOs of major U.S. companies were paid 21 times as much as the typical worker in 1965, using the realized measure of CEO compensation, which captures what CEOs took home in pay after any stock-based compensation were sold. This ratio grew to 31-to-1 in 1978 and 60-to-1 by 1989. It surged in the 1990s, hitting 380-to-1 in 2000, at the end of the 1990s recovery and at the height of the stock market bubble.
The fall in the stock market after 2000 reduced CEO stock-related pay, such as realized stock options, and caused CEO compensation to tumble in 2002 before beginning to rise again in 2003. Realized CEO compensation recovered to a level of 329 times worker pay by 2007, still below its 2000 level. The financial crisis of 2008 and accompanying stock market decline reduced CEO compensation between 2007 and 2009, and the CEO-to-worker compensation ratio fell in tandem.
Over the 2009–2021 period, another surge in realized CEO compensation brought the ratio to 408-to-1, a historic high. The ratio experienced significant declines between 2021 and 2023, as CEO pay fell. In 2024, the CEO-to-worker compensation ratio was 281-to-1. Even with these recent declines, the 2024 ratio remains far higher than it was in the 1960s, 1970s, 1980s, and the early 1990s.
The extraordinarily high level of the CEO-to-worker compensation ratio over the long term reflects the strikingly different trajectory of CEO pay compared with typical worker pay over the last nearly five decades. On the one hand, compensation of a typical worker has grown slowly since the late 1970s: just 26% over the 46 years from 1978 to 2024, despite a corresponding growth of net economywide productivity of 80.5% (EPI 2025). By contrast, realized CEO compensation grew a staggering 1,094% from 1978 to 2024 (excluding 1979, since there are no data for that year), obviously far exceeding the growth in productivity (or really any other economic metric) over that period.
CEOs paid 281 times as much as typical workers: CEO-to-worker compensation ratio, 1965–2024
| year | Realized CEO compensation | Granted CEO compensation |
|---|---|---|
| 1965 | 20.62 | 15.30 |
| 1966 | 21.85 | 16.21 |
| 1967 | 23.08 | 17.12 |
| 1968 | 24.31 | 18.03 |
| 1969 | 24.04 | 17.83 |
| 1970 | 23.76 | 17.63 |
| 1971 | 23.49 | 17.43 |
| 1972 | 23.22 | 17.23 |
| 1973 | 22.95 | 17.02 |
| 1974 | 24.51 | 18.18 |
| 1975 | 26.07 | 19.34 |
| 1976 | 27.63 | 20.49 |
| 1977 | 29.18 | 21.65 |
| 1978 | 30.74 | 22.80 |
| 1979 | 33.41 | 24.78 |
| 1980 | 36.08 | 26.76 |
| 1981 | 38.75 | 28.75 |
| 1982 | 41.42 | 30.73 |
| 1983 | 44.09 | 32.71 |
| 1984 | 46.76 | 34.69 |
| 1985 | 49.43 | 36.67 |
| 1986 | 52.10 | 38.65 |
| 1987 | 54.77 | 40.63 |
| 1988 | 57.44 | 42.61 |
| 1989 | 60.11 | 44.59 |
| 1990 | 75.64 | 56.11 |
| 1991 | 91.16 | 67.62 |
| 1992 | 106.69 | 79.14 |
| 1993 | 108.24 | 99.20 |
| 1994 | 87.58 | 117.85 |
| 1995 | 117.07 | 130.09 |
| 1996 | 150.00 | 176.33 |
| 1997 | 223.10 | 234.83 |
| 1998 | 304.24 | 301.50 |
| 1999 | 275.26 | 288.46 |
| 2000 | 379.63 | 393.08 |
| 2001 | 214.27 | 325.71 |
| 2002 | 186.16 | 234.92 |
| 2003 | 228.47 | 226.40 |
| 2004 | 261.83 | 231.92 |
| 2005 | 319.52 | 244.33 |
| 2006 | 322.41 | 237.31 |
| 2007 | 328.49 | 242.43 |
| 2008 | 200.03 | 218.26 |
| 2009 | 166.39 | 181.24 |
| 2010 | 209.95 | 204.10 |
| 2011 | 238.91 | 212.40 |
| 2012 | 363.43 | 205.70 |
| 2013 | 318.54 | 211.34 |
| 2014 | 320.26 | 221.00 |
| 2015 | 320.30 | 215.88 |
| 2016 | 269.28 | 219.43 |
| 2017 | 294.38 | 233.51 |
| 2018 | 284.37 | 228.79 |
| 2019 | 311.48 | 229.36 |
| 2020 | 356.22 | 212.73 |
| 2021 | 408.47 | 272.98 |
| 2022 | 361.29 | 226.00 |
| 2023 | 276.47 | 196.98 |
| 2024 | 280.72 | 212.57 |

Notes: Average annual compensation for CEOs at the top 350 U.S. firms ranked by sales is measured in two ways. Both include salary, bonus, and long-term incentive payouts, but the “granted” measure includes the value of stock options and stock awards when they were granted, whereas the “realized” measure captures the value of stock-related components that accrues after options or stock awards are granted by including “stock options exercised” and “vested stock awards.” Projected value for 2024 is based on the percent change in CEO pay in the samples available in June 2023 and in August 2024 applied to the full-year 2023 value. “Typical worker” compensation is the average annual compensation (wages and benefits of a full-time, full-year worker) of production/nonsupervisory workers in the industries that the top 350 firms operate in.
Source: Authors’ analysis of data from Compustat’s ExecuComp database, the Bureau of Labor Statistics’ Current Employment Statistics data series, and the Bureau of Economic Analysis NIPA tables.
CEO pay has grown 1,094% since 1978
From 1978–2024, top CEO compensation shot up 1,094%, compared with a 26% increase in a typical worker’s compensation.

CEO pay has grown 1,094% since 1978: Cumulative real growth in CEO pay, 1978-2024
| year | Cumulative realized CEO compensation growth | Cumulative granted CEO compensation growth |
|---|---|---|
| 1978 | 0.0% | 0.0% |
| 1979 | ||
| 1980 | ||
| 1981 | ||
| 1982 | ||
| 1983 | ||
| 1984 | ||
| 1985 | ||
| 1986 | ||
| 1987 | ||
| 1988 | ||
| 1989 | 86.6% | 86.6% |
| 1990 | ||
| 1991 | ||
| 1992 | 230.8% | 230.8% |
| 1993 | 247.5% | 311.9% |
| 1994 | 182.9% | 397.6% |
| 1995 | 262.1% | 428.3% |
| 1996 | 372.9% | 633.0% |
| 1997 | 618.9% | 875.2% |
| 1998 | 961.7% | 1226.1% |
| 1999 | 851.2% | 1201.7% |
| 2000 | 1218.8% | 1631.9% |
| 2001 | 634.2% | 1357.6% |
| 2002 | 537.6% | 988.8% |
| 2003 | 721.3% | 965.8% |
| 2004 | 826.5% | 992.6% |
| 2005 | 1025.1% | 1042.5% |
| 2006 | 1051.1% | 1023.3% |
| 2007 | 1088.1% | 1075.9% |
| 2008 | 676.6% | 960.6% |
| 2009 | 521.3% | 795.9% |
| 2010 | 685.0% | 916.8% |
| 2011 | 759.8% | 936.5% |
| 2012 | 1181.4% | 888.2% |
| 2013 | 1016.0% | 939.5% |
| 2014 | 1067.0% | 967.3% |
| 2015 | 1097.5% | 974.1% |
| 2016 | 949.0% | 1011.1% |
| 2017 | 1068.3% | 1113.6% |
| 2018 | 1051.4% | 1097.7% |
| 2019 | 1191.1% | 1127.6% |
| 2020 | 1424.2% | 1046.7% |
| 2021 | 1590.6% | 1394.1% |
| 2022 | 1370.1% | 1097.4% |
| 2023 | 1027.4% | 961.1% |
| 2024 | 1093.6% | 1057.4% |
Notes: Average annual compensation for CEOs at the top 350 U.S. firms ranked by sales is measured in two ways. Both include salary, bonus, and long-term incentive payouts, but the “granted” measure includes the value of stock options and stock awards when they were granted, whereas the “realized” measure captures the value of stock-related components that accrues after options or stock awards are granted by including “stock options exercised” and “vested stock awards.” Projected value for 2024 is based on the percent change in CEO pay in the samples available in June 2023 and in June 2024 applied to the full-year 2023 value.
Source: Authors’ analysis of data from Compustat’s ExecuComp database.
Table 1 presents the long-term trends in CEO compensation for selected years from 1965 to 2024 (view all data years available). Our discussion of longer-term trends focuses mostly on the realized compensation measure of CEO compensation—the measure that has been tracked more consistently in data series before the 1990s.
The table presents the trends in inflation-adjusted realized and granted CEO compensation for selected years from 1965 to 2024 (columns 1 and 2). A shorthand way to think about the realized versus granted measure of CEO pay is when the stocks are valued. In the granted measure, the value of stock-based compensation is determined when it was given but the realized measure is how much the CEO received when options were exercised, or how much they took home. Real changes in the stock market are as measured by the S&P 500 Index and the Dow Jones Industrial Average in columns 3 and 4. The table displays the average annual compensation (wages and benefits of a full-time, full-year worker) of private-sector production/nonsupervisory workers in column 5. From 1992 onward, column 6 of the table also identifies the average annual compensation of production/nonsupervisory workers in the key industries of the firms included in the sample. Columns 7 and 8 present trends in the ratio of CEO-to-worker compensation, using both measures of CEO compensation. Column 9 displays average top 0.1% annual earnings and column 10 shows the CEO-to-top 0.1% pay ratios (see Gould and Kandra 2024).
CEO compensation, CEO-to-worker compensation ratio, and stock prices (2024$), selected years, 1965–2024
| CEO annual compensation (thousands) | Stock market (indexed to 2023$) | Private-sector production/nonsupervisory workers annual compensation (thousands) |
CEO-to-worker compensation ratio | CEO-to-Top 1% | ||||||
|---|---|---|---|---|---|---|---|---|---|---|
| Year(s) | Realized | Granted | S&P 500 | Dow Jones | All private-sector workers | Workers in the firms’ industries* | Realized | Granted | Top 0.1% wages | Ratio of CEO pay to top 0.1% wages |
| 1965 | $1,078 | $820 | 718 | 7,422 | $49 | 20.6 | 15.3 | $471,016 | 2.3 | |
| 1978 | $1,925 | $1,466 | 397 | 3,393 | $59 | 30.7 | 22.8 | $630,193 | 3.1 | |
| 2000 | $25,392 | $25,388 | 2,440 | 18,336 | $59 | $69 | 379.6 | 393.1 | $2,840,758 | 8.9 |
| 2023 | $21,707 | $15,554 | 4,395 | 35,005 | $73 | $82 | 276.5 | 197.0 | $2,877,708 | 7.5 |
| 2024 | $22,983 | $16,967 | 5,428 | 40,323 | $74 | $84 | 280.7 | 212.6 | ||
| Percent change | Change in ratio | |||||||||
| 1965-1978 | 79% | 79% | -45% | -54% | 20% | NA | 10.2 | 7.6 | 34% | 0.8 |
| 1978–2024 | 1,094% | 1,057% | 1,267% | 1,088% | 26% | NA | 250.0 | 189.8 | ||
| 2023–2024 | 5.9% | 9.1% | 23.5% | 15.2% | 1.5% | 3.0% | 4.2 | 15.6 | ||
*Average annual compensation of the workers in the key industry of the firms in the sample.
** We round numbers to the nearest thousand in Table 1, but dollar and percent changes are calculated using unrounded data.
Notes: Average annual compensation for CEOs at the top 350 U.S. firms ranked by sales is measured in two ways. Both include salary, bonus, and long-term incentive payouts, but the “granted” measure includes the value of stock options and stock awards when they were granted, whereas the “realized” measure captures the value of stock-related components that accrues after options or stock awards are granted by including “stock options exercised” and “vested stock awards.” CEO compensation for 2024 is projected from data reported through August 2024. CEO-to-worker compensation ratios are based on averaging specific firm ratios in samples and not the ratio of averages of CEO and worker compensation. Ratios prior to 1992 are constructed as described in the CEO pay series methodology (Sabadish and Mishel 2013).
Source: Authors’ analysis of data from Compustat’s ExecuComp database, the Federal Reserve Economic Data (FRED) database from the Federal Reserve Bank of St. Louis, the Bureau of Labor Statistics’ Current Employment Statistics data series, and the Bureau of Economic Analysis NIPA tables.
CEO pay is strongly related to the stock market, though less on stock options
The stratospheric rise of CEO pay since the early 1990s stems directly from it becoming much more tightly tied to the stock market since then.
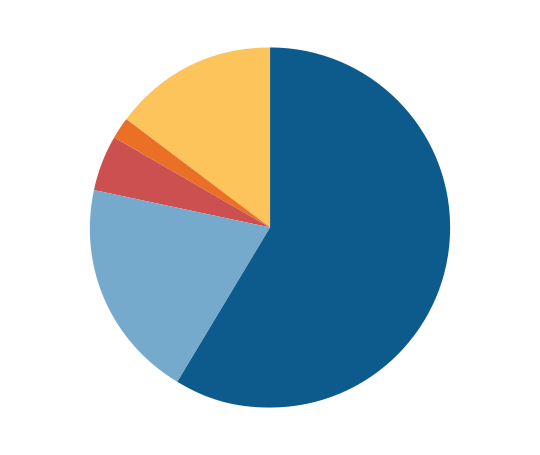
Stock-related components of CEO compensation constitute a large and increasing share of total compensation. Realized stock awards and stock options made up 67.8% of total CEO compensation in 2006 ($15.57 million out of $22.16 million; not shown) and 79.1% of total compensation in 2024 (18.19 million out of 22.98 million). The growth of these stock-related components from 2006 to 2024 explains over 100% of the total growth in CEO realized compensation over this period.
Stock-related components of CEO compensation constitute a large share of total compensation, 2024: CEO compensation, by components, 2024 (millions)
| Type | 2024 |
|---|---|
| Awards, vested | $12.52 |
| Options, value realized | $5.66 |
| Salary | $1.34 |
| Bonus | $0.37 |
| Nonequity incentive | $3.09 |
Notes: Average annual compensation for CEOs at the top 350 U.S. firms ranked by sales is measured in two ways. Both include salary, bonus, and long-term incentive payouts, but the “granted” measure includes the value of stock options and stock awards when they were granted, whereas the “realized” measure captures the value of stock-related components that accrues after options or stock awards are granted by including “stock options exercised” and “vested stock awards.” Projected value for 2024 is based on the percent change in CEO pay in the samples available in June 2023 and in August 2024 applied to the full-year 2023 value.
Source: Authors’ analysis of data from Compustat’s ExecuComp database.
Shift away from stock options to stock awards
Of the stock-related components of compensation, stock awards make up a growing share, while the share of stock options in CEO compensation packages has decreased over time.
There is a simple logic behind companies’ decisions to shift from stock options to stock awards in CEO compensation packages, as Clifford (2017) explains. With stock options, CEOs can only make gains: They realize a gain if their company’s stock price rises beyond the price of the initial options granted and they lose nothing if the stock price falls. Having nothing to lose—but potentially a lot to gain—might lead options-holding CEOs to take excessive risks to bump up their company’s stock price to an unsustainable short-term high as they are ready to exercise their options.
Stock awards, on the other hand, likely promote better long-term alignment of a CEO’s goals with those of shareholders. A stock award has a value when granted or vested and can increase or decrease in value as the firm’s stock price changes. If stock awards have a lengthy vesting period of three to five years, then the CEO has an interest in lifting the firm’s stock price over that period while being mindful to avoid any implosion in the stock price—to maintain the value of what they have. In some sense, the shift from options to awards might represent a small glimmer of hope that CEO labor markets are getting a little less dysfunctional (though there is obviously a long way to go).
Notable shift from stock options to stock awards: Share of stock-based compensation in stock options, 1992-2024
| year | Options, realized | Options, granted |
|---|---|---|
| 1992 | 84.6% | 71.9% |
| 1993 | 84.9% | 81.0% |
| 1994 | 64.2% | 83.2% |
| 1995 | 77.9% | 82.7% |
| 1996 | 82.3% | 87.0% |
| 1997 | 86.0% | 86.7% |
| 1998 | 68.1% | 65.9% |
| 1999 | 85.4% | 86.3% |
| 2000 | 87.3% | 87.3% |
| 2001 | 76.9% | 87.3% |
| 2002 | 67.6% | 78.7% |
| 2003 | 64.6% | 63.9% |
| 2004 | 69.1% | 63.2% |
| 2005 | 75.5% | 62.7% |
| 2006 | 72.1% | 50.4% |
| 2007 | 70.7% | 47.4% |
| 2008 | 59.2% | 43.5% |
| 2009 | 47.1% | 39.8% |
| 2010 | 50.5% | 37.6% |
| 2011 | 45.0% | 38.7% |
| 2012 | 38.6% | 30.9% |
| 2013 | 46.8% | 28.3% |
| 2014 | 44.9% | 24.1% |
| 2015 | 41.3% | 22.9% |
| 2016 | 40.4% | 24.5% |
| 2017 | 49.4% | 21.5% |
| 2018 | 41.5% | 21.2% |
| 2019 | 40.1% | 17.6% |
| 2020 | 52.0% | 20.4% |
| 2021 | 44.1% | 18.1% |
| 2022 | 38.9% | 14.7% |
| 2023 | 27.2% | 16.3% |
| 2024 | 31.1% | 12.3% |
Notes: Average annual compensation for CEOs at the top 350 U.S. firms ranked by sales is measured in two ways. Both include salary, bonus, and long-term incentive payouts, but the “granted” measure includes the value of stock options and stock awards when they were granted, whereas the “realized” measure captures the value of stock-related components that accrues after options or stock awards are granted by including “stock options exercised” and “vested stock awards.” Projected value for 2024 is based on the percent change in CEO pay in the samples available in June 2023 and in August 2024 applied to the full-year 2023 value.
Source: Authors’ analysis of data from Compustat’s ExecuComp database.
CEO pay is excessive even relative to other extraordinarily privileged actors in the economy
Even compared with the most privileged workers in the U.S. economy—the top 0.1%—CEO pay has grown far faster.

To some analysts, the dramatic rise in CEO compensation has been driven largely by the demand for the skills of CEOs and other highly paid professionals. In this interpretation, CEO compensation is being set by the market for “skills” or “talent,” not by managerial power or the ability of CEOs to extract economic rents (income in excess of their contribution to actually producing it). The “market for talent” argument is based on the premise that it is other professionals, too, not just CEOs, who are seeing a generous rise in pay. The most prominent example of this argument comes from Kaplan (2012a, 2012b).
This lies in contrast to the explanation offered by Bebchuk and Fried (2004) and Clifford (2017), who claim that the long-term increase in CEO pay is a result of managerial power. Similarly, Bivens and Mishel (2013) argue that CEO pay gains are not the result of a competitive market for talent but rather reflect the power of CEOs to extract excessive pay packages from compliant corporate boards.
If CEO pay really was just being pushed up in a general “market for talent” that was rewarding all highly skilled workers, we would generally expect the ratio of CEO pay to that of other highly privileged workers (like those in the top 0.1%) to be stable. But in fact, this ratio has risen enormously in the past five decades. In 2023 (the last year available for the top 0.1% data series), this ratio was 7.5, meaning that CEOs made 7.5 times as much in salary as even the most privileged 0.1% of workers in the economy. Between 1965 and 1978, by contrast, this ratio averaged just 2.6. This is an extremely large change: It essentially means that the relative pay of CEOs increased by an amount equal to the total annual wages of over five of these very-high-wage earners. A one-point rise in the ratio is the equivalent of the average CEO earning an additional amount equal to that of the average earnings of someone in the top 0.1%.
CEO pay rising far faster than that of the top 0.1% suggests that market power is uniquely operating in CEO pay markets and rising pay is not a result of a competitive market for talent.
The extremely rapid growth of CEO compensation compared with the earnings of the top 0.1% of wage earners does not mean that the top 0.1% fared poorly. In fact, the very highest earners—those in the top 0.1% of all earners—saw their annual earnings (including realized stock options and vested stock awards) grow fantastically, though far less than the compensation of the CEOs of large firms (which are also a very small subset of the top 0.1%). Top 0.1% annual earnings grew a healthy 356.6% from 1978 to 2023, though that was just a small fraction of the 1,027.4% growth of realized CEO compensation achieved between 1978 and 2023 (strict comparability on the years 1979 to 2024 is not available because we do not have CEO data for 1979 nor top 0.1% data for 2024).
Since CEO pay growing far faster than the pay of other high earners is evidence of the presence of rents, one can conclude that today’s top executives are collecting substantial rents, claiming income that greatly exceeds their contribution to producing it. This means that if CEOs were paid less, there would be no loss of productivity or output in the economy.
The large discrepancy between the pay of CEOs and other very-high-wage earners also casts doubt on the claim that CEOs are being paid these extraordinary amounts because of their special skills and the market for those skills. It is unlikely that the skills of CEOs of very large firms are so outsized and disconnected from the skills of other high earners that they propel CEOs past most of their cohort in the top one-tenth of 1%.
CEO compensation relative to top 0.1% earners is much higher than it was in the 1965–1978 period: Ratio of CEO compensation to top 0.1% wages, 1965–2023
| year | Ratio of CEO pay to top 0.1% wages | 1965–1978 average ratio: 2.6 |
|---|---|---|
| 1965 | 2.29 | 2.60 |
| 1966 | 2.41 | 2.60 |
| 1967 | 2.52 | 2.60 |
| 1968 | 2.64 | 2.60 |
| 1969 | 2.59 | 2.60 |
| 1970 | 2.55 | 2.60 |
| 1971 | 2.5 | 2.60 |
| 1972 | 2.45 | 2.60 |
| 1973 | 2.4 | 2.60 |
| 1974 | 2.53 | 2.60 |
| 1975 | 2.66 | 2.60 |
| 1976 | 2.79 | 2.60 |
| 1977 | 2.92 | 2.60 |
| 1978 | 3.06 | 2.60 |
| 1979 | 3 | 2.60 |
| 1980 | 2.94 | 2.60 |
| 1981 | 2.88 | 2.60 |
| 1982 | 2.82 | 2.60 |
| 1983 | 2.76 | 2.60 |
| 1984 | 2.71 | 2.60 |
| 1985 | 2.65 | 2.60 |
| 1986 | 2.59 | 2.60 |
| 1987 | 2.53 | 2.60 |
| 1988 | 2.47 | 2.60 |
| 1989 | 2.41 | 2.60 |
| 1990 | 2.88 | 2.60 |
| 1991 | 3.35 | 2.60 |
| 1992 | 3.82 | 2.60 |
| 1993 | 4.43 | 2.60 |
| 1994 | 3.86 | 2.60 |
| 1995 | 4.4 | 2.60 |
| 1996 | 5.34 | 2.60 |
| 1997 | 7.01 | 2.60 |
| 1998 | 9.21 | 2.60 |
| 1999 | 7.21 | 2.60 |
| 2000 | 8.94 | 2.60 |
| 2001 | 5.88 | 2.60 |
| 2002 | 5.82 | 2.60 |
| 2003 | 7.48 | 2.60 |
| 2004 | 7.34 | 2.60 |
| 2005 | 8.4 | 2.60 |
| 2006 | 8.14 | 2.60 |
| 2007 | 7.67 | 2.60 |
| 2008 | 5.71 | 2.60 |
| 2009 | 5.54 | 2.60 |
| 2010 | 6.25 | 2.60 |
| 2011 | 6.83 | 2.60 |
| 2012 | 8.9 | 2.60 |
| 2013 | 8.58 | 2.60 |
| 2014 | 8.16 | 2.60 |
| 2015 | 8.09 | 2.60 |
| 2016 | 7.56 | 2.60 |
| 2017 | 7.73 | 2.60 |
| 2018 | 7.63 | 2.60 |
| 2019 | 8.45 | 2.60 |
| 2020 | 9.14 | 2.60 |
| 2021 | 8.26 | 2.60 |
| 2022 | 9.38 | 2.60 |
| 2023 | 7.54 | 2.60 |
Note: Wages of top 0.1% of wage earners reflect W-2 annual earnings, which includes the value of exercised stock options and vested stock awards.
Source: Authors’ analysis of EPI State of Working America Data Library data on top 0.1% wages in Gould and Kandra 2023.
No matter how you measure it, CEO pay has skyrocketed
Findings on CEO pay are not dependent on a particular specification. When we make small changes to our measurement of CEO pay, there are still enormous gains over the long run.

Table 2 shows three additional ways to measure CEO compensation. The first column in the table is the original method presented above: average CEO compensation, 1967–2024. The second column shows average CEO compensation as a three-year rolling average to smooth out data volatility. The third column removes outliers from the data, namely the highest and lowest levels of compensation from the top 350 highest paid executives. The fourth column provides the median instead of the average compensation. Because of data limitations, the last two measures are only available starting in 1992.
Additional ways to measure CEO compensation
| year | Average CEO Compensation | Average CEO Compensation (Rolling) | Average CEO Compensation (Middle 340) | Median CEO Compensation |
|---|---|---|---|---|
| 1967 | 1,251 | 1,164 | ||
| 1978 | 1,925 | 1,822 | ||
| 1992 | 6,370 | 5,444 | 6,287 | 3,323 |
| 2000 | 25,392 | 21,383 | 35,289 | 6,646 |
| 2023 | 21,707 | 27,522 | 26,993 | 15,062 |
| 2024 | 22,983 | 24,332 | 30,943 | 14,113 |
Notes: The rolling average measure using a three-year rolling average to smooth the data series. The middle 340 compensation measure removes the highest and lowest paid among the top 350 CEOs to make sure the results aren't based on outliers. The median measure takes the mid-point of the 350 CEOs instead of the average.
Source: Authors’ analysis of data from Compustat’s ExecuComp database.
View the extended table in a new tab
However CEO pay is measured, it is clear that there have been enormous increases in pay and the CEO-to-worker pay ratio over the last few decades.
CEO-to-worker pay ratio skyrocketed no matter how you measure it: CEO-to-worker pay ratio using average compensation, average compensation rolling average, average compensation for the middle 340, and median compensation, 1965-2024
| Year | Average CEO Compensation to worker pay ratio | Average CEO Compensation (Rolling) to worker pay ratio | Average CEO Compensation (Middle 340) to worker pay ratio | Median CEO Compensation to worker pay ratio |
|---|---|---|---|---|
| 1965 | 20.6 | |||
| 1966 | 21.9 | |||
| 1967 | 23.1 | 21.9 | ||
| 1968 | 24.3 | 23.1 | ||
| 1969 | 24.0 | 23.8 | ||
| 1970 | 23.8 | 24.0 | ||
| 1971 | 23.5 | 23.8 | ||
| 1972 | 23.2 | 23.5 | ||
| 1973 | 23.0 | 23.2 | ||
| 1974 | 24.5 | 23.6 | ||
| 1975 | 26.1 | 24.5 | ||
| 1976 | 27.6 | 26.1 | ||
| 1977 | 29.2 | 27.6 | ||
| 1978 | 30.7 | 29.2 | ||
| 1979 | 33.4 | 31.1 | ||
| 1980 | 36.1 | 33.4 | ||
| 1981 | 38.8 | 36.1 | ||
| 1982 | 41.4 | 38.8 | ||
| 1983 | 44.1 | 41.4 | ||
| 1984 | 46.8 | 44.1 | ||
| 1985 | 49.4 | 46.8 | ||
| 1986 | 52.1 | 49.4 | ||
| 1987 | 54.8 | 52.1 | ||
| 1988 | 57.4 | 54.8 | ||
| 1989 | 60.1 | 57.4 | ||
| 1990 | 75.6 | 64.4 | ||
| 1991 | 91.2 | 75.6 | ||
| 1992 | 106.7 | 91.2 | 106.0 | 52.7 |
| 1993 | 108.2 | 102.0 | 102.4 | 56.7 |
| 1994 | 87.6 | 100.8 | 85.9 | 58.5 |
| 1995 | 117.1 | 104.3 | 111.0 | 66.7 |
| 1996 | 150.0 | 118.2 | 141.1 | 79.5 |
| 1997 | 223.1 | 163.4 | 194.1 | 105.6 |
| 1998 | 304.2 | 225.8 | 434.8 | 88.8 |
| 1999 | 275.3 | 267.5 | 416.0 | 96.3 |
| 2000 | 379.6 | 319.7 | 534.0 | 96.9 |
| 2001 | 214.3 | 289.7 | 347.6 | 83.0 |
| 2002 | 186.2 | 260.0 | 250.7 | 84.4 |
| 2003 | 228.5 | 209.6 | 330.6 | 111.5 |
| 2004 | 261.8 | 225.5 | 393.9 | 134.8 |
| 2005 | 319.5 | 269.9 | 471.9 | 156.4 |
| 2006 | 322.4 | 301.3 | 448.6 | 162.7 |
| 2007 | 328.5 | 323.5 | 438.3 | 150.3 |
| 2008 | 200.0 | 283.6 | 272.2 | 101.7 |
| 2009 | 166.4 | 231.6 | 243.2 | 101.3 |
| 2010 | 209.9 | 192.1 | 314.3 | 127.2 |
| 2011 | 238.9 | 205.1 | 342.0 | 144.1 |
| 2012 | 363.4 | 270.8 | 423.3 | 163.6 |
| 2013 | 318.5 | 307.0 | 445.2 | 173.5 |
| 2014 | 320.3 | 334.1 | 451.8 | 185.7 |
| 2015 | 320.3 | 319.7 | 446.0 | 182.5 |
| 2016 | 269.3 | 303.3 | 379.7 | 175.5 |
| 2017 | 294.4 | 294.7 | 416.4 | 191.9 |
| 2018 | 284.4 | 282.7 | 371.8 | 179.1 |
| 2019 | 311.5 | 296.7 | 416.1 | 176.5 |
| 2020 | 356.2 | 317.4 | 488.4 | 157.7 |
| 2021 | 408.5 | 358.7 | 550.9 | 193.4 |
| 2022 | 361.3 | 375.3 | 473.7 | 204.8 |
| 2023 | 276.5 | 348.7 | 338.6 | 184.8 |
| 2024 | 280.7 | 306.2 | 380.4 | 169.0 |
Notes: The rolling average measure using a three-year rolling average to smooth the data series. The middle 340 compensation measure removes the highest and lowest paid among the top 350 CEOs to make sure the results aren't based on outliers. The median measure takes the mid-point of the 350 CEOs instead of the average.
Source: Authors’ analysis of data from Compustat’s ExecuComp database.
Policy solutions
Policies that limit CEOs’ ability to dominate or collude with corporate boards to extract excessive compensation are needed to prevent the U.S. from becoming a winner-take-all society. These policies could include using tax policy to incentivize lower CEO pay, making shareholder votes on CEO compensation more binding, and using antitrust enforcement and regulation to rein in the market power of the largest firms. Further, increasing typical workers’ leverage to secure higher pay from firms would leave less left over for CEOs and other executives to claim—so raising typical workers’ pay will provide a rein on CEO pay as well.
Several policy options could reverse the trend of excessive executive pay and broaden wage growth, including:
Using tax policy to reduce the incentives for executives to push for such high pay.
The most effective disincentive would come from higher marginal income tax rates.
Higher tax rates on income derived from wealth-holding would also allow policymakers to claw back some of the past outsized gains CEOs have made.
If policymakers wanted to use company-level taxes to target CEO pay, they should optimally target CEO pay levels. Firm-specific CEO pay ratios allow too many margins for firms to game to be useful reference points for tax policy (see Bivens [2023] for more on the best ways to use tax policy to rein in CEO pay). Baker, Bivens, and Schieder (2019) review policies that would restrain CEO compensation and explain how tax policy and corporate governance reform can work in tandem:
Tax policy that penalizes corporations for excess CEO-to-worker pay ratios can boost incentives for shareholders to restrain excess pay, [but] to boost the power of shareholders [to restrain pay], fundamental changes to corporate governance have to be made. One key example of such a fundamental change would be to provide worker representation on corporate boards or boost the ability of workers across the economy to form unions.
Given the vital importance of changing shareholders’ ability to restrain pay (not just their incentive to do so), another policy that could potentially limit executive pay growth is greater use of “say on pay,” which allows a firm’s shareholders to vote on top executives’ compensation.
The CEOs examined in this report head large firms. These firms, almost by definition, enjoy a degree of market power that some studies suggest has grown in recent decades (Paunov and Bas 2022). It seems that CEOs and other executives may have been prime beneficiaries of these firms’ greater market power. Using the tools of antitrust enforcement and regulation would help to restrain these firms’ market power. This would not only promote economic efficiency and competition but might help restrain executive pay as well.
Methodology
Detailed discussion of how we analyze CEO pay.
We focus on the average compensation of CEOs at the 350 largest publicly owned U.S. firms (firms that sell stock on the open market) by revenue. Our source of data is the S&P Compustat ExecuComp database for the years 1992 to 2024, and survey data published by The Wall Street Journal for selected years back to 1965. We maintain the sample size of 350 firms each year when using the Compustat ExecuComp data.
A note about the Compustat data
It is worth noting some complexity of the Compustat data at the outset. Compustat tracks data (including measures of CEO compensation) for all publicly traded firms in the United States across a range of years (we use it back to 1992 and find it reliable since that year). But public companies sometimes move out of the data universe of publicly traded firms. They might go private, go out of business entirely, or be bought by another firm. When a firm stops being public, it does not simply drop out of the sample from that point on; it is also removed from previous years’ samples in the Compustat database.
Optimally, we would like the Compustat data to provide information on the largest 350 firms that were public in a given year. Instead, the data provide information on the largest 350 firms that were public in a given year and that continue to be public, according to the most recent data. This explains why some of our data—even for years relatively far in the past—change with each iteration of this report.
Further, even the pre-1992 data that we use rely on a procedure that “backcasts” Compustat to pre-1992 data that originate from other sources. Therefore, even the pre-1992 data can change with each successive round of Compustat. In practice, the degree of change to previous years’ data caused by this reshuffling of firms in the Compustat universe is quite small, but it is not zero.
Two ways of measuring CEO compensation
We use two measures of CEO compensation: one based on compensation as “realized,” and the other based on compensation as “granted.” Both measures include the same measures of salary, bonuses, and long-term incentive payouts. The difference lies in how each measure treats stock awards and stock options—major components of CEO compensation that change value from when they are first provided, or granted, to when they are realized.
The realized measure of compensation includes the value of stock options when they are actually realized or exercised, capturing the change in value from when the options were granted to when the CEO invokes the options, usually after the stock price has risen and options value has increased. The realized compensation measure also values stock awards at their value when vested (usually three years after being granted), capturing any change in the stock price as well as additional stock awards provided as part of a performance award.
The granted measure of compensation values stock options and restricted stock awards by their “fair value” when granted. This fair value must be estimated based on several assumptions about the future path of stock prices, interest rates, and other variables. Compustat estimates of the fair value of options and stock awards as granted are derived from the Black-Scholes model. For details on the construction of these measures and benchmarking to other studies, see Sabadish and Mishel (2013).
In some sense, realized measures of pay are backward-looking, while granted measures are forward-looking. Realized measures of stock-related pay in 2023 are essentially measuring how much money CEOs were able to bring home based (largely) on the past year’s stock options and awards. Granted measures of stock-related pay in 2023 are essentially estimating how much new options and awards are likely to pay off in future years. Because neither measure perfectly maps onto a measure of how much a CEO “earned” in a single particular year, reporting both can be useful for understanding the full picture.
References
Baker, Dean, Josh Bivens, and Jessica Schieder. 2019. Reining in CEO Compensation and Curbing the Rise of Inequality. Economic Policy Institute, June 2019.
Bebchuk, Lucian, and Jesse Fried. 2004. Pay Without Performance: The Unfulfilled Promise of Executive Remuneration. Cambridge, Mass.: Harvard Univ. Press.
Bivens, Josh. 2023. Using tax policy to restrain CEO pay. Economic Policy Institute, December 13, 2023.
Bivens, Josh, and Lawrence Mishel. 2013. “The Pay of Corporate Executives and Financial Professionals as Evidence of Rents in Top 1 Percent Incomes.” Economic Policy Institute Working Paper no. 296, June 2013.
Bureau of Labor Statistics, Current Employment Statistics (CES). Various years. Accessed September 2025.
Clifford, Steven. 2017. The CEO Pay Machine: How It Trashes America and How to Stop It. New York: Penguin Random House.
Compustat. Various years. ExecuComp [commercial database].
Economic Policy Institute (EPI). 2025. “The Productivity-Pay Gap.” Economic Policy Institute website, accessed September 11 2025.
Federal Reserve Bank of St. Louis (FRED). 2025. Stock Market Indices, September 11, 2025.
Gould, Elise, and Jori Kandra. 2024. “Wage inequality fell in 2023 amid a strong labor market, bucking long-term trends.” Working Economics Blog (Economic Policy Institute), December 11, 2024.
Kaplan, Steven N. 2012a. “Executive Compensation and Corporate Governance in the U.S.: Perceptions, Facts, and Challenges.” Martin Feldstein Lecture, National Bureau of Economic Research, Washington, D.C., July 10, 2012.
Kaplan, Steven N. 2012b. “Executive Compensation and Corporate Governance in the U.S.: Perceptions, Facts, and Challenges.” National Bureau of Economic Research Working Paper no. 18395, September 2012.
Paunov, Caroline, and Maria Bas. 2022. “Do US top executives benefit from market concentration?” Oxford Economic Papers 75, no.3. http://dx.doi.org/10.1093/oep/gpac034
Sabadish, Natalie, and Lawrence Mishel. 2013. “Methodology for Measuring CEO Compensation and the Ratio of CEO-to-Worker Compensation, 2012 Data Update.” Economic Policy Institute Working Paper no. 298, June 2013.
Past reports
Archive of the last decade of Economic Policy Institue analysis of CEO pay.
LATEST → Josh Bivens, Elise Gould, and Jori Kandra. 2025. CEO pay, still excessive no matter how you measure it. Economic Policy Institute, September 2025.
Josh Bivens, Elise Gould, and Jori Kandra. 2024. CEO pay declined in 2023. Economic Policy Institute, September 2024.
Josh Bivens and Jori Kandra. 2023. CEO pay slightly declined in 2022. Economic Policy Institute, September 2023.
Josh Bivens and Jori Kandra. 2022. CEO pay has skyrocketed 1,460% since 1978. Economic Policy Institute, October 2022.
Lawrence Mishel and Jori Kandra. 2021. CEO pay has skyrocketed 1,322% since 1978. Economic Policy Institute, August 2021.
Lawrence Mishel and Jori Kandra. 2020. CEO compensation surged 14% in 2019 to $21.3 million. Economic Policy Institute, August 2020.
Lawrence Mishel and Julia Wolfe. 2019. CEO compensation has grown 940% since 1978. Economic Policy Institute, August 2019.
Dean Baker, Josh Bivens and Jessica Schnieder. 2019. Reining in CEO compensation and curbing the rise of inequality Economic Policy Institute, June 2019.
Lawrence Mishel and Jessica Schieder. 2018. CEO compensation surged in 2017. Economic Policy Institute, August 2018.
Lawrence Mishel and Jessica Schieder. 2017. CEO pay remains high relative to the pay of typical workers and high-wage earners. Economic Policy Institute, July 2017.
Lawrence Mishel and Jessica Schieder. 2016. Stock market headwinds meant less generous year for some CEOs. Economic Policy Institute, July 2016.