
Full Report
Chief executive officers (CEOs) of the largest firms in the U.S. earn far more today than they did in the mid-1990s and many times what they earned in the 1960s or 1970s. They also earn far more than the typical worker,1 and their pay—which relies heavily on stock-related compensation—has grown much more rapidly than a typical worker’s pay. Rising CEO pay does not reflect a rising value of skills or contribution to firms’ productivity. What has changed over the years is CEOs’ use of their power to set their own pay. In economic terms, this means that CEO compensation reflects substantial “rents” (income in excess of actual productivity). This is concerning since the earning power of CEOs has been driving income growth at the very top—a key dynamic in the overall growth of inequality. The silver lining in this otherwise unfortunate trend is that CEO pay can be curtailed without damaging economywide growth.
Key findings
- Growth of CEO compensation (1978–2022). Since CEO pay is mostly stock based, calculating it is not entirely straightforward because the value of stocks is continually changing. We use two measures to give a fuller picture: a backward-looking measure—realized compensation—and a forward-looking measure—granted compensation. Using the realized compensation measure, compensation of the top CEOs shot up 1,209.2% from 1978 to 2022 (adjusting for inflation). Top CEO compensation grew roughly 28.1% faster than stock market growth during this period and far eclipsed the slow 15.3% growth in a typical worker’s annual compensation. CEO granted compensation rose 1,046.9% from 1978 to 2022.
- Changes in the CEO-to-worker compensation ratio (1965–2022). Using the realized compensation measure, the CEO-to-worker compensation ratio reached 344-to-1 in 2022. This stands in stark contrast to the 21-to-1 ratio in 1965. Most importantly, over the last two decades the ratio has been far higher than at any point in the 1960s, 1970s, 1980s, or early 1990s. Using the CEO granted compensation measure, the CEO-to-worker compensation ratio fell to 221-to-1 in 2022, significantly lower than its peak of 396-to-1 in 2000 but still many times higher than the 45-to-1 ratio of 1989 or the 15-to-1 ratio of 1965.
- Changes in the composition of CEO compensation. The composition of CEO compensation is shifting away from the use of stock options and toward stock awards. In 2006, stock options accounted for just over 70% of stock-related pay in realized CEO compensation. But in 2022, stock options were only 34% with vested stock awards accounting for the rest. Stock-related pay (exercised stock options and vested stock awards) averaged $20.5 million in 2022 and accounted for 81.3% of average realized CEO compensation.
- Changes in the CEO-to-top-0.1% compensation ratio. CEO compensation has even been breaking away from that of other very highly paid workers. Over the last three decades, compensation grew far faster for CEOs than it did for the top 0.1% of wage earners (those earning more than 99.9% of wage earners). CEO compensation in 2021 (the latest year for which data on top 0.1% wage earners are available) was 7.68 times as high as wages of the top 0.1% of wage earners, a ratio 4.1 points greater than the 3.61-to-1 average CEO-to-top-0.1% ratio over the 1951–1979 period.
- Implications of the growth of the CEO-to-top-0.1% compensation ratio. The fact that CEO compensation has grown much faster than the pay of the top 0.1% of wage earners indicates that CEO compensation growth does not simply reflect a competitive race for skills (the “market for talent”) that would also increase the value of highly paid professionals more generally. Rather, the growing pay differential between CEOs and top 0.1% earners suggests the growth of substantial economic rents (income not related to a corresponding growth of productivity) in CEO compensation. CEO compensation does not appear to reflect the greater productivity of executives but their ability to extract concessions from corporate boards—a power that stems from dysfunctional systems of corporate governance in the United States. But because so much of CEOs’ income constitutes economic rent, there would be no adverse impact on the economy’s output or on employment if CEOs earned less or were taxed more.
- Growth of top 0.1% compensation (1979–2021). Even though CEO compensation grew much faster than the earnings of the top 0.1% of wage earners, that doesn’t mean the top 0.1% fared poorly. Quite the contrary. The inflation-adjusted annual earnings of the top 0.1% grew 465% from 1979 to 2021. CEO compensation, however, grew more than 2.5 times as fast!
Measuring CEO compensation
We focus on the average compensation of CEOs at the 350 largest publicly owned U.S. firms (those firms that sell stock on the open market) by revenue. Our source of data is the S&P Compustat ExecuComp database for the years 1992 to 2022 and survey data published by The Wall Street Journal for selected years back to 1965. We maintain the sample size of 350 firms each year when using the Compustat ExecuComp data.2
A note about the Compustat data
It is worth noting some complexity of the Compustat data at the outset. Compustat tracks data (including measures of CEO compensation) for all publicly traded firms in the United States across a range of years (we use it back to 1992 and find it reliable since that year). But public companies sometimes move out of the data universe of publicly traded firms. They might go private, go out of business entirely, or be bought by another firm. When a firm stops being public, it does not simply drop out of the sample from that point on; it is also removed from previous years’ samples.
Optimally, we would like the Compustat data to provide information on the largest 350 firms that were public in a given year. Instead, the data provide information on the largest 350 firms that were public in a given year and that continue to be public according to the most recent data. This explains why some of our data—even for years relatively far in the past—changes with each new iteration of this report.
Further, even the pre-1992 data that we use rely on a procedure that “backcasts” Compustat to pre-1992 data that originate from other sources. Therefore, even the pre-1992 data can change with each successive round of Compustat.
In practice, the degree of change to previous years’ data caused by this reshuffling of firms in the Compustat universe is quite small, but it is not zero.
Two ways of measuring CEO compensation
We use two measures of CEO compensation, one based on compensation as “realized” and the other based on compensation as “granted.” Both measures include the same measures of salary, bonuses, and long-term incentive payouts. The difference lies in how each measure treats stock awards and stock options, major components of CEO compensation that change value from when they are first provided, or granted, to when they are realized.
The realized measure of compensation includes the value of stock options when they are actually realized or exercised, capturing the change in value from when the options were granted to when the CEO invokes the options, usually after the stock price has risen and the options values have increased. The realized compensation measure also values stock awards at their value when vested (usually three years after being granted), capturing any change in the stock price as well as additional stock awards provided as part of a performance award.
The granted measure of compensation values stock options and restricted stock awards by their “fair value” when granted. This fair value must be estimated given a number of assumptions about the future path of stock prices, interest rates, and other variables. Compustat estimates of the fair value of options and stock awards as granted are derived from the Black-Scholes model. For details on the construction of these measures and benchmarking to other studies, see Sabadish and Mishel 2013.
In some sense, realized measures of pay are backward-looking, while granted measures are forward-looking. Realized measures of stock-related pay in 2022 are essentially measuring how much money CEOs were able to bring home based (largely) on the past year’s stock options and awards. Granted measures of stock-related pay in 2022 are essentially measuring estimates of how much new options and awards are likely to pay off in future years. Because neither measure perfectly maps onto a measure of how much a CEO “earned” in a single particular year, reporting both can be useful.
Analysis
Trends in CEO compensation growth
This section examines several decades of available data to identify historical trends in CEO compensation. Stock-related components have constituted a growing share of total CEO compensation over time. Lately, there has been a shift away from stock options to stock awards—a small sign that perhaps CEO labor markets are getting slightly less dysfunctional on the margins.
Composition of CEO compensation
Stock-related components of CEO compensation constitute a large and increasing share of total compensation. Realized stock awards and stock options made up 70.2% of total CEO compensation in 2006 ($15.1 million out of $21.6 million) and 81.3% of total compensation ($20.5 million out of $25.2 million) in 2022 (not shown in chart). The growth of these stock-related components from 2006 to 2022 explains over 100% of the total growth in CEO realized compensation over this period.3 Of the stock-related components of compensation, stock awards make up a growing share, while the share of stock options in CEO compensation packages has decreased over time.
There is a simple logic behind companies’ decisions to shift from stock options to stock awards in CEO compensation packages, as Clifford (2017) explains. With stock options, CEOs can make only gains: They realize a gain if their company’s stock price rises beyond the price of the initial options granted, and they lose nothing if the stock price falls. The fact that they have nothing to lose—but potentially a lot to gain—might lead options-holding CEOs to take excessive risks to bump up their company’s stock price to an unsustainable short-term high.
Stock awards, on the other hand, likely promote better long-term alignment of a CEO’s goals with those of shareholders. A stock award has a value when given or vested and can increase or decrease in value as the firm’s stock price changes. If stock awards have a lengthy vesting period of three to five years, then the CEO has an interest in lifting the firm’s stock price over that period while being mindful to avoid any implosion in the stock price—to maintain the value of what they have. In some sense, the shift from options to awards might represent a small glimmer of hope that CEO labor markets are getting a bit less dysfunctional (though there is obviously a long way to go).
CEO compensation growth in 2022
Realized CEO compensation (reported in Table 1) declined by 14.8%4 to $25.2 million from 2021 to 2022. This decline was overwhelmingly due to the reduced value of exercised stock options, a decline surely related to broad-based declines in stock prices in 2022.
The granted measure of CEO compensation, which values stock options granted in 2022 (not those exercised), also fell by 12.4%.
Long-term trends in CEO compensation
Table 1 also presents the longer-term trends in CEO compensation for selected years from 1965 to 2022.5 Our discussion of longer-term trends focuses mostly on the realized compensation measure of CEO compensation preferred in most economic analyses. In general, CEO compensation follows the movement of the stock market but tends to exceed even the largest stock market gains.
Table 1 allows us to compare CEO compensation with that of a typical worker by showing the average annual compensation (wages and benefits of a full-time, full-year worker) of private-sector production/nonsupervisory workers (a group covering more than 80% of payroll employment; see Gould 2020).
From 1992 onward, the table also identifies the average annual compensation of production/nonsupervisory workers in the key industries of the firms included in the sample. We take this compensation as a proxy for the pay of typical workers in these particular firms and use it to calculate the CEO-to-worker compensation ratio for each firm.
CEO compensation, CEO-to-worker compensation ratio, and stock prices (2022$), selected years, 1965–2022
| CEO annual compensation (thousands) | Private-sector production/nonsupervisory workers annual compensation (thousands) |
Stock market (indexed to 2022$) | CEO-to-worker compensation ratio | |||||
|---|---|---|---|---|---|---|---|---|
| Year(s) | Realized | Granted | All private-sector workers | Workers in the firms’ industries* | S&P 500 | Dow Jones | Realized | Granted |
| 1965 | $1,072 | $817 | $48.71 | NA | 715 | 7,387 | 20.7 | 15.4 |
| 1973 | $1,406 | $1,070 | $57.38 | NA | 635 | 5,462 | 23.0 | 17.1 |
| 1978 | $1,926 | $1,466 | $58.68 | NA | 397 | 3,394 | 30.9 | 22.9 |
| 1989 | $3,593 | $2,736 | $56.00 | NA | 740 | 5,753 | 60.4 | 44.7 |
| 1995 | $6,968 | $7,741 | $56.01 | $63.24 | 1,039 | 8,629 | 117.4 | 130.5 |
| 2000 | $25,237 | $25,127 | $59.12 | $68.74 | 2,439 | 18,326 | 380.9 | 395.8 |
| 2007 | $22,195 | $16,824 | $61.54 | $72.34 | 2,096 | 18,699 | 325.9 | 242.0 |
| 2009 | $11,924 | $12,845 | $63.95 | $74.71 | 1,300 | 12,184 | 175.0 | 181.2 |
| 2021 | $29,596 | $19,204 | $68.75 | $78.47 | 4,619 | 36,811 | 389.0 | 254.3 |
| Projected 2022 | $25,210 | $16,814 | $67.68 | $76.96 | 4,099 | 32,897 | 344.3 | 229.0 |
| 2021 FH | $29,568 | $18,674 | $68.70 | $79.20 | 4,619 | 36,811 | 387.2 | 246.5 |
| 2022 FH | $25,186 | $16,350 | $67.70 | $77.00 | 4,099 | 32,897 | 342.8 | 221.2 |
| Percent change | Change in ratio | |||||||
| 1965–1978 | 79.5% | 79.5% | 20.5% | NA | -44.4% | -54.1% | 10.2 | 7.5 |
| 1978–2000 | 1,210.6% | 1,613.9% | 0.8% | NA | 514.0% | 440.0% | 350.0 | 373.0 |
| 2000–2007 | -12.1% | -33.0% | 4.1% | 5.2% | -14.1% | 2.0% | -55.0 | -153.8 |
| 2007–2009 | -46.3% | -23.7% | 3.9% | 3.3% | -38.0% | -34.8% | -150.9 | -60.9 |
| 2009–2022 | 111.4% | 30.9% | 5.8% | 3.0% | 215.3% | 170.0% | 169.4 | 47.8 |
| 2007–2022 | 13.6% | -0.1% | 10.0% | 6.4% | 95.5% | 75.9% | 18.4 | -13.0 |
| 1978–2022 | 1,209.2% | 1,046.9% | 15.3% | NA | 931.8% | 869.3% | 313.5 | 206.1 |
| 2021–2022 | -14.8% | -12.4% | -1.6% | -1.9% | -11.3% | -10.6% | -44.6 | -25.3 |

* Average annual compensation of the workers in the key industry of the firms in the sample.
Notes: Average annual compensation for CEOs at the top 350 U.S. firms ranked by sales is measured in two ways. Both include salary, bonus, and long-term incentive payouts, but the “granted” measure includes the value of stock options and stock awards when they were granted, whereas the “realized” measure captures the value of stock-related components that accrues after options or stock awards are granted by including “stock options exercised” and “vested stock awards.” FH = First half. CEO-to-worker compensation ratios are based on averaging specific firm ratios in samples and not the ratio of averages of CEO and worker compensation. Ratios prior to 1992 are constructed as described in the CEO pay series methodology (Sabadish and Mishel 2013).
Source: Authors’ analysis of data from Compustat’s ExecuComp database, the Federal Reserve Economic Data (FRED) database from the Federal Reserve Bank of St. Louis, the Bureau of Labor Statistics’ Current Employment Statistics data series, and the Bureau of Economic Analysis NIPA tables.
Finally, the table shows inflation-adjusted changes in the stock market, as measured by the Dow Jones Industrial Average and the S&P 500 Index.
CEO compensation (our realized measure) has, in general, risen and fallen along with the S&P 500 Index over the last five and a half decades. But the period from 1965 to 1978 is an exception: Although the stock market fell by roughly half between 1965 and 1978, realized CEO compensation increased by 79.5%.
Typical worker compensation saw relatively strong growth over that period—strong relative to subsequent periods, not relative to CEO pay or the pay of other earners at the top of the wage distribution. Annual worker compensation grew by 20.5% from 1965 to 1978, about a fourth as fast as CEO compensation growth.
Realized CEO compensation grew strongly throughout the 1980s but exploded in the 1990s. It peaked at the end of the stock market bubble in 2000 at about $25.2 million—a 362% increase over just five years earlier in 1995 and a 1,211% increase over 1978. This latter increase exceeded even the growth of the booming stock market between 1978 and 2000 (513.99% for the S&P 500 and 439.98% for the Dow Jones). In stark contrast to both the stock market and CEO compensation, private-sector worker compensation increased just 0.76% from 1978 to 2000.
When the stock market bubble burst in the early 2000s, there was a substantial paring back of CEO compensation. By 2007, however, when the stock market had mostly recovered, realized CEO compensation reached $22.2 million, just $3 million below its 2000 level. However, granted CEO compensation remained down, at $16.8 million in 2007, a substantial $8.3 million fall from the 2000 level.
The stock market decline during the 2008 financial crisis also sent CEO compensation tumbling, as it had in the early 2000s, as realized CEO compensation dropped 46.3% from 2007 to 2009. After 2009, realized CEO compensation resumed an upward trajectory, growing 111.4% from 2009 to 2022 so that CEO compensation exceeded its previous level from 2007 by 13.6%.
To assess the role of CEO compensation in the overall increase in income and wage inequality of the last four decades, it is best to gauge growth since 1978.6 For the period from 1978 to 2022, realized CEO compensation increased 1,209.2%—almost 30% faster than stock market growth (depending on the market index used) and substantially faster than the 15.3% growth in the typical worker’s compensation over the same period. CEO granted compensation grew 1,046.9% over this period.
Trends in the CEO-to-worker compensation ratio
Table 1 also presents trends in the ratio of CEO-to-worker compensation, using both measures of CEO compensation. We compute this ratio, which illustrates the increased divergence between CEO and worker pay over time, in two steps:
- The first step is to construct, for each of the 350 largest U.S. firms, the ratio of the CEO’s compensation to the annual average compensation of production and nonsupervisory workers in the key industry of the firm (data on the pay of workers at individual firms are not available).7
- The second step is to average that ratio across all 350 firms. Note that trends before 1995 are based on the ratio of average top-company CEO pay to the compensation of economywide (not industry-specific) private-sector production/nonsupervisory workers.
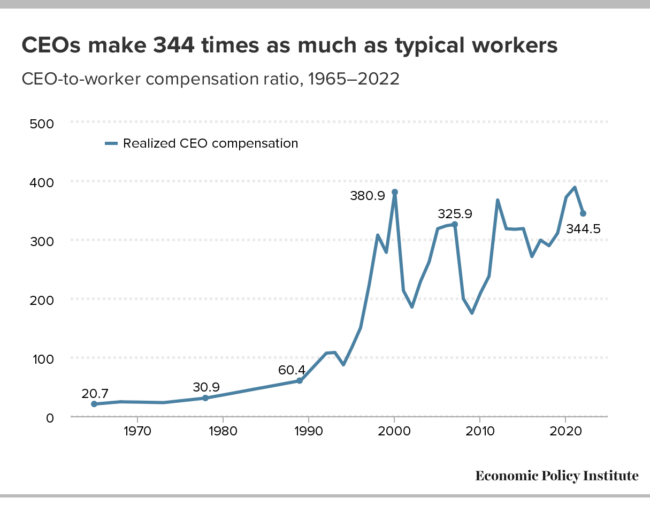
The last two columns in Table 1 show the resulting ratio for both measures of CEO pay. The trends are depicted in Figure A.
CEOs make 344 times as much as typical workers: CEO-to-worker compensation ratio, 1965–2022
| year | Realized CEO compensation | Granted CEO compensation |
|---|---|---|
| 1965 | 20.7 | 15.4 |
| 1966 | 21.9 | 16.3 |
| 1967 | 23.2 | 17.2 |
| 1968 | 24.4 | 18.1 |
| 1969 | 24.1 | 17.9 |
| 1970 | 23.9 | 17.7 |
| 1971 | 23.6 | 17.5 |
| 1972 | 23.3 | 17.3 |
| 1973 | 23.0 | 17.1 |
| 1974 | 24.6 | 18.2 |
| 1975 | 26.2 | 19.4 |
| 1976 | 27.7 | 20.6 |
| 1977 | 29.3 | 21.7 |
| 1978 | 30.9 | 22.9 |
| 1979 | 33.6 | 24.9 |
| 1980 | 36.2 | 26.9 |
| 1981 | 38.9 | 28.8 |
| 1982 | 41.6 | 30.8 |
| 1983 | 44.3 | 32.8 |
| 1984 | 47.0 | 34.8 |
| 1985 | 49.6 | 36.8 |
| 1986 | 52.3 | 38.8 |
| 1987 | 55.0 | 40.8 |
| 1988 | 57.7 | 42.8 |
| 1989 | 60.4 | 44.7 |
| 1990 | 75.9 | 56.3 |
| 1991 | 91.5 | 67.9 |
| 1992 | 107.1 | 79.4 |
| 1993 | 108.2 | 99.2 |
| 1994 | 87.2 | 116.5 |
| 1995 | 117.4 | 130.5 |
| 1996 | 150.3 | 176.7 |
| 1997 | 223.1 | 233.0 |
| 1998 | 307.8 | 304.1 |
| 1999 | 278.4 | 288.7 |
| 2000 | 380.9 | 395.8 |
| 2001 | 213.4 | 326.3 |
| 2002 | 185.4 | 233.1 |
| 2003 | 229.1 | 226.4 |
| 2004 | 262.2 | 231.4 |
| 2005 | 318.6 | 244.8 |
| 2006 | 323.6 | 237.7 |
| 2007 | 325.9 | 242.0 |
| 2008 | 199.5 | 216.5 |
| 2009 | 175.0 | 181.2 |
| 2010 | 209.4 | 203.0 |
| 2011 | 238.1 | 210.9 |
| 2012 | 367.4 | 206.0 |
| 2013 | 318.6 | 210.7 |
| 2014 | 317.6 | 219.1 |
| 2015 | 318.8 | 216.6 |
| 2016 | 271.2 | 220.0 |
| 2017 | 299.2 | 232.5 |
| 2018 | 289.7 | 228.3 |
| 2019 | 311.0 | 228.0 |
| 2020 | 372.3 | 220.3 |
| 2021 | 389.0 | 254.3 |
| 2022 | 344.5 | 229.0 |
Notes: Average annual compensation for CEOs is for CEOs at the top 350 U.S. firms ranked by sales. Typical worker compensation is the average annual compensation (wages and benefits of a full-time, full-year worker) of production/nonsupervisory workers in the industries that the top 350 firms operate in.
Notes: Average annual compensation for CEOs at the top 350 U.S. firms ranked by sales is measured in two ways. Both include salary, bonus, and long-term incentive payouts, but the “granted” measure includes the value of stock options and stock awards when they were granted, whereas the “realized” measure captures the value of stock-related components that accrues after options or stock awards are granted by including “stock options exercised” and “vested stock awards.” Projected value for 2022 is based on the percent change in CEO pay in the samples available in June 2021 and in June 2022 applied to the full-year 2021 value. “Typical worker” compensation is the average annual compensation (wages and benefits of a full-time, full-year worker) of production/nonsupervisory workers in the industries that the top 350 firms operate in.
Source: Authors’ analysis of data from Compustat’s ExecuComp database, the Bureau of Labor Statistics’ Current Employment Statistics data series, and the Bureau of Economic Analysis NIPA tables.
How our metric differs from firm-reported metrics
The Securities and Exchange Commission (SEC) now requires publicly owned firms to provide a metric for the ratio of CEO compensation to that of the median worker in a firm, as mandated by the Dodd-Frank financial reform bill of 2010 (SEC 2015). Those ratios differ from the ones in this report in several ways:
- First, because of limitations in data availability, the measure of worker compensation in our ratios reflects workers in a firm’s key industry, not workers actually working for the firm. The ratios reported to the SEC will reflect compensation of workers in the specific firm.
- Second, our measure reflects an exclusively domestic workforce; it excludes the compensation of workers in other countries who work for the firm. The ratios reported to the Securities and Exchange Commission may include workers in other countries.
- Third, our metric is based on hourly compensation annualized to reflect a full-time, full-year worker (i.e., multiplying the hourly compensation rate by 2,080 hours). In contrast, the measures firms provide to the SEC can be and are sometimes based on the actual annual (not annualized) wages of part-year (seasonal) or part-time workers. As a result, comparisons across firms may reflect not only hourly pay differences but also differences in annual or weekly hours worked.
- Fourth, our metric includes both wages and benefits, whereas the SEC metric focuses solely on wages.
- Finally, we use consistent data and methodology to construct our ratios; our ratios are thus comparable across firms and from year to year. The Securities and Exchange Commission allows firms flexibility in how they construct the CEO-to-typical worker pay comparison. This means there is no comparability across firms—and ratios for any given firm may not even be comparable from year to year if the firm changes the metrics it uses.
There is certainly value in the new metrics being provided to the SEC, but the measures we rely on allow us to make appropriate comparisons between firms and across time. More information on the SEC CEO-to-worker compensation ratio and our comparable measure can be found in Mishel and Kandra 2020.
As Table 1 and Figure A show, using the realized measure of CEO compensation, CEOs of major U.S. companies earned 21 times as much as the typical worker in 1965. This ratio grew to 31-to-1 in 1978 and 60-to-1 by 1989. It surged in the 1990s, hitting 381-to-1 in 2000, at the end of the 1990s recovery and at the height of the stock market bubble.8
The fall in the stock market after 2000 reduced CEO stock-related pay, such as realized stock options, and caused CEO compensation to tumble in 2002 before beginning to rise again in 2003. Realized CEO compensation recovered to a level of 326 times worker pay by 2007, still below its 2000 level. The financial crisis of 2008 and accompanying stock market decline reduced CEO compensation between 2007 and 2009, and the CEO-to-worker compensation ratio fell in tandem.
Over the 2009–2022 period, another surge in realized CEO compensation brought the ratio to 344-to-1, above its 2007 level. Besides being higher than the value achieved in 2000 at the peak of a stock market bubble, it is, of course, far higher than it was in the 1960s, 1970s, 1980s, and the early 1990s.
The pattern using the granted measure of CEO compensation is similar. The CEO-to-worker pay ratio peaked in 2000, at 396-to-1, even higher than the ratio of 381-to-1 with the realized compensation measure. The fall from 2000 to 2007 was steeper than for the other measure, and the CEO-to-worker pay ratio hit 242-to-1 in 2007. The stock market decline during the financial crisis drove the ratio down to 181-to-1 in 2009. The growth in granted CEO compensation over the 2009–2022 period, at just 30.9%, was far less than for realized compensation, so the CEO-to-worker pay ratio recovered to only 229-to-1. This level is far lower than its peak in 2000 but still far greater than the 1995 ratio of 131-to-1, the 1989 ratio of 45-to-1, or the 1965 ratio of 15-to-1.
The extraordinarily high level of the CEO-to-worker compensation ratio reflects the strikingly different trajectory of CEO pay compared with typical worker pay over the past 40 years. On the one hand, there has been very little growth in the compensation of a typical worker since the late 1970s. It has grown just 15.3% over the 44 years from 1978 to 2022, despite a corresponding growth of net economywide productivity of 64.6% (EPI 2022). The 1,437% growth in realized CEO compensation from 1978 (there are no data for 1979) to 2021 far exceeded the growth in productivity, profits, or stock market values in that period.
CEO pay is excessive even relative to other extraordinarily privileged actors in the economy
This section highlights how out-of-line CEO pay is even compared with the most privileged workers in the U.S. economy—the top 0.1%. CEO compensation has grown a great deal since 1965, but so has the pay of other high-wage earners. To some analysts, this suggests that the dramatic rise in CEO compensation has been driven largely by the demand for the skills of CEOs and other highly paid professionals. In this interpretation, CEO compensation is being set by the market for “skills” or “talent,” not by managerial power or the ability of CEOs to extract economic rents (to claim income in excess of their contribution to actually producing).9 This explanation lies in contrast to that offered by Bebchuk and Fried (2004) and Clifford (2017) who claim that the long-term increase in CEO pay is a result of managerial power.
The “market for talent” argument is based on the premise that “it is other professionals, too,” not just CEOs, who are seeing a generous rise in pay. The most prominent example of this argument comes from Kaplan (2012a, 2012b). In the prestigious 2012 Martin Feldstein Lecture at the National Bureau of Economic Research, he claims:
Over the last 20 years, then, public company CEO pay relative to the top 0.1% has remained relatively constant or declined. These patterns are consistent with a competitive market for talent. They are less consistent with managerial power. Other top income groups, not subject to managerial power forces, have seen similar growth in pay. (Kaplan 2012a, 4)
In short, Kaplan is claiming that a stable ratio of CEO pay to top 0.1% pay indicates that market power is not operating uniquely in CEO pay markets. One implication of this is that if the CEO-to-top-0.1% pay ratio is in fact increasing, then the scope for unique exercise of market power in CEO labor markets is large.
We find that this argument that CEO compensation is being set by the generalized market for “skills” does not square with the available data. Bivens and Mishel (2013) address the larger issue of the role of CEO compensation in generating income gains at the very top and conclude that substantial rents are, in fact, embedded in executive pay. According to Bivens and Mishel (2013), CEO pay gains are not the result of a competitive market for talent but rather reflect the power of CEOs to extract concessions from corporate boards.
To reach this finding, we use Kaplan’s series (2012b) on CEO compensation (through 2010 and updated forward using CEO realized compensation) and compare it with the wages of the very highest wage earners in the top 0.1% (reflecting W-2 annual earnings, which include exercised stock options and vested stock awards). We use top wage earners rather than top 0.1% household incomes, as Kaplan did, in order to make the comparisons across earners.10 The wage benchmark seems the most appropriate because it avoids issues of changing household demographics (such as increases in the number of two-earner households over time) and limits the income to labor income. Our wage benchmark excludes capital income, which is included in household income measures.
Figure B compares CEO compensation to top 0.1% earnings ratios back to 1951. In 2021 (the last year available for the top 0.1% data series), this ratio was 7.68, meaning that CEOs made nearly 8 times as much in salary as even the most privileged 0.1% of workers in the economy. This 7.68 ratio in 2021 was about 4.1 points higher than the historical average of 3.61 over the 1951–1979 period. This is a large change, meaning that the relative pay of CEOs increased by an amount equal to the total annual wages of four of these very–high–wage earners.11
CEO compensation relative to top 0.1% earners is much higher than it was in the 1951–1979 period: Ratio of CEO compensation to top 0.1% wages, 1951–2022
| year | Ratio of CEO pay to top 0.1% wages | 1951–1979 average ratio: 3.61 |
|---|---|---|
| 1951 | 3.38 | 3.61 |
| 1952 | 3.27 | 3.61 |
| 1953 | 3.62 | 3.61 |
| 1954 | 3.92 | 3.61 |
| 1955 | 3.93 | 3.61 |
| 1956 | 3.80 | 3.61 |
| 1957 | 4.29 | 3.61 |
| 1958 | 4.14 | 3.61 |
| 1959 | 4.83 | 3.61 |
| 1960 | 3.55 | 3.61 |
| 1961 | 4.04 | 3.61 |
| 1962 | 4.14 | 3.61 |
| 1963 | 4.26 | 3.61 |
| 1964 | 3.86 | 3.61 |
| 1965 | 3.65 | 3.61 |
| 1966 | 3.45 | 3.61 |
| 1967 | 3.50 | 3.61 |
| 1968 | 3.47 | 3.61 |
| 1969 | 3.50 | 3.61 |
| 1970 | 3.26 | 3.61 |
| 1971 | 3.25 | 3.61 |
| 1972 | 3.33 | 3.61 |
| 1973 | 3.06 | 3.61 |
| 1974 | 2.96 | 3.61 |
| 1975 | 2.54 | 3.61 |
| 1976 | 2.60 | 3.61 |
| 1977 | 2.68 | 3.61 |
| 1978 | 3.36 | 3.61 |
| 1979 | 3.84 | 3.61 |
| 1980 | 3.10 | 3.61 |
| 1981 | 3.39 | 3.61 |
| 1982 | 3.12 | 3.61 |
| 1983 | 3.20 | 3.61 |
| 1984 | 2.93 | 3.61 |
| 1985 | 3.56 | 3.61 |
| 1986 | 3.31 | 3.61 |
| 1987 | 3.02 | 3.61 |
| 1988 | 2.72 | 3.61 |
| 1989 | 2.95 | 3.61 |
| 1990 | 3.10 | 3.61 |
| 1991 | 3.57 | 3.61 |
| 1992 | 3.26 | 3.61 |
| 1993 | 3.62 | 3.61 |
| 1994 | 4.79 | 3.61 |
| 1995 | 4.59 | 3.61 |
| 1996 | 6.19 | 3.61 |
| 1997 | 6.50 | 3.61 |
| 1998 | 7.06 | 3.61 |
| 1999 | 7.11 | 3.61 |
| 2000 | 8.94 | 3.61 |
| 2001 | 8.62 | 3.61 |
| 2002 | 7.40 | 3.61 |
| 2003 | 6.75 | 3.61 |
| 2004 | 6.36 | 3.61 |
| 2005 | 5.99 | 3.61 |
| 2006 | 6.17 | 3.61 |
| 2007 | 5.17 | 3.61 |
| 2008 | 5.45 | 3.61 |
| 2009 | 5.60 | 3.61 |
| 2010 | 5.82 | 3.61 |
| 2011 | 6.38 | 3.61 |
| 2012 | 8.41 | 3.61 |
| 2013 | 8.00 | 3.61 |
| 2014 | 7.63 | 3.61 |
| 2015 | 7.55 | 3.61 |
| 2016 | 7.13 | 3.61 |
| 2017 | 7.19 | 3.61 |
| 2018 | 7.08 | 3.61 |
| 2019 | 7.81 | 3.61 |
| 2020 | 8.68 | 3.61 |
| 2021 | 7.68 | 3.61 |
Note: Wages of top 0.1% of wage earners reflect W-2 annual earnings, which includes the value of exercised stock options and vested stock awards.
Source: Authors’ analysis of EPI State of Working America Data Library data on top 0.1% wages in Mishel and Kandra 2020 and data on CEO compensation from an extrapolation of Kaplan’s (2012b) CEO compensation series.
The extremely rapid growth of CEO compensation compared with the earnings of the top 0.1% of wage earners does not mean that the top 0.1% fared poorly. In fact, the very highest earners—those in the top 0.1% of all earners—saw their annual earnings (including realized stock options and vested stock awards) grow fantastically, though far less than the compensation of the CEOs of large firms. Top 0.1% annual earnings grew a healthy 465% from 1979 to 2021, though that was just a small fraction of the 1,437% growth of realized CEO compensation achieved between 1978 and 2021 (strict comparability on the year 1979 is not available in the data).
If CEO pay growing far faster than the pay of other high earners is evidence of the presence of rents, as Kaplan suggests, one would conclude that today’s top executives are collecting substantial rents, claiming income far in excess of their contribution to producing it. This means that if CEOs were paid less, there would be no loss of productivity or output in the economy.
The large discrepancy between the pay of CEOs and other very-high-wage earners also casts doubt on the claim that CEOs are being paid these extraordinary amounts because of their special skills and the market for those skills. It is unlikely that the skills of CEOs of very large firms are so outsized and disconnected from the skills of other high earners that they propel CEOs past most of their cohort in the top one-tenth of 1%. For everyone else, the distribution of skills, as reflected in the overall wage distribution, tends to be much more continuous, so this discontinuity is evidence that factors beyond skills drive the compensation levels of CEOs.
The stock market and CEO pay
There is normally a tight relationship between overall stock prices and CEO compensation. Some commentators draw on this regularity to claim that CEOs are being paid for their performance since, in the commentators’ view, the goal of CEOs is to raise their companies’ stock prices.
However, the stock–CEO compensation relationship does not necessarily imply that CEOs are enjoying high and rising pay because their individual productivity is increasing (because they head larger firms, have adopted new technology, or for other reasons). CEO compensation often grows strongly when the overall stock market rises, and individual firms’ stock values are swept up in this wake. This is a marketwide phenomenon, not one based in the improved performance of individual firms.
Most CEO pay packages allow pay to rise whenever the firm’s stock value rises. In other words, CEOs can cash out stock options regardless of whether the rise in the firm’s stock value was exceptional relative to comparable firms in the same industry. Similarly, vested stock awards increase in value when the firm’s stock price rises in simple correspondence to a marketwide escalation of stock prices. If corporate taxes are reduced and profits rise accordingly, leading to higher stock prices, is it accurate to say that CEOs have made their firms perform better?
The connection between CEO pay and overall inequality
Some observers argue that exorbitant CEO compensation is merely a symbolic issue, with no real consequences for the vast majority of workers. On the contrary, the escalation of CEO compensation, and of executive compensation more generally, has likely helped fuel the wider growth of top 1% and top 0.1% incomes, contributing to widespread inequality.
Our data apply to the CEOs of the very largest firms. We presume that these CEOs set the pay standards followed by other executives—of the largest publicly owned firms, of smaller publicly owned firms, of privately owned firms, and of major nonprofit firms (hospitals, universities, charities, etc.). If so, then CEO compensation is indeed a nontrivial driver of top incomes.
High CEO pay reflects economic rents—income that CEOs can skim from the economy not by virtue of their contribution to economic output but by virtue of their powerful position. Clifford (2017) alludes to the fictional town in the radio program A Prairie Home Companion in describing the Lake Wobegon world of CEO compensation setting that fuels its growth: Every firm wants to believe its CEO is above average and therefore needs to be correspondingly remunerated. But, in fact, CEO compensation could be reduced across the board, and the economy would not suffer any loss of output.
Another implication of rising pay for CEOs and other executives is that it reflects income that would otherwise have accrued to others instead of being concentrated at the highest level. What these executives earned was not available for broader-based wage growth for other workers (Bivens and Mishel 2013). It is useful, in this context, to note that wages for the bottom 90% would be 25% higher today had wage inequality not increased between 1979 and 2021.12
Most of the rise in inequality took the form of redistributing wages away from the bottom 90%. This group’s share of total wage income fell from 69.8% in 1979 to 58.5% in 2021. Most of the loss experienced by the bottom 90% went to the top 1%, whose wage share doubled from 7.3% to 14.6% in these same years. And even among this gain going to the top 1%, most of it went to the top 0.1%, who saw their share of overall wage income more than triple from 1.6% to 5.9% between 1979 and 2021. In other words, the bottom 90% had 11.3% of total wage income taken from them between 1979 and 2021, and that just under two-thirds of this loss (7.3 of 11.3 percentage points) went to the top 1%, and almost 40% (or 4.3 of 11.3 percentage points) went to just the top 0.1%.
Policy recommendations: Reversing the trend
Several policy options could reverse the trend of excessive executive pay and broaden wage growth. Ideally, tax reforms would be paired with changes in corporate governance:
- Implementing higher marginal income tax rates at the very top would limit rent-seeking behavior and reduce the incentives for executives to push for such high pay.
- Another option is to set corporate tax rates higher for firms that have higher ratios of CEO-to-worker compensation. Clifford (2017) recommends setting a cap on executive compensation and taxing companies on any amount over the cap, similar to the way baseball team payrolls are taxed when salaries exceed a cap. One key consideration in making policies like this work concerns “fissuring”—the practice of spinning off the lower
–paid workers in a given firm and using contracted third-party service providers to replace these functions (often rehiring the exact same workers but now no longer as permanent employees of the old firm). Such fissuring would boost firm-specific measures of typical workers’ pay and reduce the CEO-to-worker pay ratio without changing any economic reality. The newly contracted workers would not necessarily see any higher pay, and the CEOs would not need to accept lower pay. This type of fissuring is endemic in the U.S. economy and is a policy barrier to many efforts to constrain specific firms’ behavior through incentives like this.
Baker, Bivens, and Schieder (2019) review policies that would restrain CEO compensation and explain how tax policy and corporate governance reform can work in tandem:
Tax policy that penalizes corporations for excess CEO-to-worker pay ratios can boost incentives for shareholders to restrain excess pay, [but] to boost the power of shareholders [to restrain pay], fundamental changes to corporate governance have to be made. One key example of such a fundamental change would be to provide worker representation on corporate boards.
Given the vital importance of changing shareholders’ ability to restrain pay (not just their incentive to do so), another policy that could potentially limit executive pay growth is greater use of “say on pay,” which allows a firm’s shareholders to vote on top executives’ compensation.
The CEOs examined in this report head large firms. These firms, almost by definition, enjoy a degree of market power that some studies suggest has grown in recent decades. It seems that CEOs and other executives may have been prime beneficiaries of these firms’ greater market power. Using the tools of antitrust enforcement and regulation would help to restrain these firms’ market power. This would not only promote economic efficiency and competition but might help restrain executive pay as well.
Acknowledgments
The authors thank the Stephen M. Silberstein Foundation for its generous support of this research. Steven Balsam has provided useful advice on data construction and interpretation over the years. He is an accounting professor at Temple University and author of Executive Compensation: An Introduction to Practice and Theory (2007) and Equity Compensation: Motivations and Implications (2013). Steven Clifford, author of The CEO Pay Machine: How It Trashes America and How to Stop It (2017), has also provided technical advice. Clifford served as CEO for King Broadcasting Company from 1987 to 1992 and National Mobile Television from 1992 to 2000 and has been a director of 13 public and private companies.
About the authors
Josh Bivens is the chief economist at the Economic Policy Institute. His areas of research include macroeconomics, inequality, social insurance, public investment, and the economics of globalization. Bivens has provided expert insight to a range of institutions and media, including formally testifying numerous times before committees of the U.S. Congress. He has a Ph.D. in economics from the New School for Social Research.
Jori Kandra is a research assistant at the Economic Policy Institute. In addition to the CEO pay series, she has worked on the State of Working America 2020 wages report and the domestic workers chartbook, among other EPI publications. She has a bachelor’s degree in economics from the University of Texas at Austin.
Notes
1. For the pay of the typical worker, we use average compensation (wages and salaries plus benefits) of a full-time, full-year production or nonsupervisory worker (a group that makes up about 80% of the private-sector workforce).
2. In earlier reports, our sample for each year was sometimes fewer than 350 firms because some of these large firms did not have the same CEO for most of or all of the year or the compensation data were not yet available. In order to not let changes in sample size affect annual trends, we now examine the top 350 firms with the largest revenues each year for which there are data.
3. Authors’ analysis of the Compustat ExecuComp data.
4. Note that while we report executive compensation in millions in the text, and we round numbers to the nearest thousand in Table 1, dollar and percent changes are calculated using unrounded data.
5. We choose which years to present in the table based in part on data availability. Where possible, we choose cyclical peaks (years of low unemployment).
6. A better comparison would be to the low-unemployment year of 1979, but those data are not available.
7. There are a limited number of firms, which existed only for certain years between 1992 and 1996, for which a North American Industry Classification System (NAICS) value is unassigned. This makes it impossible to identify the pay of the workers in the firm’s key industry. These firms are therefore not included in the calculation of the CEO-to-worker compensation ratio.
8. As noted earlier, it may seem counterintuitive that the two ratios for 2000 are different from each other when the average CEO compensation is the same. It is important to understand that (as described later in this report) we do not create the ratio from the averages; rather we construct a ratio for each firm and then average the ratios across firms.
9. The managerial power view asserts that CEOs have excessive, noncompetitive influence over the compensation packages they receive. Rent-seeking behavior is the practice of manipulating systems to obtain more than one’s fair share of wealth—that is, finding ways to increase one’s own gains without actually increasing the productive value one contributes to an organization or to the economy.
10. We thank Steve Kaplan for sharing his CEO compensation series with us (Kaplan 2012b). The series on the income of the top 0.1% of households that Kaplan used is no longer available. Moreover, as we discuss, the appropriate comparison is to other earners, not to households, which could have multiple earners and shifts in the number of earners over time.
11. A one-point rise in the ratio is the equivalent of the average CEO earning an additional amount equal to that of the average earnings of someone in the top 0.1%.
12. This follows from the fact that from 1979 to 2020, annual earnings for the bottom 90% rose by 28.2%, while the average growth across all earners was 48.6% (Mishel and Kandra 2021). That means that the bottom 90% would have seen their earnings grow 20.4 percentage points more over the 1979–2020 period if they had enjoyed average growth (i.e., no increase in inequality, 48.6 less 28.2).
References
Baker, Dean, Josh Bivens, and Jessica Schieder. 2019. Reining in CEO Compensation and Curbing the Rise of Inequality. Economic Policy Institute, June 2019.
Bebchuk, Lucian, and Jesse Fried. 2004. Pay Without Performance: The Unfulfilled Promise of Executive Remuneration. Cambridge, Mass.: Harvard Univ. Press.
Bivens, Josh, and Lawrence Mishel. 2013. “The Pay of Corporate Executives and Financial Professionals as Evidence of Rents in Top 1 Percent Incomes.” Economic Policy Institute Working Paper no. 296, June 2013.
Bloomberg. 2018. “Where Have All the Public Companies Gone?” April 9, 2018.
Bureau of Economic Analysis (BEA). Various years. National Income and Product Accounts (NIPA) Tables [online data tables]. Tables 6.2C, 6.2D, 6.3C, and 6.3D.
Bureau of Labor Statistics (BLS). Various years. Employment, Hours, and Earnings—National [database]. In Current Employment Statistics [public data series].
Clifford, Steven. 2017. The CEO Pay Machine: How It Trashes America and How to Stop It. New York: Penguin Random House.
Compustat. Various years. ExecuComp [commercial database].
Economic Policy Institute (EPI). 2022. “The Productivity–Pay Gap.” Economic Policy Institute website, accessed August 29, 2022.
Federal Reserve Bank of St. Louis. Various years. Federal Reserve Economic Data (FRED) [database].
Gould, Elise. 2020. “The Labor Market Continues to Improve in 2019 as Women Surpass Men in Payroll Employment, but Wage Growth Slows.” Working Economics Blog (Economic Policy Institute), January 10, 2020.
Internal Revenue Service (IRS). 2019. “SOI Bulletin Historical Table 12: Number of Business Income Tax Returns, by Size of Business for Income Years, Tax Years 1990–2016, Expanded Version” (data table). Excel file downloadable at https://www.irs.gov/statistics/soi-tax-stats-historical-table-12.
Kaplan, Steven N. 2012a. “Executive Compensation and Corporate Governance in the US: Perceptions, Facts, and Challenges.” Martin Feldstein Lecture, National Bureau of Economic Research. Filmed July 10, 2012, in Washington, DC. Video, July 15, 2012.
Kaplan, Steven N. 2012b. “Executive Compensation and Corporate Governance in the US: Perceptions, Facts and Challenges.” National Bureau of Economic Research Working Paper no. 18395, September 2012.
Mishel, Lawrence, Josh Bivens, Elise Gould, and Heidi Shierholz. 2012. The State of Working America, 12th Edition. An Economic Policy Institute book. Ithaca, N.Y.: Cornell Univ. Press.
Mishel, Lawrence, and Jori Kandra. 2020. “Wages for the Top 1% Skyrocketed 160% Since 1979 While the Share of Wages for the Bottom 90% Shrunk.” Working Economics Blog (Economic Policy Institute), December 1, 2020.
Mishel, Lawrence, and Jori Kandra. 2021. “Preliminary Data Show CEO Pay Jumped Nearly 16% in 2020, While Average Worker Compensation Rose 1.8%.” Working Economics Blog (Economic Policy Institute), May 27, 2021.
Sabadish, Natalie, and Lawrence Mishel. 2013. “Methodology for Measuring CEO Compensation and the Ratio of CEO-to-Worker Compensation, 2012 Data Update.” Economic Policy Institute Working Paper no. 298, June 2013.
Securities and Exchange Commission (SEC). 2015. “SEC Adopts Rule for Pay Ratio Disclosure: Rule Implements Dodd-Frank Mandate While Providing Companies with Flexibility to Calculate Pay Ratio.” Press release no. 2015-160, August 5, 2015.