Ex-Obama economic adviser Romer says fiscal stimulus is central to combatting recessions
For all the wrong reasons, the term “fiscal stimulus” became a dirty word in the wake of the Great Recession. Policymakers need to work hard to counter that perception before the next downturn hits.
President Barack Obama’s $800 billion spending plan is often criticized as having been ineffective. In reality, the plan played a crucial role in stemming a deepening economic slump, and if it fell short, it was because the aggressive one-time boost ultimately proved too small to counter the magnitude of the shocks at hand.
The fiscal boost during the latest expansion has been extraordinarily weak: Average annual fiscal impulse over five business cycles
| Peak-to-peak | 3 years from trough | |
|---|---|---|
| 1960s | 0.817810% | 0.981295% |
| 1980s | 0.456157 | 0.532855 |
| 1990s | -0.107879 | 0.480713 |
| 2000s | 0.772504 | 1.156552 |
| 2010s | 0.393282 | 0.074817 |

Note: For each fiscal component (taxes, transfers, and government consumption and investment), the quarterly growth rate is multiplied by its share relative to overall GDP to get a quarterly contribution to growth. For taxes, this calculation is then multiplied by negative one—highlighting that tax cuts boost spending while tax increases slow spending. The figure shows these quarterly contributions expressed as annualized rates. Government consumption and investment spending is adjusted for inflation with the component-specific price deflator available in the NIPA data. For taxes and transfers, the price deflator for personal consumption expenditures (PCE) is used.
Source: EPI analysis of data from Tables 1.1.4, 2.1, 3.1, and 3.9.4 from the National Income and Product Accounts (NIPA) of the Bureau of Economic Analysis (BEA).
Speaking at EPI’s Next Recession event this past Thursday, Christina Romer, who was Chair of the Council of Economic Advisers during the crisis, asked “What made it possible to use fiscal policy so aggressively at that particular moment in time?”
Bonuses are up one cent in 2018 since the GOP tax cuts passed
Data from the Bureau of Labor Statistics’ Employer Costs for Employee Compensation gives us a chance to look at workers’ bonuses in 2017 and 2018, to gauge the impact of the GOP’s Tax Cuts and Jobs Act of 2017. Last year, our analysis showed that bonuses rose by $0.02 between December 2017 and September 2018 (all calculations in this analysis are inflation-adjusted). The new data show that bonuses actually fell $0.22 between December 2017 and December 2018 and the average bonus for 2018 was just $0.01 higher than in 2017.
This is not what the tax cutters promised, or bragged about soon after the tax bill passed. They claimed that their bill would raise the wages of rank-and-file workers, with congressional Republicans and members of the Trump administration promising raises of many thousands of dollars within ten years. The Trump administration’s chair of the Council of Economic Advisers argued last April that we were already seeing the positive wage impact of the tax cuts:
A flurry of corporate announcements provide further evidence of tax reform’s positive impact on wages. As of April 8, nearly 500 American employers have announced bonuses or pay increases, affecting more than 5.5 million American workers.
Following the bill’s passage, a number of corporations made conveniently-timed announcements that their workers would be getting raises or bonuses (some of which were in the works well before the tax cuts passed). But as EPI analysis has shown there are many reasons to be skeptical of the claim that the TCJA, particularly its corporate tax cuts, will produce significant wage gains.
Restraining the power of the rich with a 10 percent surtax on incomes over $2 million*
Excessive wealth and power commanded by a small group of multi-millionaires and billionaires pose an existential threat to America’s economic vitality, democracy and civil society.
It’s well-known by now that the richest 1 percent of American households have essentially doubled the share of national income they claim since the late 1970s. Less well-known is that inequality has even risen sharply within the top 1 percent, with the top 10 percent of that overall group—or the top 0.1 percent—accounting for half of all income within the top 1 percent.1 In 2016, the latest year of available data, households with adjusted gross income (AGI) of over $2 million made up just over 0.1 percent of tax filers, but accounted for 100 times as much (10 percent) of total AGI.
The political clout of this topmost sliver of households is likely even more outsized then their share of overall income. This group’s incomes overwhelmingly stem from owning financial assets, not working in labor markets.2 This means that they benefit from the preferential tax treatment given to income from wealth relative to income from work. The Trump tax cut at the end of 2017 was tailor-made for very rich, as its largest cuts accrue to business owners—both corporate and non-corporate business.3
Cleaning up administrative records or targeting immigrants?
The Trump administration recently began implementing a “no-match” policy of flagging administrative records that don’t match what the Social Security Administration (SSA) has on file.
If you’ve been following the news in Georgia, you might think this is a reference to a tactic used by Georgia Secretary of State Brian Kemp to purge minorities from the state’s voter rolls right before the gubernatorial election he narrowly won against his Democratic opponent, Stacey Abrams. Not exactly, but both are related—and have civil rights implications.
Voter suppression efforts in Georgia and elsewhere have used a range of strategies to purge voters, including striking those whose names loosely matched those of dead people and felons and those whose names didn’t exactly match SSA or drivers’ license records (so much for consistency). In a legal challenge, civil rights groups noted that an estimated 80 percent of voters affected by the “exact match” policy were African American, Latino, or Asian American.
Now the Trump administration is reviving a failed policy of sending letters to employers informing them of apparent discrepancies between employee W-2 forms and SSA records. In this case, the ostensible goal is checking tax forms, not voter registrations, but both efforts use SSA data as a validity check and both disproportionately impact immigrants and people of color.
Housing discrimination underpins the staggering wealth gap between blacks and whites
Wealth is a crucially important measure of economic health—it allows families to transfer income earned in the past to meet spending demands in the future, such as by building up savings to finance a child’s college education.
That’s why it’s so alarming to see that, today still, the median white American family has twelve times the wealth that their black counterparts have. And that only begins to tell the story of how deeply racism has defined American economic history.
Enter EPI Distinguished Fellow Richard Rothstein’s widely praised book, “The Color of Law,” which delves into the very tangible but underappreciated root of the problem: systemic, legalized housing discrimination over a period of three decades—starting in the 1940s—prevented black families from having a piece of the American Dream of homeownership.
Research is vital to the moral integrity of social movements
The faith community has a long history of involvement in social movements for economic justice, bringing into focus the moral failings of our political and economic systems. I’m always struck when people say to me, “But you’re talking about morality, and we’re talking about money.” I answer, “You really think they’re different? You don’t recognize that a budget is a moral document? That policies are about moral decisions? That morality is not just about inspiration but about information?”
I realize that for some, the concept of a preacher writing for an economics blog might seem odd, but the link between what I do—as a pastor, architect of the Moral Monday movement and co-leader of The Poor People’s Campaign—and the research done by EPI is absolutely vital. One of the quickest ways for a movement to lose its integrity is to be loud and wrong. We’ve seen too many movements that have bumper sticker sayings but no stats and no depth. Researchers help to protect the moral integrity of a movement by providing sound analysis of the facts and issues at hand. Armed with this information, we’re able to pull back the cover and force society to see the hurt and the harm of the decisions that people are making.
In fact, I believe we find evidence of a relationship between religion, activism, and research that dates back to the prophets of the Bible. The prophets of the Bible were the social activists of their time. I say that because the only time prophets in ancient Israel rose to the fore was when the kings or the politicians and their court chaplains weren’t doing their job.
Progressive tax reform requires a healthy IRS
Internal Revenue Service (IRS) funding was in the news at the end of last year, after a series of articles by ProPublica detailed just how badly its resources had been gutted by cuts enacted by the Republican-controlled Congress. And the IRS remains in the news with ongoing pressure to release President Trump’s tax returns. Complaining about the IRS is a popular pastime for lots of Americans, and we would certainly agree that in recent years the IRS has spent too much time auditing low-income households—a recent ProPublica story notes, “the IRS audits Earned Income Tax Credit (EITC) recipients at higher rates than all but the richest Americans.” But the IRS needs mended not ended, with a large infusion of resources as well as a reorientation of its enforcement priorities. The reason for not giving up on having a functional IRS is simple: if we want a country where rich people and powerful corporations pay their fair share, we will need a higher-functioning IRS, and we should be willing to pay for it. The chart below shows the substantial budget and employment cuts at the IRS since 1994. IRS operating costs (in 2017 dollars) have declined 29 percent between 1994 and 2017 as a share of total returns filed. And those budget cuts have real consequences for IRS staffing; full time equivalent employees as a share of total returns filed has fallen by 42 percent since 1994.
IRS funding and employment have been cut drastically: IRS operating costs (in 2017 dollars) and average positions realized as a share of total returns, 1994–2017
| Average positions realized | Operating costs | |
|---|---|---|
| 1994 | 0.054% | 6.631% |
| 1995 | 0.054% | 6.528% |
| 1996 | 0.051% | 6.097% |
| 1997 | 0.047% | 5.624% |
| 1998 | 0.044% | 5.455% |
| 1999 | 0.044% | 5.662% |
| 2000 | 0.043% | 5.328% |
| 2001 | 0.043% | 5.452% |
| 2002 | 0.044% | 5.519% |
| 2003 | 0.044% | 5.679% |
| 2004 | 0.043% | 5.627% |
| 2005 | 0.042% | 5.722% |
| 2006 | 0.040% | 5.629% |
| 2007 | 0.039% | 5.395% |
| 2008 | 0.036% | 5.295% |
| 2009 | 0.039% | 5.903% |
| 2010 | 0.041% | 6.326% |
| 2011 | 0.040% | 6.080% |
| 2012 | 0.038% | 5.781% |
| 2013 | 0.036% | 5.422% |
| 2014 | 0.035% | 5.293% |
| 2015 | 0.033% | 4.939% |
| 2016 | 0.032% | 4.916% |
| 2017 | 0.031% | 4.697% |
Source: EPI analysis of data from table 2.3.3 from the National Income and Product Accounts (NIPA) from the Bureau of Economic Analysis (BEA) and IRS data books, 1995–2017
Since 2011, GAO found that the shrinking IRS workforce has come largely in enforcement, leading to agency officials telling GAO that declining staff was a key contributor to scaled back enforcement activities. Shrinking IRS enforcement is a boon largely for rich individuals and corporations, who have far greater opportunities to dodge taxes through creative accounting.
The IRS has not always been so hamstrung. A too-brief spell of increased budget and staff capacity from around 2008 to 2011 led to about a threefold increase in audit rates on households making over $1 million, while audit rates overall increased by just 11 percent, as did audit rates for EITC recipients making under $25,000. Overall audit rates for EITC recipients increased by just 4 percent. In short, when resources were adequate, the IRS (properly) focused its enforcement gaze where the money was.
Congress and Trump discover bipartisanship on immigration—but only to increase H-2B visas for captive and underpaid migrant workers
Instead of taking action together to enact legislation that would provide a path to citizenship for the unauthorized immigrants who are in danger of losing their immigration protections and work authorization as a result of President Trump’s efforts to end Deferred Action for Childhood Arrivals (DACA) and Temporary Protected Status, Congress and the Trump administration have collaborated to increase in the size of the main temporary work visa program that U.S. employers use to fill low-wage non-agricultural jobs: the H-2B visa.
This year, employers and corporate lobbyists claimed—as they do every year—that 66,000 low-wage work visas were not enough to fulfill their demand for cheap, captive labor in the landscaping, construction, forestry, seafood, meat processing, traveling carnival, and hospitality industries. Members of Congress acquiesced to their demands by inserting language into the appropriations legislation that is now funding the government during fiscal year 2019, that gave the Department of Homeland Security (DHS) the authority to temporarily increase the annual limit of 66,000 visas by up to 63,500 additional visas. DHS ultimately decided last week to increase the H-2B annual limit by 30,000 visas, taking the total H-2B “cap” for 2019 to 96,000.
Migrant workers make important contributions to the U.S. economy, and it should go without saying that they deserve equal rights, fair pay, protections from retaliation, and a path to permanent residence and citizenship. Sadly, the H-2B program does not meet any of these standards. Instead, the H-2B program—like other U.S. temporary work visas programs—empowers employers to legally exert an unusual amount of control over migrant workers, who often arrive indebted to the labor recruiters who connect them to jobs in the United States. H-2B workers are in effect, captive, because their visa status is controlled by their employer—which means that if an H-2B worker isn’t paid the wage he or she was promised, or is forced to work in an unsafe workplace—the worker has little incentive to speak up or complain to the authorities. Complaining can result in getting fired, which leads to becoming undocumented and possibly deported. It also means not being able to earn back the money that was invested in order to get the job.
These problems, which are inherent in the H-2B program, are well-documented. There are numerous cases of litigation, media reports, government audits, and studies revealing how migrants employed through the H-2B program arrive in the United States with massive debt, are often exploited and robbed by employers, and even become victims of human trafficking. While these most-egregious examples are clear legal violations, much of the abuse and discrimination in the H-2B program is perfectly legal. First, employers control the workers’ immigration status. And second, employers have been allowed to underpay H-2B workers for years thanks to the way the H-2B wage rules work, which have included policy changes made through appropriations riders that have weakened the already-inadequate wage rules and de-funded enforcement. Since U.S. workers are forced to compete with vulnerable and underpaid H-2B workers, wages and working conditions for all workers in major H-2B occupations are degraded. As a result, there’s no question that the H-2B program needs major reforms to protect both migrant and American workers.
Table 1 below illustrates how the H-2B program allows employers to undercut U.S. wage standards. Table 1 shows the top 20 H-2B occupations in fiscal2017 by Standard Occupational Classification code, according to H-2B jobs certified by the U.S. Department of Labor (DOL), and the nationwide average hourly wage for all certified H-2B workers in each of the occupations. The 2017 average hourly wage rates for all workers in the occupation nationwide, according to the DOL’s Occupational Employment Statistics (OES) survey—which is used to set H-2B wage rates, making it an apples-to-apples comparison—is listed next to the H-2B wage. The final column shows the difference between the average hourly certified H-2B wage and the average hourly OES wage for the entire country; this is what employers save, on average, by hiring an H-2B worker instead of a worker who is paid the national average wage for the occupation.Read more
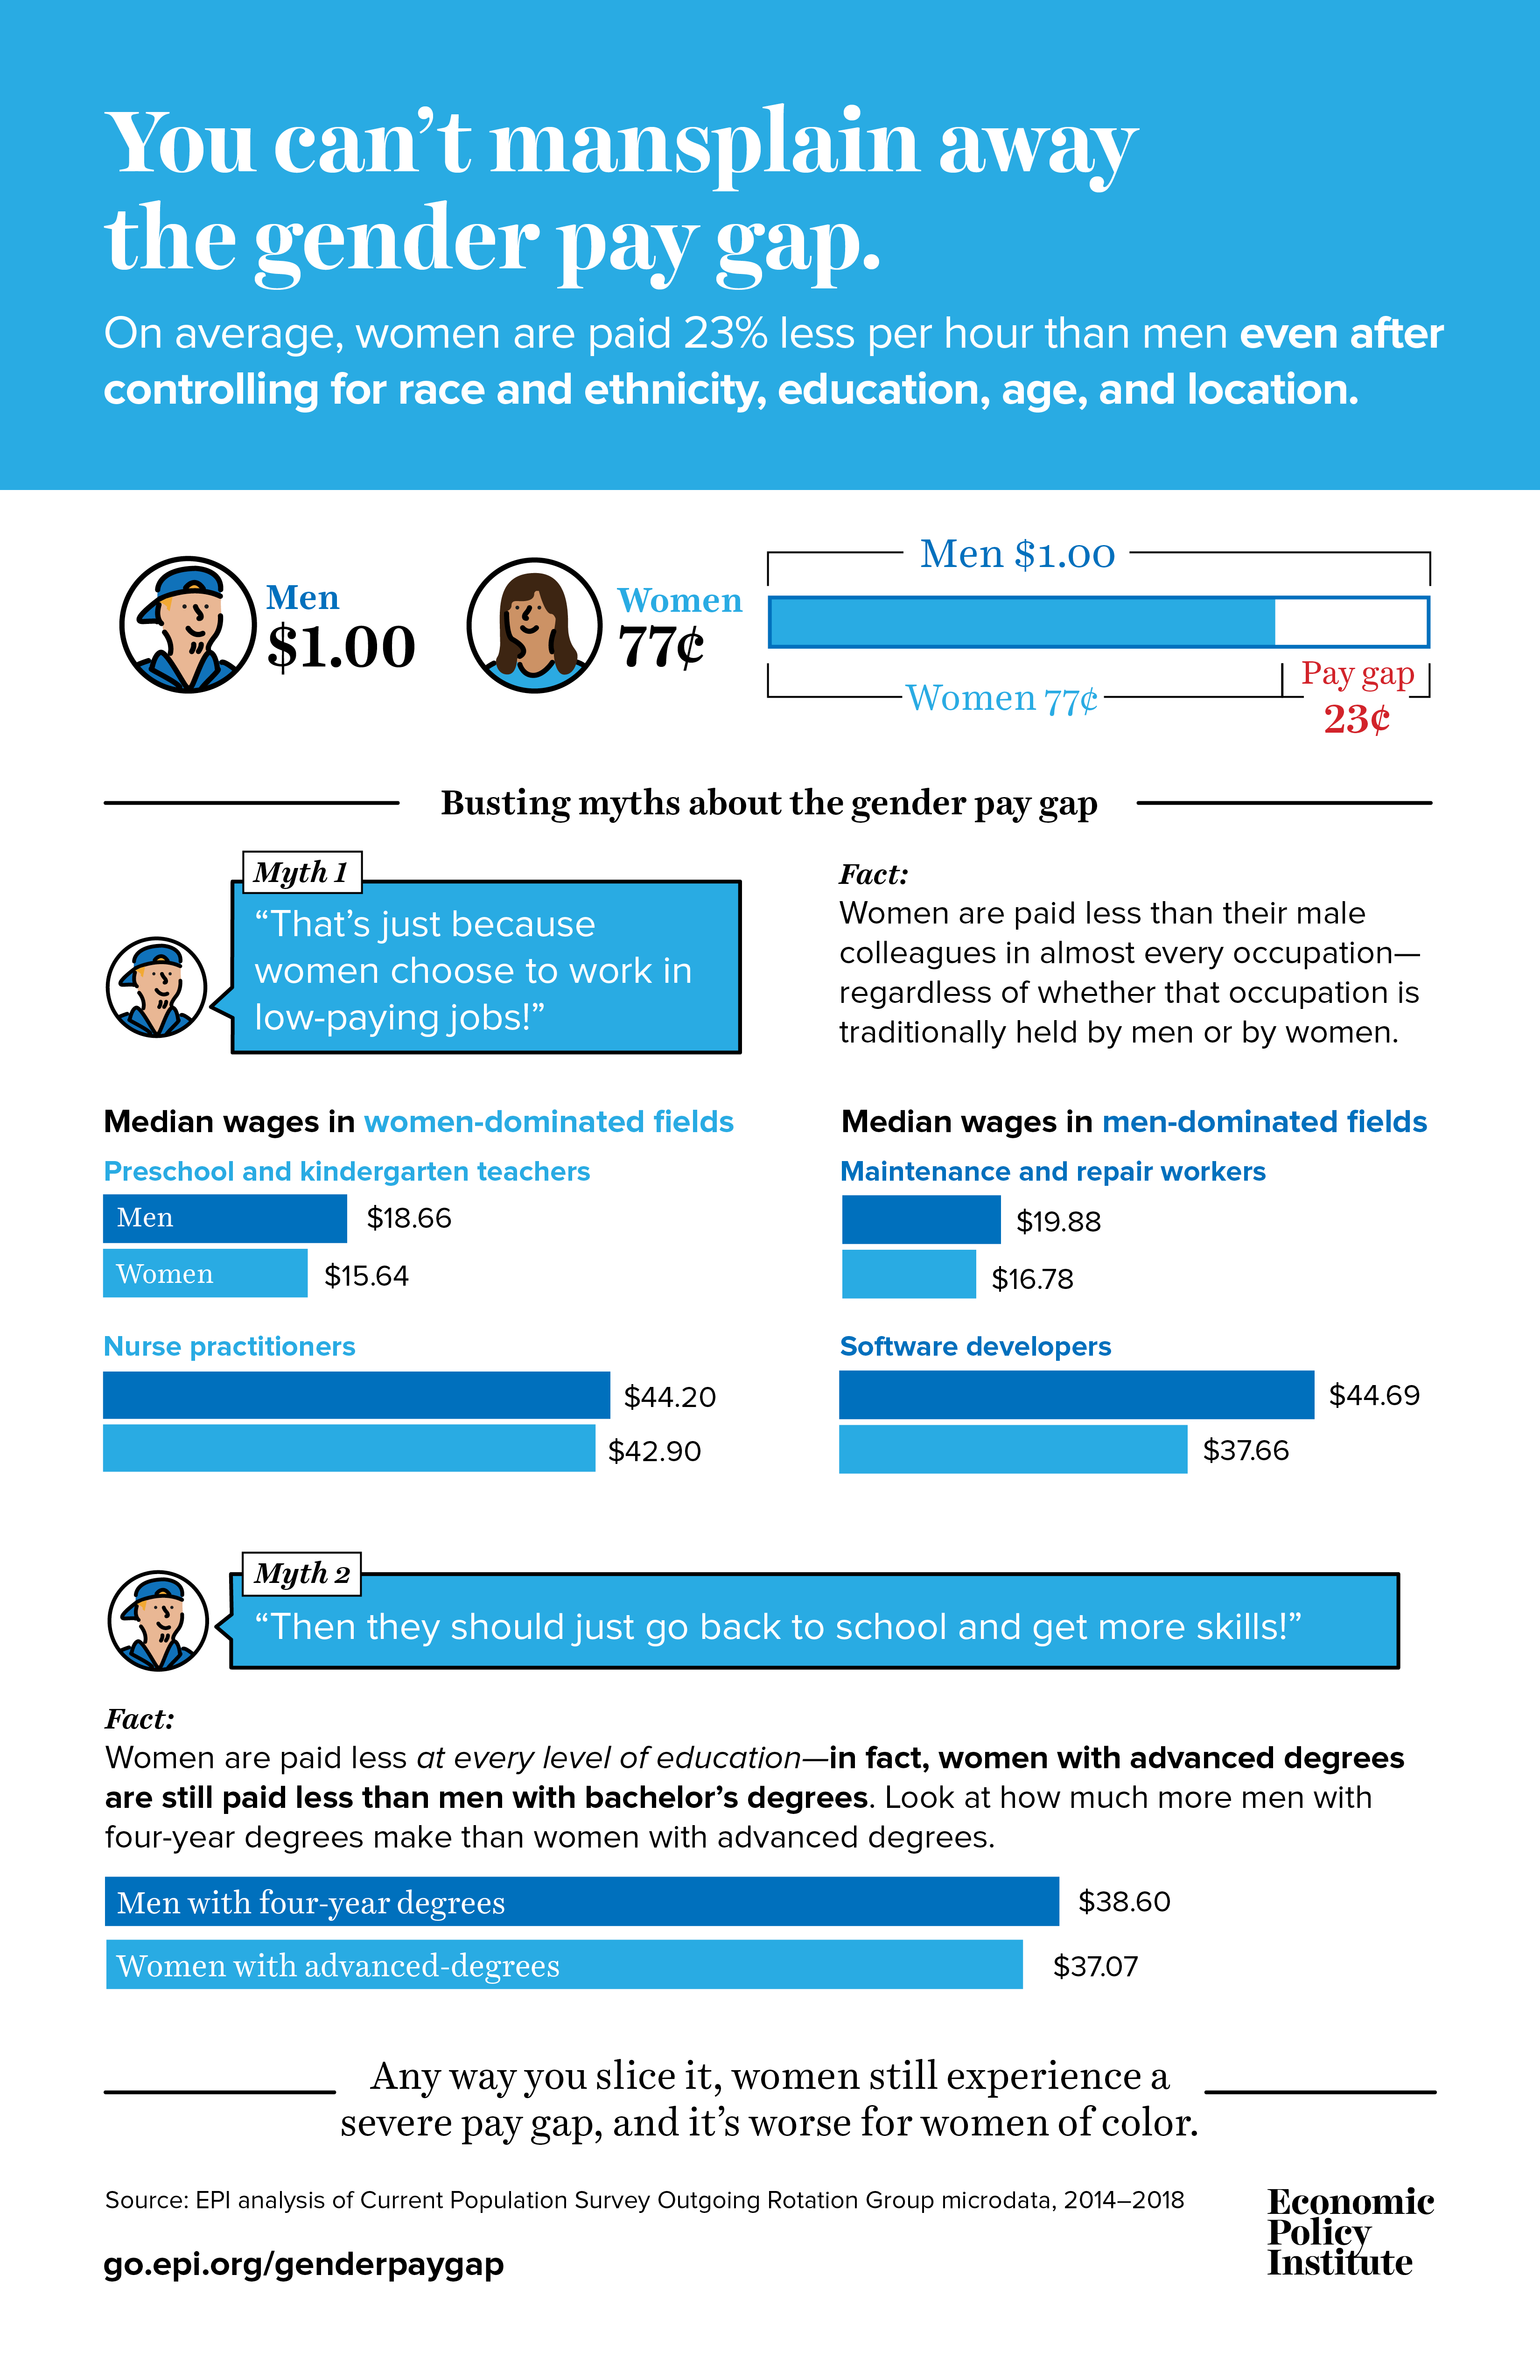
Equal Pay Day is a reminder that you can’t mansplain away the gender pay gap
April 2nd is Equal Pay Day, a reminder that there is still a significant pay gap between men and women in our country. The date represents how far into 2019 women would have to work to be paid the same amount that men were paid in 2018. On average in 2018, women were paid 22.6 percent less than men, after controlling for race and ethnicity, education, age, and geographic division.
Even after extensive research has been done to show the gender pay gap exists (and persists), some skeptics refuse to believe the data. This infographic shows some of the most common criticisms of the gender wage gap and rebuts the “mansplainers” with data.
The House makes way for equal pay with the passage of Paycheck Fairness Act
Yesterday, the House of Representatives took an important step toward ending gender-based pay discrimination by passing the Paycheck Fairness Act. The legislation, introduced by Rep. Rosa DeLauro (D-Conn.), would strengthen the Equal Pay Act of 1963 and guarantee that women can challenge pay discrimination and hold their employers accountable. The legislation specifically requires employers to prove that pay disparities are based on factors other than sex; protects employees against retaliation for discussing salaries with colleagues; prohibits employers from seeking the salary history of prospective employees; removes obstacles in the Equal Pay Act of 1963 to allow workers to participate in class action lawsuits that challenge systematic pay discrimination; creates a negotiations and skills training program for women and girls; and improves the Department of Labor’s tools to enforce the Equal Pay Act of 1963.
Over fifty years ago, the Equal Pay Act of 1963 was enacted to prohibit pay discrimination on the basis of sex by requiring employers to pay women and men equally for equal work. Since the passage of the Equal Pay Act of 1963, millions of women have joined the workforce. However, more than five decades later, women are still earning less than their male counterparts. On average in 2018, women were paid 22.6 percent less than men, after controlling for race and ethnicity, education, age, and location. This gap is even larger for women of color with black and Hispanic women being paid 34.9 and 34.3 percent less per hour than white men, respectively—even after controlling for education, age, and location. Any way you slice it, women experience a gender pay gap.
There are many policies that can reduce gender pay gaps including raising the minimum wage, strengthening collective bargaining rights, and providing paid family and sick leave, among others. The passage of the Paycheck Fairness Act in the House is just one step toward reducing these gender pay gaps and guaranteeing women receive equal pay for equal work.