The Supreme Court is poised to make forced arbitration nearly inescapable
The Supreme Court will soon decide whether employers can lawfully require workers to sign mandatory arbitration agreements that include class and collective action waivers. A ruling in NLRB v. Murphy Oil USA, Inc., Epic Systems Corp. v. Lewis, and Ernst & Young LLP v. Morris will have significant impacts on working people. If the Court sides with employers and the Trump administration, it is likely that the majority of workers in this country will be required, as a condition of employment, to sign away their right to pursue workplace disputes on a collective or class basis. In fact, available data suggest that it may take only six years for more than 80 percent of workplaces to adopt mandatory arbitration with class and collective action waivers.
Last year, EPI commissioned a survey that found that 53.9 percent of nonunion private-sector employers already have mandatory arbitration procedures. Prior to that study, the one major governmental effort to investigate the extent of mandatory arbitration was a 1995 GAO survey. That survey, conducted between April 1994 and April 1995, found that just 7.6 percent of employers had mandatory arbitration agreements. In other words, the use of mandatory arbitration agreements grew by more than 600 percent between 1994 and 2017. Using the growth rates between the two surveys to forecast future expansion suggests that by 2024, more than 80 percent of private sector, non-union establishments will adopt mandatory arbitration with class and collective action waiver of employment disputes, if the Court finds that such agreements are lawful.1 That will leave more than 85 million workers subject to mandatory arbitration agreements with class and collective action waivers. This means that the vast majority of workers will be forced to sign away their right to act with their colleagues to resolve workplace disputes—as well as their right to go to court for these matters. As a result, even if many workers face the same type of issue at work, each individual worker will be forced to hire their own lawyer, and resolve their dispute out of court, behind closed doors, with only their employer and a private arbitrator.
What to Watch on Jobs Day: Stronger wage growth as labor market slack continues to decline
While payroll employment growth was particularly weak in March, over the longer-term employment growth has been more than enough to keep up with growth in the working age population and even pull additional people off the sidelines and into the labor market. Labor force participation still has a way to go to reach full employment levels, but the trend continues to move in the right direction. And, make no mistake, we’ve never thought these displaced workers would be sitting on the sidelines forever. In fact, we’ve been expecting the workers to return to the labor force for years.
As those sidelined workers start dwindling in numbers, we should expect stronger and stronger wage growth. Continued slow wage growth tells us that employers still hold most of the cards, and don’t have to offer higher wages to attract workers. In other words, workers have very little leverage to bid up their wages. Therefore, wage growth remains one of the most important indicators to watch in Friday’s jobs report. The fact that nominal wage growth is still below target levels is a clear sign that the economy has yet to clearly reach full employment.
Alas, nominal wage growth for private-sector workers and even nominal wage growth for production/nonsupervisory workers offers only a limited view on wage growth in the economy today. One of the major benefits of a full employment economy is that wage growth isn’t simply strong for workers at the top of the wage distribution or for workers with more educational attainment. Younger workers, black workers, workers with lower levels of educational attainment, and workers at the middle and bottom of the wage distribution are disproportionately boosted in a stronger economy just as they are disproportionately harmed in a weaker one. Research has shown that for each percentage point decline in the unemployment rate, there is stronger wage growth in the lower part of the wage distribution than in the higher part (in particular, see Figure F here). Similarly, black workers saw disproportionately stronger opportunities for employment and wage growth in the latter part of the 1990s recovery than white workers did. Workers whose prospects fall farther in recessions see these prospects grow faster when times are good.
Let’s fight for working people on Workers’ Memorial Day
April 28 is Workers’ Memorial Day, an international remembrance day set aside to “mourn for the dead, and fight like hell for the living,” in the words of the immortal labor organizer Mother Jones.
In 2016, nearly 5,200 workers were killed on the job in the United States—14 workers every day—the highest number of workplace deaths in years. But that is only a part of the deadly toll: each year, more than 50,000 workers die from work-related disease. With this awful trend, any rational government would be proposing a significant increase in the budgets of our worker protection agencies and a rapid expansion of regulatory protections for workers.
Unless you’re just waking up from a 15-month nap, you know that workers’ rights—and especially worker safety and health—are under attack by the Trump administration like never before. And not only are workers under attack in their workplaces, but thanks to actions by the Environmental Protection Agency (EPA), the Interior Department, the Department of Agriculture and others, they’re also under attack where they live, where they eat, and where they vacation.
But these attacks didn’t originate in the fevered dreams of Donald Trump. What we’re seeing is the attempted wholesale implementation of the long-standing wish list of the conservative anti-worker Republicans, the Chamber of Commerce, and its anti-worker corporate allies.
And the attacks are not just aimed at the Occupational Safety and Health Administration (OSHA), but at a variety of other agencies— and even the scientific process underlying the ability of government agencies to legally protect workers from getting injured, killed, or sickened in the workplace.
It would take a long time to detail every attack on worker safety and the safety of the communities they live in, but I’ll list just a few here:
One of Donald Trump’s first actions as president was to issue an executive order requiring agencies to repeal two protections for every new one issued.
Eliminating the forced transfer of technology and production to China is critical
Late last month, the Office of the United States Trade Representative (USTR) issued its “Findings on the Investigation Into China’s Acts, Policies, and Practices Related to Technology Transfers, Intellectual Property, and Innovation Under Section 301 of the Trade Act of 1974”. The report re-confirmed previous findings concerning China’s reliance on forced transfer of technology and production from U.S. aerospace companies in return for market access. Just this week, USTR released its list of proposed tariffs on Chinese products.
While the findings of the report and the proposed tariff list represent steps forward in addressing this critical matter, findings and proposed lists alone won’t stop China from engaging in this unfair trade practice. The Trump administration should move quickly to implement a comprehensive strategy which includes:
- Placing tariffs on Chinese aerospace parts, components, and subassemblies that cost U.S. jobs;
- Filing a complaint (preferably joined by the European Union) at the World Trade Organization (WTO) against China’s unfair trade practices regarding forced transfers and subsidies to its aerospace industry; and,
- Making the elimination of forced transfers of technology and production a priority in bilateral and multilateral dialogues, including discussions over the U.S.-EU Transatlantic Trade and Investment Partnership (T-TIP).
Transfers of production and technology from U.S. aerospace and related companies are a serious matter. Among other things, they cost U.S. aerospace jobs and lead to a further decline in our aerospace industrial base in at least four different but related ways: First, jobs that may be associated with the transfer of technology and production are lost; second, the skills that accompany the transfers are lost leading to a further decline in our industrial base; third, future jobs are lost as China (and other countries) utilizes the transfer from the United States to create and strengthen their own aerospace companies that compete directly with U.S. companies; and fourth, the technology and production that would have led to more U.S. jobs through the development of innovative products is lost.
While China continues to utilize every tool available to establish a strong aerospace industry, up until now, the United States has done little to stop China from forcing the transfer of technology and manufacturing to develop its own industry. Far from implementing any strategic policy to stem this transfer, the U.S. government has largely left it up to U.S. aerospace companies to either comply with China’s forced transfer demands, or be shut out of China’s market. While the precise details of these transactions are not public, numerous reports shed light on how China plays the world’s two large commercial aircraft producers, Boeing and Airbus, against one another.
Social Security is looking like a pretty good investment these days
In 2005, President George W. Bush attempted to partially privatize Social Security. He centered his argument for this change on the claim that people would fare better investing in asset markets than contributing to Social Security. The privatization push proved highly unpopular, as research from EPI and others highlighted the high transition costs and investment risks.
Nevertheless, the belief that Social Security amounts to a low-risk but low-return investment persists, hampering proposals to expand the popular program. This is unfortunate, as Social Security looks better than ever in comparison to low-performing 401(k)s and IRAs.
As shown below, a young worker today with average career earnings will receive Social Security retirement benefits equivalent to total employer and employee retirement contributions plus a 5.7 percent annual rate of return. This “internal rate of return” is not much lower than the 7.0 percent net return for 401(k)-style defined contribution plans between 1990 and 2012, and it’s higher than more recent returns for these plans and IRAs (3.1 percent and 2.2 percent, respectively, over the 2000–2012 period).
Social Security internal rate of return, medium earner aged 21 in 2018 with average life expectancy at retirement (retirement benefits only)
| Medium Earner | |
|---|---|
| Based on Current Contribution Rate | 5.7% |
| Based on Contribution Rate after Eliminating Shortfall | 5.0% |
| Based on Full Cost Rate | 4.5% |

Source: Author's calculations based on inflation, average wage, and cohort life expectancy projections in single-year tables underlying the 2017 Social Security Trustees Report; and the "medium earner" in Michael Clingman and Kyle Burkhalter, "Scaled Factors for Hypothetical Earnings Examples Under the 2017 Trustees Report Assumptions," Social Security Administration Actuarial Note, July 2017. Assumes retirement at normal retirement age (67).
This calculation doesn’t take Social Security’s projected long-term shortfall into account. But even if we closed the shortfall by raising the contribution rate from 10.0 percent to 12.6 percent (excluding contributions going toward disability benefits), the internal rate of return for a medium earner would be 5.0 percent.
Though Social Security is primarily funded through worker contributions, a small share of the cost is paid for by taxes on the benefits of better-off retirees that revert to the program. If these taxes on high earners were eliminated so that the entire cost of retirement benefits were funded by worker contributions, the internal rate of return for a medium earner would be a healthy 4.5 percent, still an excellent return for such a low-risk investment.
Rates of return on 401(k)-style plans vary widely and are subject to market downturns. To reduce the risk of worse outcomes, most investors, especially retirement savers, would choose a secure 5 percent return over a volatile return averaging 7 percent, since, contrary to popular belief, investment risk doesn’t disappear over long time horizons.
The SEC’s “Regulation Best Interest” is in the best interest of Wall Street, not retirement savers and other investors
On Wednesday, the Securities and Exchange Commission (SEC) issued over 1,000 pages of proposed regulations relating to the conduct of financial professionals. Among other things, the proposals specify that brokers must act in the best interest of clients, limit the use of terms like “financial adviser,” and require financial professionals to provide clients with short descriptions of their legal obligations to the client and of their compensation structure.
At first blush, these appear to be positive, albeit incremental, steps. In fact, their purpose is not to protect investors, but to present an alternative to the much stronger protections in a Department of Labor (DOL) rule that requires financial professional offering investment advice to retirement savers to adhere to a fiduciary standard. While the DOL rule remains in place for the time being, the Trump administration has delayed its full implementation and enforcement, and it has been challenged in court by financial industry players. EPI has estimated that these delays will cost investors $18.5 billion in higher fees and lower net returns over the next 30 years.
The SEC’s proposed “best interest” standard, which to unsuspecting investors may sound similar to the DOL’s fiduciary standard, is in fact much weaker. Though it would prohibit brokers and other financial professionals from steering clients toward clearly unsuitable investments, financial professionals are already prohibited from doing so under current rules. While these rules prevent brokers from—say—recommending highly risky investments to risk-averse clients, they don’t prevent them from promoting higher-cost but “suitable” investments when similar lower-cost investments are available.
The SEC proposals, unlike the DOL rule, do not prohibit commissions and other forms of compensation that create conflicts of interest between financial professionals offering advice and their clients. Though some egregious practices may be curbed, the practical impact of the SEC proposals is unclear because the Commission does not define “best interest.” If anything, dissenting Commissioner Kara Stein says the proposed regulations appear designed to provide financial professionals with guidelines on how to adhere to the letter of the law with written disclosures, policies, and procedures—but no meaningful changes to actual practices. Moreover, enforcement is likely to be weak, because investors would not be able to sue brokers for violating the “best interest” standard, but would only have recourse to private arbitration under the auspices of the Financial Industry Regulatory Authority (FINRA), an industry-funded body. As Commissioner Stein put it, a better name for these proposals is “Regulation Status Quo.”
Teacher unions and students’ long-term economic prospects
A recent academic paper by economists Michael Lovenheim and Alexander Willén argues that men who lived as school-age children in states where teachers were allowed to bargain collectively are less likely to work as adults and, when they do work, they earn significantly less than men who grew up in states where teachers were not allowed to bargain collectively.
There are at least three reasons to be deeply skeptical of their findings.
First, the chain of causal links is extremely circuitous. The reasoning runs from a student’s initial potential “exposure” to teachers’ right to collective bargaining all the way through to the conclusion that this “exposure” significantly worsened labor market outcomes decades later as an adult. In most of their analysis, the authors rely on data that let them know the state where a person was born and the employment situation of that same person in a single year between the ages of 35 and 49. The researchers use this information to construct a simulated educational history for each adult, where they assume that the person attended K-12 school in the state where they were born. The researchers, however, don’t actually know that an individual lived in the state of birth while at school age, or whether the school the individual attended was unionized, or even whether the individual attended a public or private school. Instead, the paper’s conclusions hinge on the idea that students born in states with collective bargaining for teachers were more likely to be “treated” by collective bargaining than students in “control” states where teacher collective bargaining was not permitted. This is possible, of course, but the methodology leaves substantial room for other factors that might explain the observed differences in labor market outcomes of adults who were born in different states. The states that denied teachers the right to bargain collectively, for example, include 11 southern states, which have many long-term trends in common other than collective bargaining rights, including industry and age structure, income distribution, climate, and rapid population growth.
The Trump administration doubles down in the Wall Street Journal on why trickle-down really does work
Kevin Hassett, the chair of the Trump administration’s Council of Economic Advisers (CEA), wrote an op-ed in the Wall Street Journal this week mounting a defense of the Tax Cuts and Jobs Act (TCJA)—the tax cut passed by congressional Republicans and signed into law by the president at the end of last year. It starts out badly, railing against “leftists from Marx to Piketty (?!)” and doesn’t get much better from there.
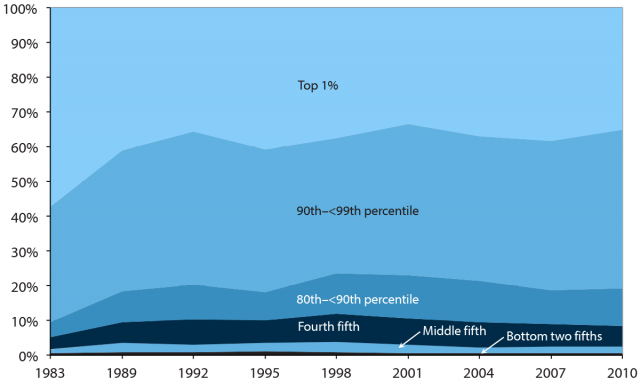
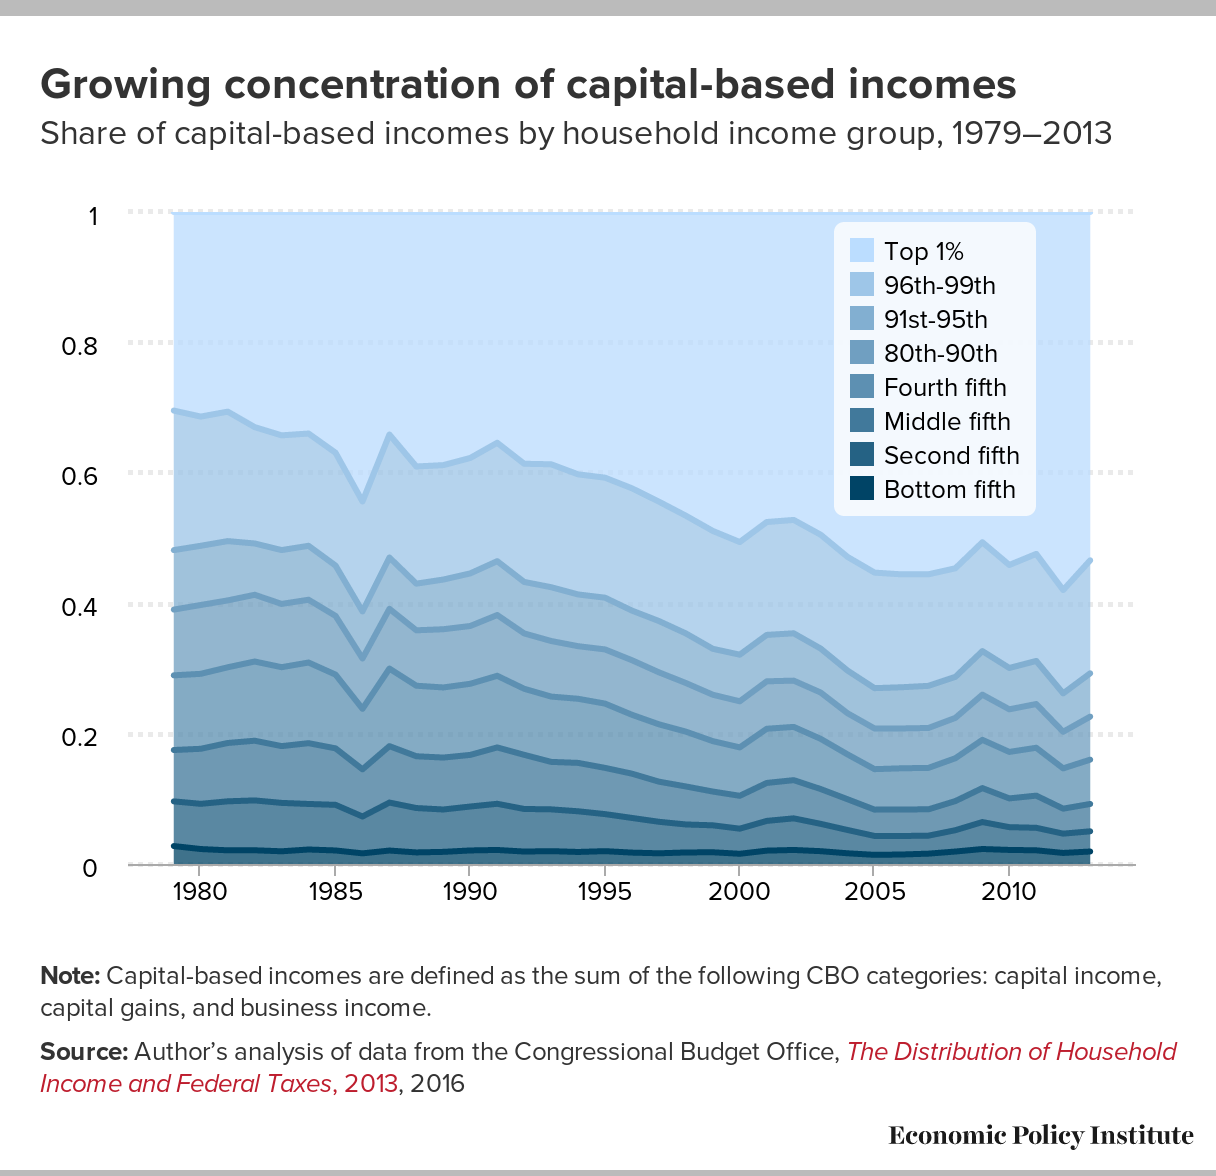
It is an objective fact that the cut’s direct benefits are extraordinarily regressive, with 83 percent of these benefits going to the top 1 percent of households when it’s fully phased-in. Most of this regressivity is due to the very large cut in corporate taxes enacted as part of the TCJA. Ownership of corporations, and capital assets generally, is extremely concentrated in richer households, so, the direct effect of cutting taxes on capital is to funnel money to the top.
But Hasset insists indirect effects will trickle down to benefit the rest of us. His operating theory is almost quaint in how antiquated it is: “…workers do well when their employers do.” This leads him to claim that “when profits go up, capital investment goes up, and wages follow.”
For Tax Day, a reminder that economic arguments for the GOP tax plan have no theoretical basis
On Tax Day, Republicans in Congress will surely be trying to tout the benefits from the Tax Cuts and Jobs Act (TCJA) that they passed in December. It’s still far too early to make big claims about what the data shows about the effect of the TCJA, but it’s worth remembering why we should be very doubtful that any benefits at all will accrue to typical American families from the largest— and only permanent—feature of the TCJA, the cuts in corporate income tax rates.
The TCJA’s likely effect on the economy depends on whether the economy remains demand-constrained or not. Below, we’ll lay out why the TCJA is bad policy regardless of whether or not today’s economy remains demand-constrained.
When the economy is demand-constrained, there is not enough overall spending in the economy—or “aggregate demand”—to pin the economy at full employment. If the economy still suffers from a lack of aggregate demand, as we believe is likely the case, then tax cuts can boost demand—and thereby employment—by increasing the post-tax income of households and businesses.
The TCJA is generally not defended on the grounds that it will boost demand. The reason why is clear: the tax cuts that make up the bulk of the TCJA—tax cuts for the rich and big corporations—are by far the weakest fiscal stimulus to aggregate demand. High-income households are more likely to save the money they receive from a tax cut than low- and moderate-income households. This means that much of the TCJA will end up as savings in the pockets of rich households rather than a boost to aggregate demand. Corporate tax cuts don’t rate any better on this core, for the same reasons. In the short run, the benefits of corporate tax cuts flow to shareholders. The top 1 percent owns 40 percent of total stocks. In short, corporate rate cuts are simply tax cuts for the rich by another name. Tax cuts for low- and middle-income households would have provided about three times as much bang for the buck as the TCJAs tax cuts for the rich and big corporations, as would have increases to income support programs or infrastructure spending.
All of this is why defense of the TCJA (and tax cuts for rich people generally) assume the economy is not demand-constrained and is already at full employment. In this case, the claim is that cuts to the corporate rate give companies higher after-tax profits with which they can pay dividends to shareholders. This increases corporations’ incentive to undertake investment in new plant and equipment. And because the increase in the post-tax return to capital owners’ savings induces households to save more (or attracts more savings from abroad), these desired new investments can be financed without being choked off by rising interest rates. The resulting increase in capital investment gives workers more and better tools to work with, which boosts labor productivity and eventually wages.
How do our job creation recommendations stack up against a job guarantee?
A discussion broke out on Twitter last week about a recent paper I wrote on what role the government can and should play in creating jobs. The discussion centered on how this paper overlaps with and is different from a job guarantee proposal detailed in a series of papers by William Darity and Darrick Hamilton (often co-authored with Mark Paul, with others, particularly Pavlina Tcherneva, contributing analyses of job guarantees in recent years). Twitter is a tough place to have a substantive discussion, particularly one in which you’re disagreeing with people you have a lot of respect for, so I’ve decided to spend more than 280 characters on this. Because the contrast on Twitter was between our recommendations and the Darity and Hamilton proposals, I’ll focus on their framework in what follows.
Areas of overlap between our job creation recommendations and a job guarantee
Darity, Hamilton, and Paul’s latest job guarantee proposal was released last month by the Center on Budget and Policy Priorities. The best summary statement of it comes from their own paper: “The federal job guarantee would provide a job, at non-poverty wages, for all citizens above the age of 18 that sought one.” While job creation is the key goal of their proposal, their plan also hinges on these jobs producing goods and services that private markets are not producing—especially public investments. They identify two key benefits of the job guarantee as:
Macroeconomic stabilization. The job guarantee would function as a robust automatic stabilizer in the economy, maintaining levels of employment during economic downturns through direct hiring, and freely allowing workers to flow from the jobs program to the private sector during economic boom times.
The provision of socially useful goods and services. During the Great Depression, the Works Progress Administration (WPA) and Civilian Conservation Corps (CCC) were public employment programs designed to put Americans back to work…. These programs, implemented under the Roosevelt administration, provided goods and services that benefited all Americans by facilitating the logistics and technological expansion of our public infrastructure…..Under a job guarantee, even those who do not receive employment via the NIEC will likely benefit through the increased provision of public goods and socially desirable goods and services.