Six reasons not to put too much weight on the new study of Seattle’s minimum wage
Seattle’s minimum wage increases are one of the most important local policy developments in recent years, but the new study by University of Washington researchers Jardim et al. (2018) is largely uninformative about the effects of the policy because it uses the same flawed methodology that economists criticized in connection with earlier studies by the group. But, even if you believe the results of the new study, a careful reading of its actual findings shows the minimum wage benefited all of the city’s low-wage workers who had jobs prior to the increase.
1. The new study is based on a flawed comparison between Seattle and other areas in Washington state. The comparison causes the study to measure a reduction in the number of new jobs under $15/hour, when in fact this is not a cause for concern.
By comparing workers in Seattle with workers elsewhere in Washington state, the study incorrectly assumes that the low-wage labor market in Seattle would have grown like other areas in Washington, were it not for the city’s 2015-2016 minimum wage increases. This comparison is unreasonable because, as other researchers have demonstrated (Dube 2017, Rothstein and Schanzenbach 2017, Zipperer and Schmitt 2017), Seattle experienced much faster wage gains for reasons that had nothing to do with the minimum wage. Indeed, the authors of the new study find that Seattle had faster wage growth and diverged from other regions prior to the city’s minimum wage increases (see their Table 8 for the 2012-2013 period).
The flawed comparison underlying the study causes it to mistakenly attribute negative employment changes to the minimum wage, when in reality Seattle’s economic boom simply meant that low-wage jobs were converted into higher-wage jobs. For example, the authors document a decline in newly employed workers earning less than $15/hour and argue that the minimum wage is causing “losses in employment opportunities.” Instead, as jobs in Seattle’s tightening labor market were upgraded from lower-wage to higher-wage jobs, there was a mechanical decline in the number of new entrants under any given low-wage threshold. The purported decline in new entrants is not a cause for concern. The fast wage growth in Seattle relative to comparison regions prevents the study from making credible claims about the consequences of the city’s minimum wage increases in 2015 and 2016.
Top 1.0 percent reaches highest wages ever—up 157 percent since 1979
Newly available wage data for 2017 show that annual wages grew far faster for the top 1.0 percent (3.7 percent) than for the bottom 90 percent (up only 1.0 percent). The top 0.1 percent saw the fastest growth, up 8.0 percent—far faster than any other wage group. This fast wage growth for the top 0.1 percent reflects the sharp 17.6 percent spike upwards in the compensation of the CEOs of large firms: executives comprise the largest group in both the top 1.0 and top 0.1 percent of earners. The fast wage growth of the top 1.0 percent in 2017 brought their wages to the highest level ever, $719,000, topping the wage levels reached before the Great Recession of $716,000 in 2007. The wages of the top 0.1 percent reached $2,757,000 in 2017, the second highest level ever, roughly only 4 percent below their wages in 2007.
These are the results of EPI’s updated series on wages by earning group, which is developed from published Social Security Administration data. These data, unlike the usual source of our wage analyses (the Current Population Survey) allow us to estimate wage trends for the top 1.0 and top 0.1 percent of earners, as well as those for the bottom 90 percent and other categories among the top 10 percent of earners. These data are not topcoded, meaning the underlying earnings reported are actual earnings and not “capped” for confidentiality.
What to Watch on Jobs Day: Keeping an eye on the teacher jobs gap
On Friday, the Bureau of Labor Statistics will release September’s numbers on the state of the labor market. As usual, I’ll be paying close attention to nominal wage growth as well as the prime-age employment-to-population ratio, which are two of the best indicators of labor market health. Friday’s report will also give us a chance to examine the “teacher gap”—the gap between local public education employment and what is needed to keep up with growth in the student population.
Thousands of local public education jobs were lost during the recession, and those losses continued deep into the official economic recovery, even as more students started school each year. This has been true of public sector jobs in general—continued austerity at all levels of government has been a drag on public sector employment, which has failed to keep up with population growth.
Teacher strikes in several states over the last couple of years have highlighted deteriorating teacher pay as a critical issue. My colleague Emma Garcia has forthcoming work that further documents shortcomings in the teaching profession today, including important issues of quality, particularly worse in high-poverty schools.
The costs of a significant teacher gap are high, and consequences measurable: larger class sizes, fewer teacher aides, fewer extracurricular activities, and changes to curricula. Last year, the local public education job shortfall remained large. To solve this problem, state and local governments need to fund more teaching positions and raise pay to close the teacher pay gap and attract and retain high quality teachers. On Friday, I will compare where jobs in public education should be, using the pre-recession ratio, student population growth, and the most recent jobs numbers.
The Fed’s current path might be leaving lots of money on the table unnecessarily
Today the Federal Reserve Open Market Committee (FOMC) will almost surely announce it is continuing on its path of steady interest rate hikes. These hikes are meant to start slowing the growth of the U.S. economy in the name of getting ahead of the curve on any potential outbreak of inflation. It’s important to be really clear on this point. The Fed is trying to keep economic growth slower than it would have otherwise been, and unemployment higher than it would otherwise have been, if they had not raised rates.
Intentionally keeping unemployment higher than it would have been will strike many as hard to believe—why would the Fed ever do this? The reason is that they see their job as balancing the obvious (but still underappreciated) benefits of low unemployment against the risk that unemployment will get so low that workers are empowered to achieve wage increases so large that they threaten to push up inflation. They’re not wrong that falling unemployment would eventually lead to faster wage growth. A primary way that workers (especially nonunionized workers) get raises is by either leaving their current job for a better one, or threatening to leave if their bosses don’t give them a raise. When unemployment is higher, fewer better-paying jobs are out there for workers to move to, and bosses know this and don’t find threats to leave all that credible. This intuition is confirmed by data—lower unemployment is clearly associated with faster wage growth, and this effect is most pronounced for low- and moderate-wage workers with few other sources of leverage in the labor market to get raises.
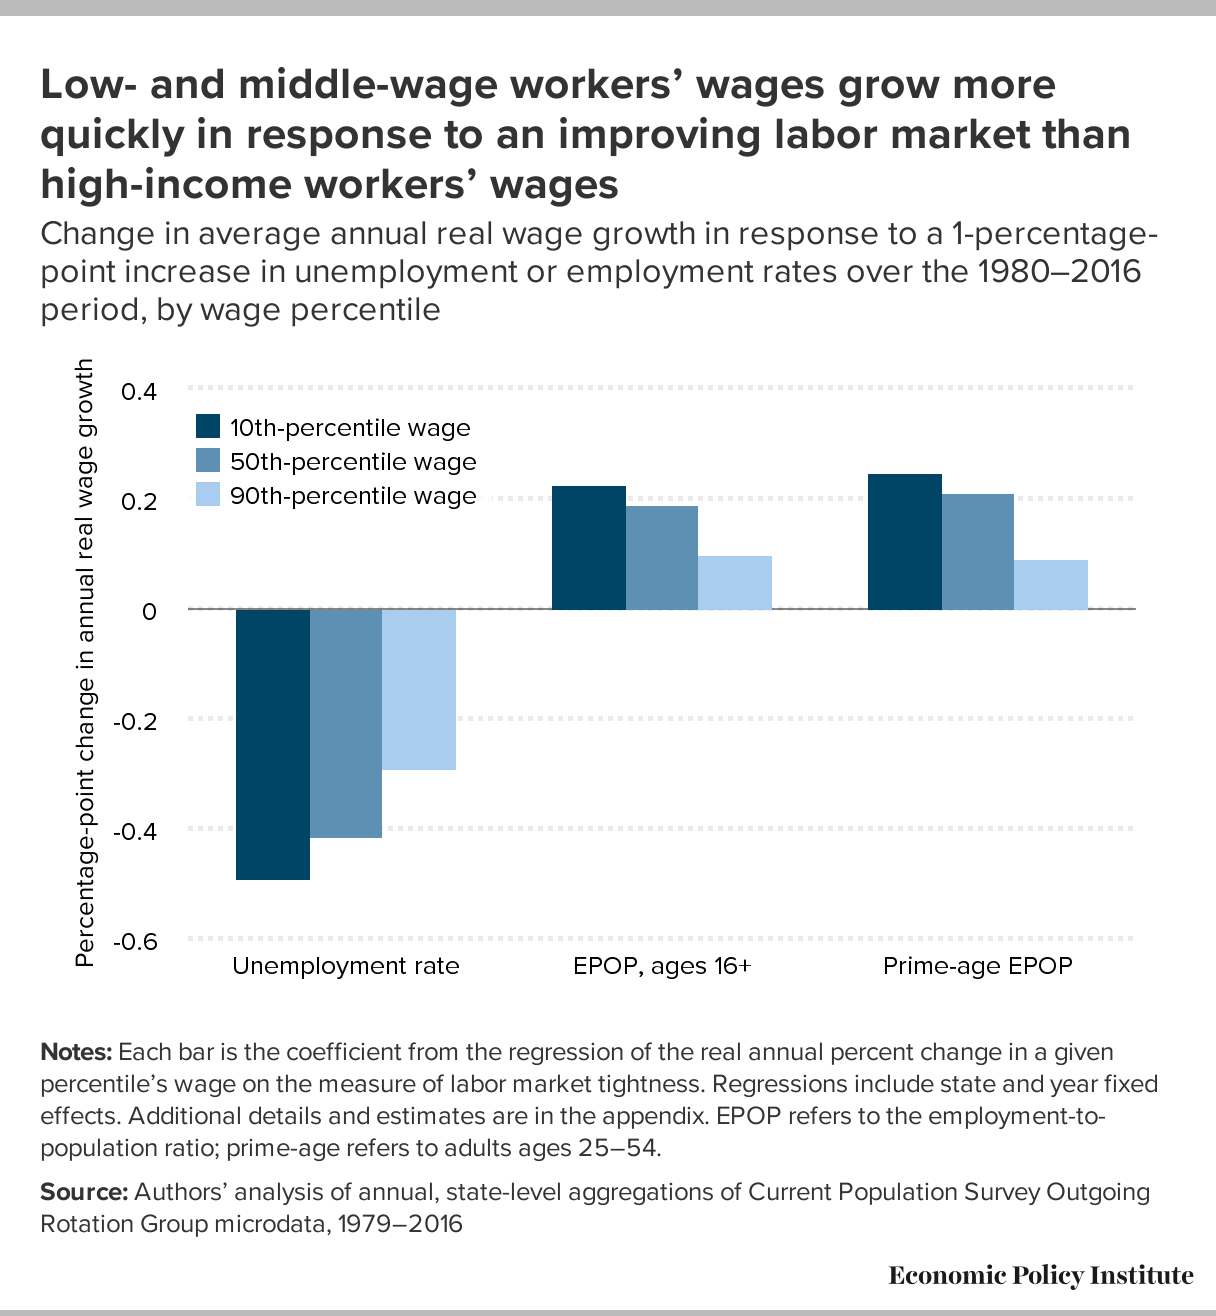
Defenders of the Fed’s current path would say that it makes sense when judged by the past history of the Fed—unemployment today sits below 4 percent, well below conventional estimates of the “natural” rate of unemployment that is meant to define the lowest sustainable rate of non-inflationary unemployment.
Exploring the effects of student absenteeism
With the great majority of states choosing some measurement of school attendance as their so-called “fifth metric” required by the Every School Succeeds Act,1 researchers, policymakers, and advocates are questioning how useful these metrics are at informing us about student achievement and education equity, as well as guiding policy. Indeed, while research has linked missing school to elevated risk of dropping out and poorer graduation rates, policymakers and researchers should further explore the importance of missing school, and about factors driving student absenteeism, and how to reduce it.
Our recently released report, Student absenteeism:Who misses school and how missing school matters for performance, examines how much school students are missing, which groups of students are missing the most school, and how bad missing school is for performance. We learned that about one in five students—19.2 percent—missed three or more days of school in the month before they took the 2015 National Assessment of Educational Progress (NAEP) assessment. Students who have been diagnosed with a disability, Hispanic-English language learners, Native Americans, and students who are eligible for free lunch, were the most likely to miss school, while Asian students were rarely absent. Our findings also confirmed that missing school negatively effects performance, even after accounting for student and school characteristics (including gender, race/ethnicity, language status, disability status, income, and school socioeconomic characteristics). Even students with only occasional absences were negatively affected. For these students, relative to those who did not miss school, absenteeism makes a moderate dent in their performance (a tenth of a standard deviation), but the decline in performance becomes more troubling as the number of missed days increases (up to about two-thirds of a standard deviation for those missing more than 10 school days).
Data continues to show little evidence that tax cuts are trickling down to typical workers, and now House Republicans want a do-over
In December, when Republicans passed the Tax Cuts and Jobs Act (TCJA) they chose to make tax cuts for corporations permanent, while making the individual provisions temporary to satisfy the requirements of budget reconciliation. Republicans sold these corporate tax cuts as being beneficial to everyday working people, despite the fact that previous experience gives us no reason to believe that corporate rate cuts will trickle down to anyone.
Some willing allies in the corporate world, eager to bolster the case for tax cuts, tried to hoodwink workers into believing that any bonus a worker received in 2017 was due to the TCJA. But the economic theory behind the idea that corporate rate cuts lead to higher pay for typical workers does not say that those wage increases would occur immediately (and certainly not before the tax cuts came into effect). Instead, wage bumps for workers, if they come at all, would come only after a long chain of economic events were triggered by the cut. One of the first of these events should be increased investment. We’ve long pointed out that there was reason to believe that nearly every link in this chain would break down, and that the theory itself is inconsistent with the reality of the larger deficits caused by the TCJA.
Now that the tax cuts have passed and enough time has gone by to allow some data to trickle in, is there any reason for us to change this judgement? Not really. There’s still no indication in the data that the TCJA has spurred investment—the necessary but by no means sufficient precursor to wage gains. Sure, owners of corporate shares have made out like bandits. The most recent release from the Bureau of Economic Analysis (BEA) shows that domestic after-tax corporate profits remain high, 7.5 percent of GDP in the second quarter of 2018 compared to 7.4 percent in the first quarter of 2018 and up substantially from already-high levels (6.7 percent) in 2017. Revenue collected from domestic corporate taxes remains low, 1.2 percent of GDP in the second quarter of 2018 compared to 1.1 percent in the first quarter of 2018 and 1.8 percent in 2017. Finally, undistributed domestic corporate profits – corporate profits kept internal to the firm and not distributed back to shareholders as dividends—remain historically high. This is due to the windfall the TCJA contained for multinational corporations on the profits they booked offshore. These undistributed profits (available to finance share buybacks) constituted 8.9 percent of domestic corporate gross value added in the second quarter of 2018 compared to 13.7 percent in the first quarter of 2018 and 2.6 percent in 2017. In short, the direct effects of the TCJA are here and totally visible in the data: swollen corporate profits.
Further evidence that the tax cuts have not led to widespread bonuses, wage or compensation growth
One of the leading arguments for the GOP’s Tax Cuts and Jobs Act of 2017 has been that it will raise the wages of rank-and-file workers, with congressional Republicans and members of the Trump administration promising raises of many thousands of dollars within ten years. The Trump administration’s chair of the Council of Economic Advisers argued in April that we are already seeing the positive wage impact of the tax cuts:
A flurry of corporate announcements provide further evidence of tax reform’s positive impact on wages. As of April 8, nearly 500 American employers have announced bonuses or pay increases, affecting more than 5.5 million American workers.
Following the bill’s passage, a number of corporations made conveniently-timed announcements that their workers would be getting raises or bonuses (some of which were in the works well before the tax cuts passed). But as Josh Bivens and Hunter Blair have shown there are many reasons to be skeptical of the claim that the TCJA, particularly corporate tax cuts, will produce significant wage gains.
Newly released Bureau of Labor Statistics’ Employer Costs for Employee Compensation data allow us to examine nonproduction bonuses in the first two quarters of 2018 to assess the trends in bonuses in absolute dollars and as a share of compensation. The bottom line is that there has been very little increase in private sector compensation or W-2 wages since the end of 2017. The $0.03 per hour (inflation-adjusted) bump in bonuses between the fourth quarter of 2017 and the second quarter of 2018 is very small and not necessarily attributable to the tax cuts rather than employer efforts to recruit workers in a continued low unemployment environment.
Digging into the 2017 ACS: Improved income growth for Native Americans, but lots of variation in the pace of recovery for different Asian ethnic groups
Thursday’s release of 2017 American Community Survey (ACS) data allows us to fill in the blanks for racial and ethnic groups that were not covered in Wednesday’s Census Bureau report on income, poverty, and health insurance coverage in 2017. The ACS is an annual nationwide survey that provides detailed demographic, social, and economic data for smaller populations like Native Americans and the thirteen distinct ethnic groups that make up the Asian population. (For the sake of comparability, in this blog post, the national estimates of median household income and poverty that I refer to are from the ACS.)
Between 2016 and 2017, the real median household income for Native Americans increased 3.2 percent, to $41,882. Native American median household income grew faster in 2017 than 2016 (1.8 percent), essentially bringing it back to the 2007 pre-recession level (though technically still $5 lower). Even with this boost, the median household income of Native Americans was just 69.4 percent of the national median in 2017. While this data comes from a different source than Wednesday’s data on household income and covers a slightly different survey period, it suggests that Native American median household income is similar to that of black households, but Native American households experienced much faster income growth than blacks over the last year.
Poverty declined in most states in 2017
The American Community Survey (ACS) data released today shows that the decline in the national poverty rate was felt in nearly every state. The poverty rate decreased in 42 states and the District of Columbia, with 20 of those states experiencing statistically significant declines. While there were slight increases in the poverty rate in seven states, the only statistically significant increases occurred in Delaware and West Virginia. These widespread declines are certainly good news, though most states have still not recovered to their pre-great-recession poverty rates and 40 states had higher poverty rates in 2017 than in 2000, when the economy was closer to full employment.
The national poverty rate, as measured by the ACS, fell 0.6 percentage points to 13.4 percent. This is 0.4 percentage points above the ACS poverty rate for the country in 2007, and 1.2 percentage points above the rate from 2000.
Between 2016 and 2017, the District of Columbia saw the largest decline in its poverty rate (-2.0 percentage points), followed by Idaho (-1.6 percentage points), Arizona (-1.5 percentage points), Maine (-1.4 percentage points), Kentucky (-1.3 percentage points), and Rhode Island (-1.2 percentage points). There were increases in poverty in Delaware (1.9 percentage points), West Virginia (1.2 percentage points), Alaska (1.2 percentage points), New Hampshire (0.4 percentage point), Hawaii (0.2 percentage point), South Carolina (0.1 percentage point), and Massachusetts (0.1 percentage point). In Wyoming, the rate remained essentially unchanged between 2016 and 2017.Read more
Household incomes in 2017 stayed on existing trends in most states; incomes in 21 states are still below their pre-recession levels
The state income data for the American Community Survey (ACS), released this morning by the Census Bureau, showed that in 2017, household incomes across the states stayed largely on the same trajectories that they were heading in 2016, with a handful of exceptions. From 2016 to 2017, inflation-adjusted median households incomes grew in 40 states and the District of Columbia (24 of these changes were statistically significant.) The ACS data showed an increase of 2.5 percent increase in the inflation-adjusted median household income for the country as a whole—an increase of $1,492 for a typical U.S. household. Despite these increases, households in 21 states still had inflation-adjusted median incomes in 2017 below their 2007 pre-recession values.
From 2016 to 2017, the largest percentage gains in household income occurred in the District of Columbia, where the typical household experienced an increase of $5,258 in their annual income—an increase of 6.8 percent. With this increase, the District of Columbia now has the highest median household income in the country at $82,372—though comparing D.C. to states is problematic, since D.C. is a city, not a state. Maryland remains the state with the highest median household income at $80,776—a value essentially unchanged (0.2 percent growth) from 2016 to 2017. Households in 13 states experienced growth faster than the U.S. average of 2.5 percent: Montana (4.5 percent), Maine (3.8 percent), California (3.8 percent), Washington (3.6 percent), Tennessee (3.5 percent), Arizona (3.4 percent), Rhode Island (3.2 percent), Nebraska (3.1 percent), Colorado (3.0 percent) New Jersey (3.0 percent), Nevada (2.9 percent), Virginia (2.8 percent), and Georgia (2.7 percent).Read more