State and local American Rescue Plan funds should be used to support an equitable recovery for workers
Last month, we at the Economic Policy Institute submitted a public comment on the U.S. Department of the Treasury’s guidance regarding the Coronavirus State and Local Fiscal Recovery Funds. These funds are part of the American Rescue Plan (ARP) Act’s resources for state and local communities to respond to the public health and economic crisis. The funds—nearly $350 billion—may be used to support public health responses, mitigate negative economic impacts, replace public-sector revenue lost due to the pandemic, provide premium pay for “essential” workers, and make necessary investments in water, sewer, and broadband infrastructure.
The current public health and economic crisis is happening in the wake of more than a decade of underinvestment by state and local governments. During the Great Recession, cuts to jobs and state and local spending delayed a full recovery to pre-recession unemployment rates by more than four years. Public-sector job losses, especially in state and local education, were among the highest during the pandemic. Cuts to public services and staffing have been especially harmful for women and Black workers, who are disproportionately employed in the state and local public sectors.
Black women face a persistent pay gap, including in essential occupations during the pandemic
This year, Black Women’s Equal Pay Day arrives 10 days earlier than in 2020 (August 13). If this seems inconsistent with current realities, it is. That’s because the August 3, 2021, date is based on the comparison of median annual earnings for full-time, year-round workers reported in the 2020 Annual Social and Economic Supplement of the Current Population Survey (CPS). Since the reference year in that survey is the previous year—2019—the earlier date is more a statement about pay equity during the pre-COVID period of historically low unemployment than the impact of the pandemic.
Based on hourly wages available for 2020, the pandemic’s effect on pay inequality in 2020 is challenging to interpret since job losses were concentrated among low-wage occupations, which has the effect of skewing the distribution toward a higher average that is less representative of the workforce as a whole. These lower-paying jobs were concentrated in leisure and hospitality and education and health services—industries that employ a disproportionate share of women.
In fact, the pandemic’s effect on pay equity during 2020 is less about a relative difference in dollars per hour and more a matter of a disproportionate share of women—and Black women in particular—becoming unemployed and thus wageless. Nearly one in five Black women (18.3%) lost their jobs between February 2020 and April 2020, compared with 13.2% of white men (see figure below). As of June 2021, Black women’s employment was still 5.1 percentage points below February 2020 levels, while white men were down 3.7 percentage points.
Worker protection agencies need more funding to enforce labor laws and protect workers
The COVID-19 pandemic has exacerbated the widespread dangers and injustices that workers face every day. For too long, workers have been forced to work in unsafe conditions, suffered from excessive wage theft, and been subjected to discrimination and harassment. While laws aimed at deterring these workplace abuses already exist, enforcement efforts have been woefully insufficient because the agencies tasked with protecting workers are chronically under-resourced. As Congress and the Biden administration work on budget spending and COVID-19 recovery legislation, there is an urgent opportunity to correct these inadequacies in our labor law system and boost funding for enforcement agencies.
The Department of Labor (DOL) and the National Labor Relations Board (NLRB) enforce major worker protection laws, including the Fair Labor Standards Act, the Occupational Safety and Health Act, and the National Labor Relations Act. These statutes guarantee U.S. workers a minimum wage, a safe and healthy workplace, and the right to collective bargaining, respectively, but weak enforcement has led to pervasive and repeated violations of these laws. Despite inflation, a growing workforce, and increasingly complex workplaces, funding for agencies like the Wage and Hour Division (WHD), Occupational Safety and Health Administration (OSHA), and the NLRB has largely remained stagnant over the last decade, as shown in Figure A.
As Arkansas and Missouri see a rise in COVID-19 cases, more economic protections are needed
Key takeaways:
- As the Delta variant of COVID-19 spreads throughout the United States, Arkansas and Missouri are facing an even more dramatic spike in COVID-19 cases, in part due to lower vaccination rates. This puts many at risk and may contribute to long-term economic problems in the region.
- To mitigate these effects, Missouri and Arkansas policymakers must take immediate action to strengthen public health and the economy, including:
- Expanding Medicaid and eliminating barriers to benefits.
- Recommitting to the federal expansion of unemployment benefits to cushion the economic harm as business disruptions grow.
- Enacting paid sick leave and paid family and medical leave.
As COVID-19 cases and hospitalizations begin to rise again across the country, some states are more vulnerable than others. Neighboring states Missouri and Arkansas are in the middle of a serious COVID-19 spike along with Louisiana, Florida, and Mississippi. The number of cases per capita in the two states—about 52 new cases daily per 100,000 residents in Arkansas and 40 per 100,000 residents in Missouri—is more than twice the national average of 19. The seven-day rolling average of deaths in the two states is rising rapidly and is three times the national average. Mercy Hospital in Springfield, Missouri, ran out of ventilators over the Fourth of July weekend. Hospitals across the state of Arkansas are already reaching maximum capacity—even as a record number of COVID-19 hospitalizations are anticipated in the coming weeks.
The minimum wage has lost 21% of its value since Congress last raised the wage
Saturday marks 12 years since the last federal minimum wage increase on July 24, 2009, the longest period in U.S. history without an increase. In the meantime, rising costs of living have diminished the purchasing power of a minimum wage paycheck. A worker paid the federal minimum of $7.25 today effectively earns 21% less than what their counterpart earned 12 years ago, after adjusting for inflation.
After the longest period in history without an increase, the federal minimum wage in 2021 was worth 21% less than 12 years ago—and 34% less than in 1968. : Real value of the minimum wage (adjusted for inflation)
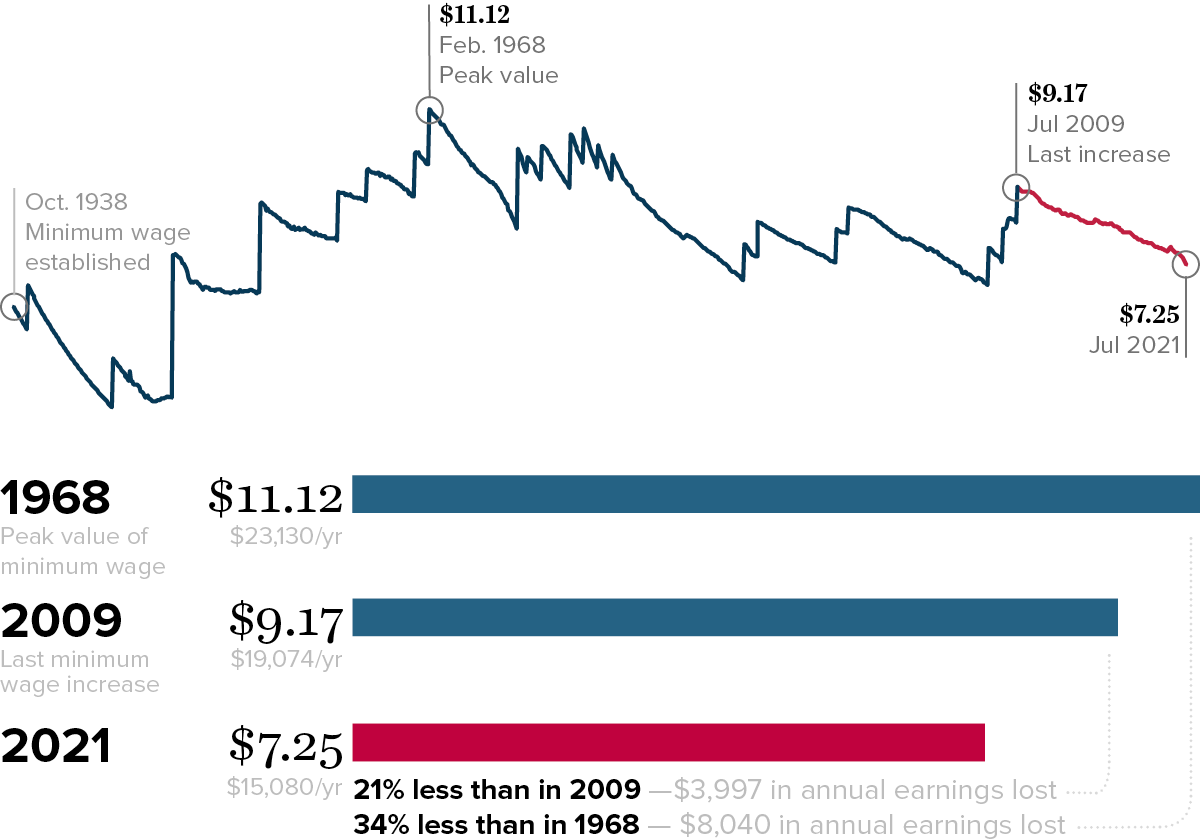

Notes: All values are in June 2021 dollars, adjusted using the CPI-U-RS
Source: Fair Labor Standards Act and amendments
As a result of Congressional inaction, over two dozen states and several cities have raised their minimum wage, including 11 states and the District of Columbia that have adopted a $15 minimum wage. These higher wage standards have increased the earnings of low-wage workers, with women in minimum wage-raising states seeing the largest pay increases. In the rest of the country, however, states have punished low-wage workers by refusing to raise pay standards. As many as 26 states have gone so far as to pass laws prohibiting local governments from raising their minimum wage.
The farmworker wage gap continued in 2020: Farmworkers and H-2A workers earned very low wages during the pandemic, even compared with other low-wage workers
Key takeaways:
- More than two million farmworkers were deemed “essential” amid the pandemic in order to sustain food supply chains, but the latest wage data show that farmworkers were not rewarded adequately: They earned just $14.62 per hour on average in 2020, far less than even some of the lowest-paid workers in the U.S. labor force.
- At this wage rate, farmworkers earned just under 60% of what comparable workers outside of agriculture made in 2020—a wage gap that was virtually unchanged since the previous year. They also earned less than workers with the lowest levels of education.
- The wage paid to most farmworkers with H-2A visas—known as the Adverse Effect Wage Rate (AEWR)—was even lower, with a national average of $13.68 per hour. (The AEWR is based on a mandated wage standard that varies by region and is intended to prevent underpayment.) But many H-2A farmworkers earned far less in some of the biggest H-2A states. In Florida and Georgia—where a quarter of all H-2A jobs were located in 2020—H-2A workers were paid the lowest state AEWR, at $11.71 per hour.
- Farmworkers are employed in one of the most hazardous jobs in the entire U.S. labor market and suffer very high rates of wage and hour violations, and the majority of farmworkers who are unauthorized migrants or on H-2A visas are even worse off, with limited labor rights and heightened vulnerability to wage theft and other abuses due to their immigration status. Congress should take immediate action to improve labor standards for all farmworkers and provide migrant farmworkers with a path to citizenship.
Near the start of the pandemic in 2020, numerous work and travel restrictions were implemented in the United States to slow the spread of COVID-19. But for most workers, including farmworkers, options like remote work were either not permitted or not feasible. The more than two million farmworkers who grow, harvest, and pack the crops that end up on grocery store shelves were deemed “essential” and expected to work to keep food supply chains up and running.
Were those farmworkers ultimately rewarded and valued for their massive contributions to society? It appears not—the latest wage data show that farmworkers continued to earn far less than even some of the lowest-paid workers in the U.S. labor force, which suggests their important work continues to be undervalued. This post reviews the wages that farmworkers earned in 2020 relative to other comparable sets of workers.
Worker-led state and local policy victories in 2021 showcase potential for an equitable recovery
What new world of work can be built from the crisis COVID-19 created for workers and working-class communities? Some 2021 state and local policy victories are providing early answers. Across the country, workers are organizing to win policy changes aimed at strengthening labor standards, raising wages, reversing long-standing race and gender-based exclusions from labor rights, and building power to ensure these gains are not short-lived. The following examples of campaign and policy victories from recent legislative sessions are just the beginning of what is necessary to create a world where all work truly has dignity.
Building worker power and protecting the right to organize at the state level
Long before COVID-19, the right to unionize varied widely depending on a worker’s occupation, race, gender, or ZIP code. Union workers had more job security during the pandemic, and more workers are expressing interest in gaining a voice on the job through a union, yet legal exclusions and steep barriers to organizing mean that far too few workers have access to the union protections they want and need. Because federal labor law still excludes farmworkers, domestic workers, and public-sector workers from coverage, states are left to determine whether millions of disproportionately Black, Brown, immigrant, and women workers in front-line occupations will have legal rights to pursue a union contract.
This year, educators, care workers, farmworkers, and public servants acutely affected by the pandemic worked to accelerate the passage of proposals to expand labor rights and defend existing rights from ongoing state legislative attacks. Colorado enacted a groundbreaking, comprehensive Farmworker Bill of Rights extending full rights to organize unions and collectively bargain to 40,000 farmworkers across the state in a significant effort to advance worker power at the state level. The legislation also includes new workplace safety protections, rights to minimum wage and overtime pay, anti-retaliation protections, rest and meal breaks, and other minimum standards that have long covered workers in other sectors.
Care workers are deeply undervalued and underpaid: Estimating fair and equitable wages in the care sectors
The Biden administration has made large investments in care work—both child care and elder care—key planks in its American Jobs Plan (AJP) and American Families Plan (AFP). These investments would be transformative, and a greater public role in providing this care work can make the U.S. economy fairer and more efficient. The administration has also recognized the need to pay workers in these sectors higher wages—which are sorely needed—but setting a fair wage standard for care workers presents unique challenges.
For a variety of systemic reasons, including racism, misogyny, and xenophobia, there has never been a set of institutions that has managed to carve out decent wages and working conditions in care work. For example, the average hourly wages for home health care and child care workers are $13.81 and $13.51, respectively, which is roughly half the average hourly wage for the workforce as a whole. So, unlike in sectors like construction, a “prevailing wage” standard would just cement the industrywide insufficient wages currently experienced in care work.
But just because it’s challenging doesn’t mean it’s impossible to establish strong wage standards in this sector. All wages in the U.S. economy are politically and socially determined, but given that care work is heavily publicly financed, care wages are especially determined by political decisions (via commission or omission). As a result, there is a strong administrative responsibility and opportunity to set equitable wages in this sector. This research memo outlines a number of ways to improve the wage standard for care workers and is a preview to a forthcoming, more comprehensive research report.
Civil monetary penalties for labor violations are woefully insufficient to protect workers
Key takeaways:
- Workers’ rights and safety violations receive significantly lower fines than financial and corporate law violations. And in many cases, these violations involve no monetary penalty at all.
- Because workers’ rights and safety violations result in such low financial penalties, these fines function as the cost of doing business rather than as deterrents.
- The ineffective nature of workers’ rights enforcement often leads to repeated workers’ rights and safety violations with little incentive for employers to improve conditions.
Civil monetary penalties—fines imposed when a law or regulation is violated—are enforcement tools. Agencies utilize them to enforce statutes and regulations, and the minimum and maximum civil penalties may be established administratively or by statute. By examining civil monetary penalties for violations of various key federal laws, we find a striking pattern: Workers’ rights and safety violations are assigned a significantly lower penalty value than violations of other laws—characteristic of a system that unjustly undervalues workers. While employers and corporate officials face significant civil monetary penalties for breaking the law related to consumer finance, lobbying, and insider trading regulations, violations of fundamental labor and worker protection laws involve only minimal civil monetary penalties or even no monetary penalty at all.
Policymakers cannot relegate another generation to underresourced K–12 education because of an economic recession
Key takeaways:
- Federal education funding and additional recovery funds targeted to education during recessions can help if they are sufficiently large and are sustained for long enough.
- During the Great Recession, federal funding and additional recovery funds targeted to public K–12 education through the American Recovery and Reinvestment Act provided an initial and critical counterbalance to the defunding brought about by the recession, but these funds were phased out far too prematurely.
- Nationally, total real revenue per student lagged behind the pre-recession level, on average, for eight school years after the onset of the last economic downturn.
- The reductions in total revenue per student were not uniform across districts: High-poverty districts and their students experienced the biggest shortfalls—and a very sluggish recovery.
As Congress debates the appropriate amount of investments needed to boost the economic recovery from the COVID-19-induced recession, we can learn a lot by carefully looking at the decisions made in the aftermath of the Great Recession of 2007–2009. One of the clearest lessons of that period is that spending by the federal government largely dictated the amount of economic suffering for those hit the hardest. When that spending falls short of what is needed, some groups never fully recover.
School finance deserves a place in this discussion. Federal support to education plays a critical role in filling recession-induced fiscal gaps that open at the state and local levels, and maintaining education funding during economic downturns contributes to a faster and fuller economic recovery. As we discuss in this post, if federal investments in public education had been larger, sustained as needed, and allocated in a way that channeled further assistance to districts serving larger shares of low-income students, they would have better assisted our students, schools, and communities in the aftermath of the Great Recession.