Household incomes in 2017 stayed on existing trends in most states; incomes in 21 states are still below their pre-recession levels
The state income data for the American Community Survey (ACS), released this morning by the Census Bureau, showed that in 2017, household incomes across the states stayed largely on the same trajectories that they were heading in 2016, with a handful of exceptions. From 2016 to 2017, inflation-adjusted median households incomes grew in 40 states and the District of Columbia (24 of these changes were statistically significant.) The ACS data showed an increase of 2.5 percent increase in the inflation-adjusted median household income for the country as a whole—an increase of $1,492 for a typical U.S. household. Despite these increases, households in 21 states still had inflation-adjusted median incomes in 2017 below their 2007 pre-recession values.
From 2016 to 2017, the largest percentage gains in household income occurred in the District of Columbia, where the typical household experienced an increase of $5,258 in their annual income—an increase of 6.8 percent. With this increase, the District of Columbia now has the highest median household income in the country at $82,372—though comparing D.C. to states is problematic, since D.C. is a city, not a state. Maryland remains the state with the highest median household income at $80,776—a value essentially unchanged (0.2 percent growth) from 2016 to 2017. Households in 13 states experienced growth faster than the U.S. average of 2.5 percent: Montana (4.5 percent), Maine (3.8 percent), California (3.8 percent), Washington (3.6 percent), Tennessee (3.5 percent), Arizona (3.4 percent), Rhode Island (3.2 percent), Nebraska (3.1 percent), Colorado (3.0 percent) New Jersey (3.0 percent), Nevada (2.9 percent), Virginia (2.8 percent), and Georgia (2.7 percent).Read more
Government programs kept tens of millions out of poverty in 2017
From 2016 to 2017, the official poverty rate fell by 0.4 percentage points, as household income rose modestly, albeit unevenly, throughout the income distribution. This was the third year in a row that poverty declined, but the poverty rate remains a full percentage point higher than the low of 11.3 percent it reached in 2000.
Since 2010, the U.S. Census Bureau has also released an alternative to the official poverty measure known as the Supplemental Poverty Measure (SPM).1
The SPM corrects many potential deficiencies in the official rate. For one, it constructs a more realistic threshold for incomes families need to live free of poverty, and adjusts that threshold for regional price differences. For another, it accounts for the resources available to poor families that are not included in the official rate, such as food stamps and other in-kind government benefits.
As shown in Figure A, a larger proportion of Americans are in poverty as measured by the SPM than the official measure reports. (Importantly, however, researchers who constructed a longer historical version of the SPM found that it shows greater long-term progress in reducing poverty than the official measure.) In 2017, the SPM declined by 0.1 percentage points to 13.9 percent. Under the SPM, 45.0 million Americans were in poverty last year, compared with 39.7 million Americans under the “official” poverty measure.
10 years after the start of the Great Recession, black and Asian households have yet to recover lost income
Today’s Census Bureau report on income, poverty, and health insurance coverage in 2017 shows that while all race and ethnic groups shared in the growth in median household incomes during the previous two years, that trend abruptly ended for African American households in 2017. Real median incomes were basically flat among African Americans (from $40,339 to $40,258) and down among Asians (from $83,182 to $81,331), but up 3.7 percent (from $48,700 to $50,486) among Hispanics, and 2.6 percent (from $66,440 to $68,145) among non-Hispanic whites. The decline in Asian household incomes was not statistically significant. As a result of stalled income growth among African Americans, recent progress in closing the black-white income gap over the last couple years has been reversed. The median black household earned just 59 cents for every dollar of income the white median household earned (down from 61 cents), while the median Hispanic household earned just 74 cents (up from 73 cents). Meanwhile, households headed by persons who are foreign-born saw little change in median incomes between 2016 and 2017 (from $56,754 to $57,273), compared to an increase of 1.5 percent (from $61,066 to $61,987) among households with a native-born household head.Read more
Black workers have made no progress in closing earnings gaps with white men since 2000
This week, the Census Bureau released its report on incomes, earnings, and poverty rates for 2017. Most analysis has paid particular attention to the changes between 2016 and 2017, but this post takes a deeper look at earnings by race and gender over a longer period of time—since 2000—to paint a more complete picture of what has happened over the last full business cycle (2000-2007) plus the most recent recession and recovery (2007-2017). Since 2000, wages have been generally stagnant, and large gaps persist by race and gender, despite an expanding and increasingly productive economy.
To a great extent, trends in annual earnings since 2000 resemble the overall wage stagnation we’ve seen since the mid-1970s. (Here, we discuss annual full time earnings, but the long-run trends are consistent with the hourly wage data. For an extensive discussion of hourly wage trends, see The State of American Wages 2017.) Between 2016 and 2017, full-time year-round men’s and women’s earnings fell 1.1 percent. Men’s median earnings are still 1.9 percent below their 2000 level, while women’s earnings are now 7.1 percent higher than in 2000. Because of these divergent trends, the overall gender wage gap narrowed between 2000 and 2017, though at a slower rate than in the previous two decades.
These patterns in men’s and women’s full-time median annual earnings can be further broken down by race. As you can see in the figure below, real median earnings of full-time workers—male and female, black and white—have been relatively flat since 2000. Unlike the previous year’s data where only white women saw a significant increase in median earnings, only white men saw their median wages rise between 2016 and 2017. For the most part, median wages were flat or falling in the full business cycle of 2000–2007, and black men have still not grown past their 2000 levels.
Household income growth slowed markedly in 2017 and was stronger for those at the top, while earnings declined slightly
Today’s report from the Census Bureau shows a marked slowdown in median household income growth relative to previous years. Median household incomes rose 1.8 percent, after an impressive 5.1 percent gain in 2015 and a 3.1 percent gain in 2016; median non-elderly household income saw a similar rise of 2.5 percent this year after gaining 4.6 percent and 3.6 percent in the prior two years, respectively. However, inflation-adjusted full-time annual earnings for both men and women fell by 1.1 percent in 2017. Men’s earnings are still below their 2007 level (by 2.5 percent points), while women’s earnings are now 0.9 percent above. This year’s report is hence a bit discouraging; earnings for low and middle-income workers need to make strong and sustained gains if we are to have an economy that works for typical American households and not just for the well-off.
While the gains in household income are markedly slower than in previous years, they nonetheless represent another small step toward reclaiming the lost decade of income growth caused by the Great Recession. Part of this year’s slowdown in income growth relative to 2016 is likely driven by a small increase in the pace of inflation. In 2017, year-over-year inflation was 2.2 percent compared to 1.3 percent in 2016. However, as discussed below, this year’s report reminds us that the vast majority of household incomes (when corrected for a break in the data series in 2013) have still not fully recovered from the deep losses suffered in the Great Recession.
Non-elderly household incomes improve
The Census data show that from 2016–2017, inflation-adjusted median household incomes for non-elderly households (those with a head of household younger than 65 years old) increased 2.5 percent, from $67,917 to $69,628. Median non-elderly household income is an important measure of an improving economy, as those households depend on labor market income for the vast majority of their income. This continued, albeit slower, increase after large gains in the prior two years is a welcome trend. Median household income for non-elderly households, which finally recovered to its pre-recession level in 2017, was 0.8 percent, or $530, above its level in 2007. It’s important to note that the Great Recession and its aftermath came on the heels of a weak labor market from 2000–2007, during which the median income of non-elderly households fell significantly, from $71,577 to $69,098—the first time in the post-war period that incomes failed to grow over a business cycle. Altogether, from 2000–2017, the median income for non-elderly households fell from $71,577 to $69,628, a decline of $1,949, or 2.7 percent. In short, the last three years should not make us forget that incomes for the majority of Americans have experienced a lost 17 years of growth.Read more
By the Numbers: Income and Poverty, 2017
Jump to statistics on:
• Earnings
• Incomes
• Poverty
• Policy / SPM
This fact sheet provides key numbers from today’s new Census reports, Income and Poverty in the United States: 2017 and The Supplemental Poverty Measure: 2017. Each section has headline statistics from the reports for 2017, as well as comparisons to the previous year, to 2007 (the final year of the economic expansion that preceded the Great Recession), and to 2000 (the historical high point for many of the statistics in these reports.) All dollar values are adjusted for inflation (2017 dollars).
Earnings
Median annual earnings for men working full time fell 1.1 percent, to $52,146, in 2017. Men’s earnings are down 2.5 percent since 2007, and are still 1.9 percent lower than they were in 2000.
Median annual earnings for women working full time fell 1.1 percent, to $41,977, in 2017. Women’s earnings are up 0.9 percent since 2007, and are 7.1 percent higher than they were in 2000.
Median annual earnings for men working full time in 2017: $52,146
Change over time:
- 2016–2017: -1.1%
- 2007–2017: -2.5%
- 2000–2017: -1.9%
Median annual earnings for women working full time in 2017: $41,977
Change over time:
- 2016–2017: -1.1%
- 2007–2017: 0.9%
- 2000–2017: 7.1%
What to watch for in the 2017 Census data on earnings, incomes, and poverty
Next Wednesday is the Census Bureau’s release of annual data on earnings, income, poverty, and health insurance coverage for 2017, which will give us a picture of the economic status of working families 10 years since the start of the Great Recession—and in the first year of the Trump presidency. Next week’s release will help us chart the progress made by the typical American household in clawing back nearly two decades of lost income growth—the result of a failure of incomes to return to the business cycle peaks of 2000 during the slow early-2000s recovery and expansion, and the Great Recession. We’ll be paying particular attention to differences in the recovery across racial and ethnic groups.
What happened with incomes in 2016?
After adjusting the series to account for changes to the survey in 2013, 2016 median incomes for American households fell just shy of their pre-Great Recession peaks, even after two years of impressive across-the-board improvements (as shown in the figure below). It is important to note, however, that some of the improvements in inflation-adjusted income we saw in 2015 and 2016 were driven by atypically low inflation—0.1 percent in 2015, and 1.3 percent in 2016. While we don’t expect a similar boost from low inflation in 2017 (inflation increased 2.2 percent in 2017), we anticipate that an additional year of even modest growth will likely bring the broad middle class back to pre-recession incomes. But, for non-elderly households, the latest data will be likely still below the peak reached 17 years prior.
Real median household income, all and non-elderly, 1995–2016
| All households | All households- imputed series | All households- new series | Non-elderly households | Non-elderly households- imputed series | Non-elderly households- new series | |
|---|---|---|---|---|---|---|
| 1995 | $53,330 | $55,020 | $61,268 | $63,173 | ||
| 1996 | $54,094 | $55,808 | $62,399 | $64,338 | ||
| 1997 | $55,207 | $56,956 | $63,203 | $65,168 | ||
| 1998 | $57,223 | $59,036 | $65,775 | $67,820 | ||
| 1999 | $58,647 | $60,506 | $67,451 | $69,548 | ||
| 2000 | $58,525 | $60,380 | $67,783 | $69,890 | ||
| 2001 | $57,248 | $59,062 | $66,737 | $68,811 | ||
| 2002 | $56,591 | $58,384 | $66,066 | $68,120 | ||
| 2003 | $56,522 | $58,313 | $65,464 | $67,499 | ||
| 2004 | $56,333 | $58,118 | $64,705 | $66,717 | ||
| 2005 | $56,947 | $58,752 | $64,275 | $66,273 | ||
| 2006 | $57,390 | $59,208 | $65,159 | $67,184 | ||
| 2007 | $58,150 | $59,993 | $65,457 | $67,492 | ||
| 2008 | $56,079 | $57,856 | $63,311 | $65,280 | ||
| 2009 | $55,689 | $57,454 | $62,451 | $64,392 | ||
| 2010 | $54,242 | $55,961 | $60,847 | $62,738 | ||
| 2011 | $53,413 | $55,106 | $59,374 | $61,220 | ||
| 2012 | $53,335 | $55,025 | $59,959 | $61,823 | ||
| 2013 | $53,513 | $55,209 | $55,209 | $60,220 | $62,092 | $62,092 |
| 2014 | $54,404 | $61,304 | ||||
| 2015 | $57,231 | $64,146 | ||||
| 2016 | $59,039 | $66,487 | ||||
Note: Because of a redesign in the CPS ASEC income questions in 2013, we imputed the historical series using the ratio of the old and new method in 2013. Solid lines are actual CPS ASEC data; dashed lines denote historical values imputed by applying the new methodology to past income trends. Non-elderly households are those in which the head of household is younger than age 65. Shaded areas denote recessions.
Source: EPI analysis of Current Population Survey Annual Social and Economic Supplement Historical Income Tables (Tables H-5 and HINC-02)
What do we expect in this year’s release?
Given the data we’ve seen for 2017 from other sources, it is likely that earnings, income, and poverty in the 2017 Census data will show some improvement over the past year. But it is also likely that this pace of improvement will be significantly slower than the previous two years’ growth. As the economy steadily strengthens, we’ve seen progress in key labor market indicators, including participation in the labor market and payroll employment, which should boost household labor earnings. However, hourly wage data suggest that wage growth in 2017 continues to be unequal and slower than expected at this point in the business cycle. In 2017, strong growth in hourly wages continued at the top (1.5 percent at the 95th percentile), while the 10th percentile saw the strongest growth at 3.7 percent due in part to a tightening labor market as well as state-level minimum wage increases. However, median wages grew only 0.2 percent.Read more
What to Watch on Jobs Day: Keeping a cautiously optimistic eye on wages
Nominal wage growth has been slower than would be expected over the last year, particularly in light of an unemployment rate hovering around 4.0 percent. In a tight labor market, employers should be finding it harder and harder to attract and retain the workers they want—and, therefore they should be raising wages in order to get them. But, that’s not happening enough to move the dial on wage growth. In this preview post for jobs day, I’m going to review some reasons that do NOT explain slower wage growth, then discuss some far more compelling explanations.
In the last several weeks, some colleagues and I tried to dispel a few myths about why wages aren’t rising as fast as would be expected in this labor market. One reason wage growth could be slow is if lower wage jobs are being added at a disproportionate rate, but the composition of new jobs is not what is keeping wage growth so sluggish right now. Instead, we are simply seeing sluggish wage growth within a wide variety of job-types. Some have posited that our far-less-than-stellar wage growth right now could be due to workers not having the skills employers need. But that idea has the logic backwards. When employers can’t find workers with the skills they need at the wages they are offering, they will raise wages in order to attract qualified workers—if employers can’t find the workers they need among the unemployed, they will offer higher wages in an attempt to poach needed workers from other firms, who will then raise wages in an attempt to keep their workers, and so on. In other words, if there are skills shortages, we should see signs of faster wage growth for workers with needed skills. This fast wage growth for skilled workers should push up average wages, not weigh them down. Furthermore, if there was a credential shortage, we’d expect faster wage growth among those with more credentials, which has also not been happening in the past couple of years.
So, then what is it? One reason why employers may not feel compelled as of yet to raise wages is that the unemployment rate is overstating the strength of the labor market. There are still sidelined workers—not counted in the unemployment rate—who are returning to the labor market month after month in search of, and, in many cases, finding jobs. The simple fact of these would-be workers out there lowers the leverage today’s workers have to see faster wage growth from their employers.
Separate is still unequal: How patterns of occupational segregation impact pay for black women
August 7th is Black Women’s Equal Pay Day, the day that marks how long into 2018 an African American woman would have to work in order to be paid the same wages her white male counterpart was paid last year. On average, in 2017, black women workers were paid only 66 cents on the dollar relative to non-Hispanic white men, even after controlling for education, years of experience, and geographic location. A previous blog post dispels many of the myths behind why this pay gap exists, including the idea that the gap would be closed by black women getting more education or choosing higher paying jobs. In fact, black women earn less than white men at every level of education and even when they work in the same occupation. But even if changing jobs were an effective way to close the pay gap black women face—and it isn’t—more than half would need to change jobs in order to achieve occupational equity.
Figure A plots the “Duncan Segregation Index” (DSI) for black women and white men, overall and by education, based on individual occupation data from the American Community Survey (ACS). This is a common measure of occupational segregation, which, in this case identifies what percentage of working black women (or white men) would need to change jobs in order for black women and white men to be fully integrated across occupations. Values of the DSI can range from 0 percent (complete integration) to 100 percent (complete segregation).
As shown in Figure A, there has been little progress on reducing occupational segregation between black women and white men since 2000. From 2000 to 2016 (latest data year available), the DSI only changed from 59 percent to 56 percent. This means that on average, 56 percent of black women (or white men) would need to change occupations in order to achieve occupational equity, or full integration of these two groups in the workforce.
How do we know the tax cut isn’t working to boost wages? Investment, investment, investment
Earlier this week, my colleague Hunter Blair noted that economic data released over the past six months contained no real signs that any of the promised benefits of the Republican tax cut passed at the end of last year were showing up for workers. These benefits are certainly showing up for corporations and the wealthy households that own them—which makes sense, as the tax cut was overwhelmingly a tax cut for corporations. But the tax cut’s boosters promised that money corporations saved on taxes would quickly show up as higher wages for workers. In fact, they claimed this was happening so quickly that the tax cut was responsible for bonuses at the end of 2017 that were granted or announced before the tax cut actually became law.
As silly as those arguments were, a case that corporate tax cuts will lead to wage increases does exist in economics textbooks. The most crucial link in the chain leading from cutting corporations’ taxes to workers seeing higher paychecks runs through increased business investment in plants, equipment, and research. Essentially, lower corporate taxes are supposed to incentivize businesses to undertake more investment in productivity-enhancing plants, equipment, and research, and induce extra spending to finance these increased investments. This extra investment is supposed to lead to higher productivity, and hence to higher wages for workers. I should note that most of the links in this chain are broken, but for now, let’s just focus on the first—the effect of the tax cut in spurring business investment. If that fails, the whole case for tax cuts boosting wages fails.
The figure below shows the percent change in business investment relative to the same quarter in the previous year, with the vertical line showing when the tax cut was passed. The data is from the Bureau of Economic Analysis (BEA), National Income and Product Accounts (NIPA) Table 1.1.3. It is awfully hard to see a real regime change here in investment behavior.
What to Watch on Jobs Day: Wringing out every last bit of slack in the labor market
Two weeks ago, EPI released a paper by Estelle Sommeiller and Mark Price detailing, county-by-county, the rise in income inequality since the 1970s. Since the Great Recession, the top 1 percent of families have captured 41.8 percent of all income growth in the United States—and this disproportionate hoarding of economic growth is not unique to East Coast metropolises and Silicon Valley. All across the country, downward pressure on wages and incomes for most Americans has limited their ability to benefit from a growing economic pie. A decline in unionization and other deliberate policy choices that have reduced typical workers’ leverage and bargaining power in the labor market have contributed to these worrying trends.
Nonetheless, some experts still question why today’s relatively tighter economy isn’t bringing benefits to workers in the form of increased wages, given that we’ve seen relatively low unemployment rates over the course of the past two years—below 4.5 percent unemployment since March of last year. Josh Bivens reiterated this week EPI’s consistent stance that, “weak wage growth should make us think that by definition there is still slack in the labor market, and this might mean rethinking just how low unemployment can go.” Given this reality, policymakers (including the Fed) should stop attempting to slow the economy and allow the labor market to keep tightening, until there is consistent evidence that the benefits of a strong economy are being shared with a wide swath of the workforce. This includes many women of color who face pay gaps so large that they typically would need to work through the third or fourth quarter of another year just to earn as much as the average white man earned during the previous year. For black women, that date is next Tuesday, August 7.
In last month’s jobs report, we saw the unemployment rate tick up from 3.8 to 4.0, for positive reasons. The rise was accompanied by an increase in labor force entrants, suggesting workers are feeling optimistic about the jobs market and sidelined workers are indeed still being drawn back into the labor force. Looking at today’s prime-age employment-to-population ratio, which is still below the peaks of the last two business cycles, this is less surprising. As it has for most of the past several years, the low unemployment rate looks to be potentially overstating the strength of the labor market.
Tomorrow morning, we will continue to look at the unemployment rate, given its recent volatility, but we will also be watching nominal wage growth and the prime-age employment-to-population ratio for evidence that the economy continues to move closer to full employment.
The “wage puzzle” is real—but low inflation and low productivity are also puzzles that need to be solved
Jason Furman’s recent piece in Vox is drawing lots of comments (including one by me on a relatively minor issue). The last couple of months have seen lots of attention focused on relatively weak wage growth even in the face of low unemployment—sometimes referred to as the “wage puzzle.” I and others have argued that this weak wage growth should make us think that by definition there is still slack in the labor market, and this might mean rethinking just how low unemployment can go. Furman argues instead that wage growth is not that low, and that labor markets are tight indeed. A main piece of evidence he highlights to support this view is that both inflation and productivity growth have been low in recent years, and, adjusted for these two influences we really can’t expect wage growth to be any higher than it has been.
Furman is quick to note that his outlook does not demand rapid policy tightening to rein in growth. I’m definitely happy he says this. However, I do think any argument that concludes that the U.S. economy is unambiguously at full employment, and that the labor market is even tighter than the late 1990s, is going to give succor to those calling for the Federal Reserve to continue raising interest rates briskly to rein in growth.
This would be a mistake, and Furman’s arguments should certainly not sway anybody to call for continued policy tightening. He makes some good points, but I think he misreads what low inflation and low productivity are telling us. They are not just background variables that we have to take as given and adjust our wage expectations accordingly. Instead, low inflation and low productivity should be seen as signs of slack in and of themselves.
Last week’s GDP data shows there’s still no reason to think the TCJA’s corporate rate cuts are trickling down to workers
Last Friday, new data was released by the Bureau of Economic Analysis (BEA) with the headline being a 4.1 percent annualized rate of GDP growth. Supporters of the Tax Cuts and Jobs Act (TCJA) have pointed to this data point as proof that the tax cuts are working, though there’s little indication that economic growth has moved off its previous trend. But the release of new economic data does give us another chance to see what that data is telling us so far about the effects of the TCJA. The punchline is simple: the TCJA has already fattened up the incomes of capital owners and corporations in a measurable way, but there’s no indication at all that any of it threatens to trickle-down to workers.
The corporate sector is unsurprisingly where the clearest near-term effects of the TCJA can be seen. Domestic after-tax corporate profits increased from 6.7 percent of GDP in 2017 to 7.4 percent in the first quarter of 2018. In particular, undistributed domestic corporate profits surged in response to the TCJA’s tax windfall for multinational corporations on the profits they had booked offshore. As the chart below shows, much like the spike following the 2004 repatriation tax “holiday,” undistributed domestic corporate profits rose from 2.5 percent of gross domestic corporate value added in 2017 to 12 percent in the first quarter of 2018. We should note that 2004’s tax holiday didn’t lead to a surge in wage growth in subsequent years.
First quarter data from 2018 shows an enormous spike in undistributed profits: Undistributed domestic corporate profits as a percent of domestic corporate gross value added, 1979Q1-2018Q1
| Undistributed profits as a percent of corporate gross value added | |
|---|---|
| 1979Q1 | 4.71% |
| 1979Q2 | 4.39% |
| 1979Q3 | 4.05% |
| 1979Q4 | 3.70% |
| 1980Q1 | 2.84% |
| 1980Q2 | 1.73% |
| 1980Q3 | 2.42% |
| 1980Q4 | 3.02% |
| 1981Q1 | 3.30% |
| 1981Q2 | 3.57% |
| 1981Q3 | 4.13% |
| 1981Q4 | 3.74% |
| 1982Q1 | 3.15% |
| 1982Q2 | 4.05% |
| 1982Q3 | 3.70% |
| 1982Q4 | 3.05% |
| 1983Q1 | 3.35% |
| 1983Q2 | 3.88% |
| 1983Q3 | 4.08% |
| 1983Q4 | 4.39% |
| 1984Q1 | 5.08% |
| 1984Q2 | 5.02% |
| 1984Q3 | 5.17% |
| 1984Q4 | 5.39% |
| 1985Q1 | 5.15% |
| 1985Q2 | 4.77% |
| 1985Q3 | 5.37% |
| 1985Q4 | 4.36% |
| 1986Q1 | 3.72% |
| 1986Q2 | 3.08% |
| 1986Q3 | 2.83% |
| 1986Q4 | 2.34% |
| 1987Q1 | 2.62% |
| 1987Q2 | 2.98% |
| 1987Q3 | 3.45% |
| 1987Q4 | 3.18% |
| 1988Q1 | 3.80% |
| 1988Q2 | 3.43% |
| 1988Q3 | 2.91% |
| 1988Q4 | 3.62% |
| 1989Q1 | 2.09% |
| 1989Q2 | 2.15% |
| 1989Q3 | 2.13% |
| 1989Q4 | 1.75% |
| 1990Q1 | 1.48% |
| 1990Q2 | 1.81% |
| 1990Q3 | 1.01% |
| 1990Q4 | 0.92% |
| 1991Q1 | 1.49% |
| 1991Q2 | 1.57% |
| 1991Q3 | 1.59% |
| 1991Q4 | 1.31% |
| 1992Q1 | 1.54% |
| 1992Q2 | 1.50% |
| 1992Q3 | 1.36% |
| 1992Q4 | 1.66% |
| 1993Q1 | 1.53% |
| 1993Q2 | 1.99% |
| 1993Q3 | 2.30% |
| 1993Q4 | 2.54% |
| 1994Q1 | 3.09% |
| 1994Q2 | 3.24% |
| 1994Q3 | 3.40% |
| 1994Q4 | 3.55% |
| 1995Q1 | 3.30% |
| 1995Q2 | 3.46% |
| 1995Q3 | 3.71% |
| 1995Q4 | 3.75% |
| 1996Q1 | 4.14% |
| 1996Q2 | 4.04% |
| 1996Q3 | 3.91% |
| 1996Q4 | 3.97% |
| 1997Q1 | 4.25% |
| 1997Q2 | 4.20% |
| 1997Q3 | 4.38% |
| 1997Q4 | 3.92% |
| 1998Q1 | 2.83% |
| 1998Q2 | 2.85% |
| 1998Q3 | 3.16% |
| 1998Q4 | 2.69% |
| 1999Q1 | 3.04% |
| 1999Q2 | 2.94% |
| 1999Q3 | 2.57% |
| 1999Q4 | 1.82% |
| 2000Q1 | 1.37% |
| 2000Q2 | 1.08% |
| 2000Q3 | 0.87% |
| 2000Q4 | 0.46% |
| 2001Q1 | 0.57% |
| 2001Q2 | 1.00% |
| 2001Q3 | 0.33% |
| 2001Q4 | -0.29% |
| 2002Q1 | 1.38% |
| 2002Q2 | 1.56% |
| 2002Q3 | 2.06% |
| 2002Q4 | 2.36% |
| 2003Q1 | 2.66% |
| 2003Q2 | 1.88% |
| 2003Q3 | 2.66% |
| 2003Q4 | 2.41% |
| 2004Q1 | 2.92% |
| 2004Q2 | 3.34% |
| 2004Q3 | 3.51% |
| 2004Q4 | 1.22% |
| 2005Q1 | 3.24% |
| 2005Q2 | 4.83% |
| 2005Q3 | 6.26% |
| 2005Q4 | 8.40% |
| 2006Q1 | 3.79% |
| 2006Q2 | 3.40% |
| 2006Q3 | 3.22% |
| 2006Q4 | 1.40% |
| 2007Q1 | 2.11% |
| 2007Q2 | 2.38% |
| 2007Q3 | 0.99% |
| 2007Q4 | 1.16% |
| 2008Q1 | 0.88% |
| 2008Q2 | 0.66% |
| 2008Q3 | 2.14% |
| 2008Q4 | 1.91% |
| 2009Q1 | 1.01% |
| 2009Q2 | 1.53% |
| 2009Q3 | 3.22% |
| 2009Q4 | 3.84% |
| 2010Q1 | 4.38% |
| 2010Q2 | 4.73% |
| 2010Q3 | 5.10% |
| 2010Q4 | 4.57% |
| 2011Q1 | 3.40% |
| 2011Q2 | 4.51% |
| 2011Q3 | 4.52% |
| 2011Q4 | 4.69% |
| 2012Q1 | 4.49% |
| 2012Q2 | 4.78% |
| 2012Q3 | 4.17% |
| 2012Q4 | 2.56% |
| 2013Q1 | 4.60% |
| 2013Q2 | 4.71% |
| 2013Q3 | 3.49% |
| 2013Q4 | 4.75% |
| 2014Q1 | 2.65% |
| 2014Q2 | 3.81% |
| 2014Q3 | 4.97% |
| 2014Q4 | 4.75% |
| 2015Q1 | 3.63% |
| 2015Q2 | 3.37% |
| 2015Q3 | 3.65% |
| 2015Q4 | 2.47% |
| 2016Q1 | 3.33% |
| 2016Q2 | 2.18% |
| 2016Q3 | 2.48% |
| 2016Q4 | 2.00% |
| 2017Q1 | 2.17% |
| 2017Q2 | 2.24% |
| 2017Q3 | 3.06% |
| 2017Q4 | 2.58% |
| 2018Q1 | 12.04% |
Source: EPI analysis of data from table 1.14 from the National Income and Product Accounts (NIPA) from the Bureau of Economic Analysis (BEA).
Corporate tax revenues as a share of the economy fell by more than a third, from 1.8 percent of GDP in 2017 to 1.1 percent in the first quarter of 2018. This data makes it clear that the TCJA made some people very rich in the first quarter of 2018. (Second quarter corporate data has not been released yet.) Does Friday’s data on the overall economy show any indication that the corporate tax cuts have started to trickle down to workers as the Trump administration promised?
Nope, not at all. For one, wages haven’t budged. To be fair, no serious economist should have argued that wages are expected to respond immediately to corporate tax cuts. Though that didn’t keep TCJA supporters (including some economists willing to act unserious) from touting bonuses paid late last year as proof that the tax cuts were working as intended. It’s worth reminding ourselves of the economic chain of causation that leads from corporate tax cuts to wage growth. First, the direct benefits of corporate tax cuts flow entirely to shareholders. That part has definitely happened. Then, (as we’ve previously explained), higher after-tax profitability is supposed to incentivize firms to invest more, with those investments financed by the higher savings that households provide in response to higher returns. These investments in turn are supposed to give workers more and better tools to do their jobs, which boosts productivity and eventually that increase in productivity translates into wage growth.
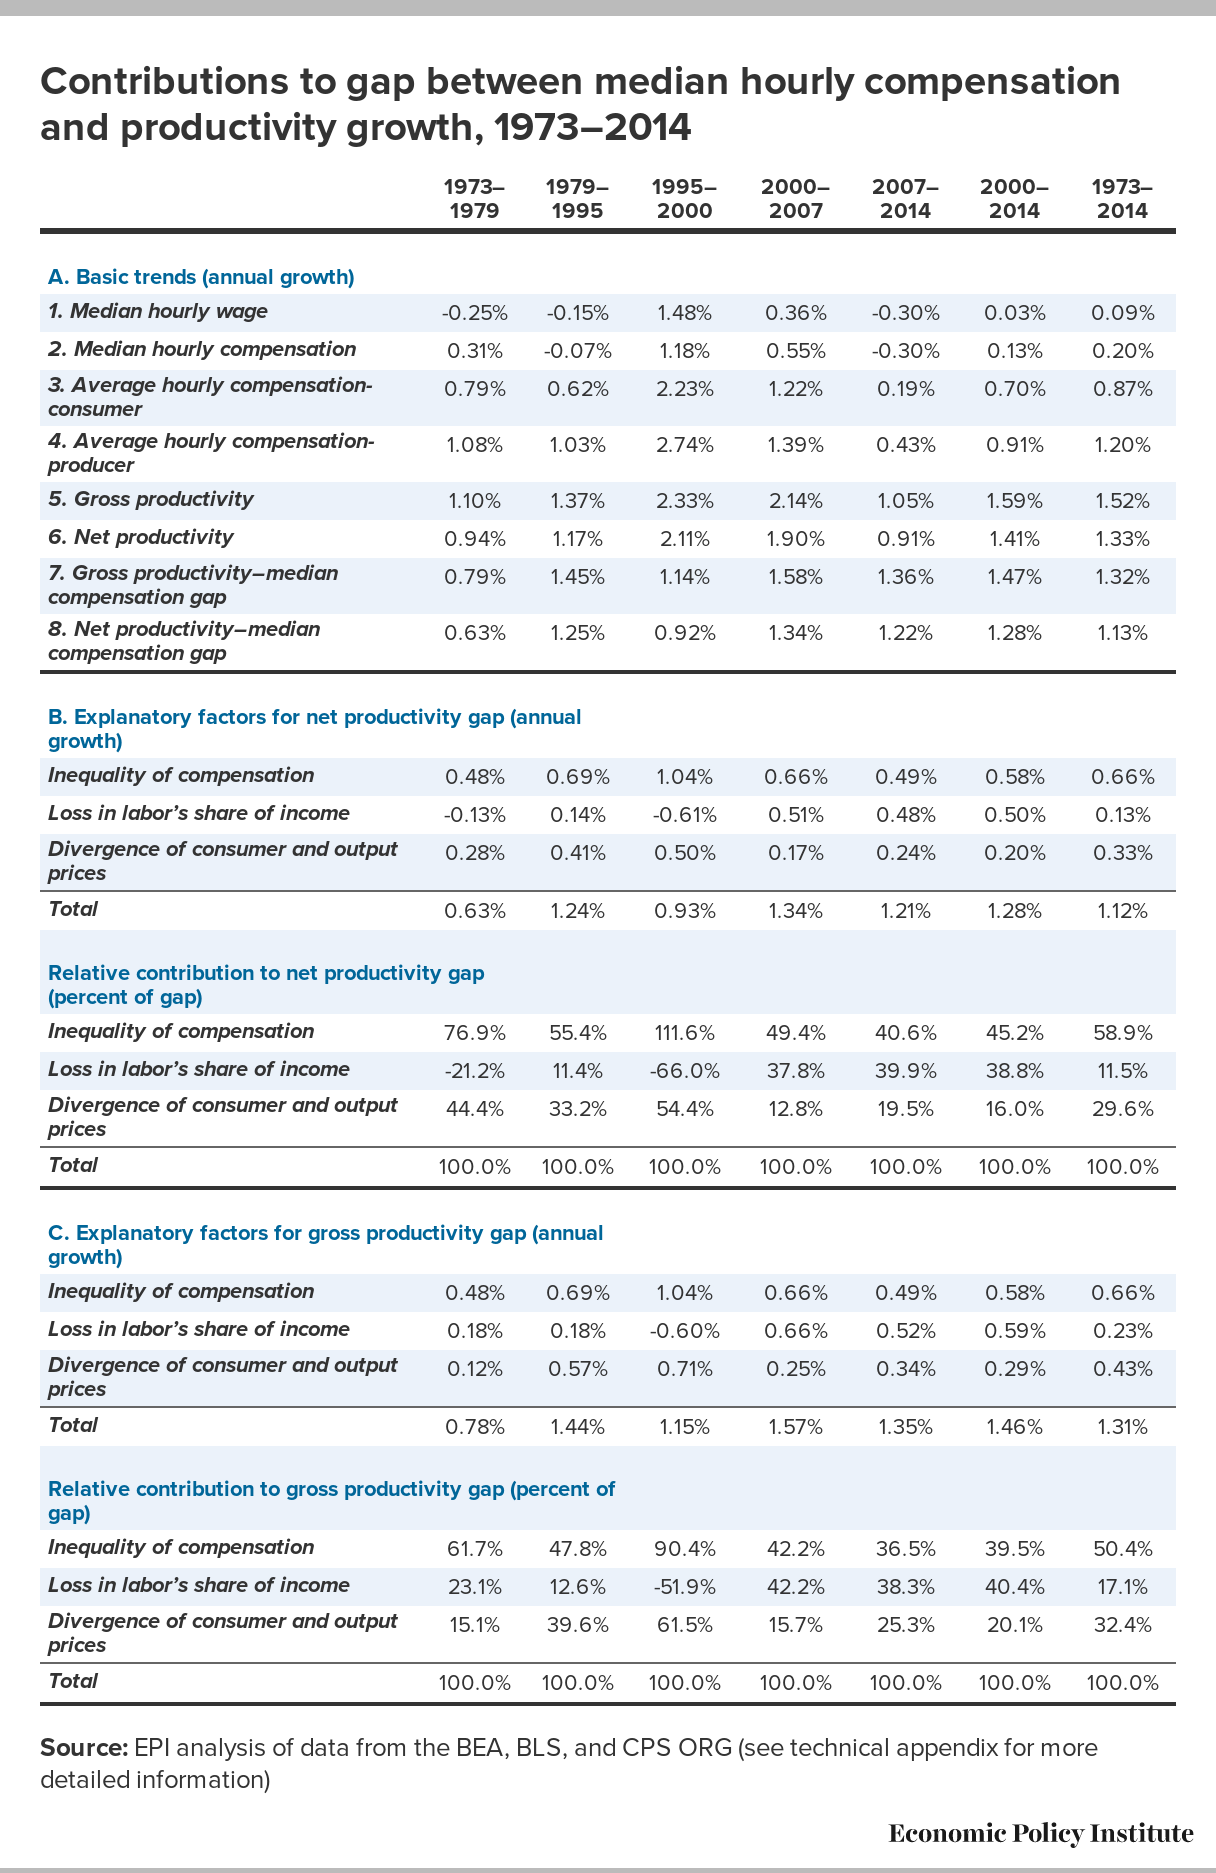
Nothing misleading about this: Typical workers’ pay and productivity have diverged
Jason Furman has an interesting piece on Vox today, claiming that the “puzzle” of weak wage growth in the face of low unemployment is not really a puzzle at all.
There’s a lot in this piece to agree with and a lot to quibble with. But, this post will just note one quick quibble. Furman describes a chart of ours—one we like a lot—as “misleading.” Here’s the full paragraph from him:
Productivity does a good job of explaining the evolution of average wage growth in the United States as well, especially prior to 2000. (But it does a decent job even since then, even with the wage slowdown.) From the end of World War II until around 2000 average wages grew almost lock-step with productivity — if you use the same measure of inflation for both concepts, so the comparison is apples to apples. Often, presentations of the comparison between wages and productivity, as in this much-reproduced graphic, use a higher inflation measure to adjust wages than productivity and thus produce a misleading impression.
This is a criticism we’ve seen, and addressed, before, so forgive me if I seem a tad sensitive on this, but I want to be really clear: there is nothing misleading about our presentation of this data. The wedge we show between our measure of pay and economy-wide productivity is indeed driven overwhelmingly by rising inequality and not the differing deflators. In this figure we measure the pay of typical workers, not average wages. We define “typical” as either the median worker (the one in the middle of the wage distribution) or the average pay of production and non-supervisory workers (a group consisting of about 80 percent of the private-sector workforce). We don’t use average pay precisely because, as Jason notes, average pay kept up pretty well with economy-wide productivity pre-2000. This means that the bulk of the rise in inequality over that time was driven by inequality within wages, or the divergence between average and typical pay (as we clearly show—see the previous link).
Does America’s monopoly problem mean that high-pressure labor markets can’t boost wages?
Last week, I wrote a piece on why the erosion of workers’ labor market leverage does not imply that genuine full employment won’t be accompanied by wage growth. It was in response to questions about why wages in the United States weren’t growing faster given that unemployment is pretty low in historical terms. The punchline of the discussion was pretty clear: the definition of full employment is wages rising fast enough to put upward pressure on the Federal Reserve’s inflation target. If wages aren’t rising this fast, then we aren’t at full employment. The eroding relative labor market leverage power of workers does not change this.
Another reason often given for slow wage growth in the face of relatively low unemployment is rising monopolization. Does monopoly change any of the calculus I sketched out above? Almost surely not.
To be really clear on this, I’m more-than-sympathetic to the view that the U.S. economy has a monopoly problem. Empirical research clearly shows upticks in industry concentration ratios, and a number of large and crucial economic sectors (health care and finance, in particular) are characterized by immense pricing power of producers. Other sectors (mostly technology) have also seen waves of consolidation that have not led (yet?) to rapid price growth, but have raised a whole host of concerns about the intersection of economic and political power.
A long spell of very low unemployment would raise wages—even in the face of employers’ monopsony power
Probably the most-asked question about the U.S. economy in recent months has been “why aren’t wages growing faster?” For years during the slow recovery from the Great Recession of 2008–09, the reason why wages weren’t growing fast enough was pretty clear: the labor market had too much “slack”, represented by the millions of potential workers sidelined by the crisis who were queuing up to take any available job. The big bargaining chip workers have when negotiating for higher wages is the threat to quit and find another job. This threat isn’t very credible when alternative work is hard to find and there are multiple workers who would jump at the chance to take your current job.
But because unemployment has dropped below pre-Great Recession levels, many have decided that labor slack can’t be the cause of subdued wage growth anymore. So, the search for causes of sluggish wage growth that are not labor slack has begun. Two (potentially related) suspects accused in recent months have been an erosion of workers’ labor market leverage (sometimes referred to as growing monopsony power on the part of employers) and rising monopolization. This post will discuss the first one, one tomorrow will tackle monopoly.
Two punchlines to this discussion are simple enough to highlight:
Why is wage growth so slow? It’s not because low-wage jobs are being added disproportionately
Despite an unemployment rate that averaged 4.1 percent over the last 12 months, the average real (inflation-adjusted) wage of private sector workers did not grow at all over this period. Part of the reason is an increase in energy prices, which is likely to be temporary, but our slow wage growth has mostly been driven by nominal wages failing to rise quickly even in the face of low unemployment.
One explanation worth looking into is whether today’s low wage growth is due to a composition effect—i.e. low-wage jobs being added faster than middle- and/or high-wage jobs and, as a result, pulling down wage growth.
Composition was certainly a factor during the early part of the recovery from the Great Recession. In the first few years of the recovery, the jobs being added were very disproportionately low-wage jobs, which had the effect of pulling wage growth down over that period. But since 2013, as the recovery has strengthened, the opposite has been true—low-wage jobs are actually declining on net while middle and high wage jobs are being added, which has the effect of raising average wages. In other words, the composition effect is currently putting upward pressure on wages.
Why is real wage growth anemic? It’s not because of a skills shortage
Despite an unemployment rate at 4.1 percent or less since last October, wage growth has been anemic. In fact, over the last year, the average real wage of private sector workers saw no growth at all. While the total lack of growth in inflation-adjusted (real) wages over the last year is due in part to an increase in energy prices that is likely temporary, the slow real wage growth we’ve seen in recent years is mostly driven by nominal wages failing to rise quickly even in the face of low unemployment.
Some have posited that our far-less-than-stellar wage growth right now could be due to workers not having the skills employers need. But that idea has the logic backwards. When employers can’t find workers with the skills they need at the wages they are offering, they will raise wages in order to attract qualified workers—if employers can’t find the workers they need among the unemployed, they will offer higher wages in an attempt to poach needed workers from other firms, who will then raise wages in an attempt to keep their workers, and so on. In other words, if there are skills shortages, we should see signs of faster wage growth for workers with needed skills. This fast wage growth for skilled workers should push up average wages, not weigh them down. Since we continue to see anemic average wage growth, not just slow wage growth for select groups of workers, it’s clear that there is not a widespread shortage of the types of workers (i.e., those with the right skills) that employers need.
But we certainly hear widespread employer complaints about not being able to find workers. Why? One reason is monopsony power in the U.S. labor market. There is a lot of evidence that many firms have monopsony power, either because of a limited number of buyers of labor or other sources beyond labor market concentration. When firms have monopsony power, they are able to pay workers less than what their work is “worth,” i.e. less than their marginal product. But a key dynamic of monopsony power is that even though monopsonists would like to hire more workers, the low wages they offer mean they can’t attract more workers unless they pay more. That is, it is a normal state of affairs for a firm with monopsony power to wish they could hire more workers at the wages they are offering, but to be unable to attract additional workers because their wages are too low. So when a firm with the power to set wages below a workers’ marginal product complains about not being able to find workers at the wages they are offering, it’s useful to remember that they are choosing to keep wages low in order to increase profits—which remain high as a share of corporate sector income—and could get more workers by simply raising wages. And importantly, when firms with monopsony power complain about not being able to find workers, it is not adequate evidence of a skills shortage.
Average wage growth continues to flatline in 2018, while low-wage workers and those with relatively lower levels of educational attainment see stronger gains
Real (inflation-adjusted) average hourly wages from the Current Employment Statistics (CES) survey did not grow at all between June 2017 and June 2018. This is not only troubling, but mildly surprising given the historically low unemployment rate of 4.0 percent. Some of this real wage stagnation can be explained by an uptick in energy prices, but even the underlying pace of nominal wage growth has yet to pick up in the way it historically has as labor markets tightened. It’s likely that the unemployment rate is overstating the strength of the economy given still soft labor force participation and the prime-age employment-to-population ratio. Even so, a steadily improving economy should eventually translate into stronger wage growth. And, if there were any thoughts that those tax cuts were going to lead to faster wage growth, which was doubtful in the first place, zero wage growth certainly isn’t a compelling case.
But the CES is only one measure of wage growth. Its large sample size and benchmarking make it one of the most reliable measures, but it only provides information on average wages for very large groups of workers (all workers or the 82 percent who are non-supervisory). The Current Population Survey-Outgoing Rotation Group (CPS-ORG) allows us to see what’s happening at different parts of the wage distribution and for workers with varying levels of educational attainment. Because of the volatility in the CPS-ORG, we’ve constructed annual averages for the year ending in June of each year, combining first half data in the stated year with second half data in the prior year. All wages are in first half 2018 dollars. Using this metric, real average hourly wages in the CPS-ORG grew 1.2 percent between 2017 and 2018. Table 1 below shows real wages by wage percentile for 2000, 2007, 2017, and 2018, with annualized changes between each set of years shown at the bottom of the table.
Hourly wages by wage percentile, 2000–2018 (FH2018 dollars)
| Wage by percentile | ||||||||||
|---|---|---|---|---|---|---|---|---|---|---|
| Year | 10th | 20th | 30th | 40th | 50th | 60th | 70th | 80th | 90th | 95th |
| 2000 | $9.09 | $11.20 | $13.11 | $15.10 | $17.89 | $20.97 | $24.80 | $30.05 | $39.23 | $50.07 |
| 2007 | $9.30 | $11.36 | $13.27 | $15.61 | $18.20 | $21.54 | $25.41 | $31.12 | $41.87 | $53.82 |
| 2017 | $9.85 | $11.44 | $13.47 | $15.60 | $18.63 | $21.96 | $26.45 | $33.41 | $46.19 | $60.95 |
| 2018 | $10.06 | $11.90 | $13.89 | $15.95 | $18.72 | $22.00 | $26.56 | $33.62 | $46.49 | $62.26 |
| Annualized percent change | ||||||||||
| 2000–2007 | 0.3% | 0.2% | 0.2% | 0.5% | 0.2% | 0.4% | 0.3% | 0.5% | 0.9% | 1.0% |
| 2007–2018 | 0.7% | 0.4% | 0.4% | 0.2% | 0.3% | 0.2% | 0.4% | 0.7% | 1.0% | 1.3% |
| 2017–2018 | 2.2% | 4.0% | 3.1% | 2.3% | 0.5% | 0.2% | 0.4% | 0.6% | 0.7% | 2.2% |
| 2000–2018 | 0.6% | 0.3% | 0.3% | 0.3% | 0.3% | 0.3% | 0.4% | 0.6% | 0.9% | 1.2% |
Note: The xth-percentile wage is the wage at which x% of wage earners earn less and (100-x)% earn more.
Sample based on all workers ages 18–64. Each year represents annual data, calculated using the first-half data in the listed year combined with the second-half data for the prior year.
Source: EPI analysis of Current Population Survey microdata
Real hourly wage growth over the last year is relatively polarized, with the strongest growth among the bottom 40 percent of workers along with those at the 95th percentile. More broad based growth, with particularly strength at the bottom of the wage distribution, is expected as we continue to move toward full employment. When the unemployment rate falls, even as more workers are drawn into the labor market, available workers of all types become scarcer and employers have to increase wages to attract and retain the workers they want. Lower unemployment has, in the past, benefited low-wage workers more than middle-wage workers and middle-wage more than higher-wage workers. In addition, in the last three to four decades of growing inequality, high-wage workers have had more leverage to bid up their wages faster than others. That trend has continued through the 2000s.Read more
What to Watch on Jobs Day: Public sector jobs are threatened by austerity and attacks on collective bargaining
Last week, the U.S. Supreme Court ruled on Janus v. AFSCME Council 31. The Court’s 5-4 decision bars unions from requiring state and local government workers who benefit from union representation to pay their fair share of that representation. As a result, public sector unions will be up against a classic free rider problem, in which all the workers in a bargaining unit will be legally entitled to union representation, even if they don’t pay a penny for the benefits and services the union provides. This decision will have profound implications for all state and local government workers throughout the country, not just the share covered by a union contract.
To get a sense of the number of workers directly affected by this decision, let’s take a look at state and local government employment. According to the Current Employment Statistics survey, there are nearly 20 million state and local workers in the economy today. This represents about 13 percent of the overall workforce. The majority of these state and local workers are in the education sector. State and local education workers top 10 million, representing 53 percent of all state and local government workers.
At the same time as attacks on public sector collective bargaining erode compensation and job quality, austerity has held back employment and wage growth. State and local workers—such as the teachers in West Virginia and Oklahoma who were recently protesting not just their low wages but lack of funding in the classroom—have already been hammered by years of austerity policy at all levels of government. In states like Wisconsin, tax cuts for the most well off in the early 2010s were financed by the layoffs and cuts to public employees’ wage and benefits. As of the beginning of this school year, local public education employment was still lower than it was before the Great Recession, and much lower than where it could be if employment had kept up with the growth in school enrollment. This means, in this past school year, we experienced a shortfall of over 300,000 public educators.
Social Security data confirm same old pattern: Self-employment headcount has risen but economic impact remains small
One indication of the growth of self-employment activity has been the rise in the number of people filing Schedule C income and self-employment earnings in their annual tax filings. This growth has been cited to illustrate the escalation of self-employment and to suggest that Bureau of Labor Statistics (BLS) measures of self-employment are missing an important phenomenon. Tracking headcounts of tax filings, however, does not adequately reflect trends in the economic impact of self-employment since, as this analysis shows, most of the growth is activity for supplementary incomes.
Our analysis of self-employment earnings data from the Social Security Administration (SSA) through 2015 (the latest data) confirms previous general findings regarding Uber drivers, independent work, all online demand platform work, nonemployer establishments, and independent contractors more generally. These previous findings are:
- The number of people involved in these types of work activity has increased;
- The increase is primarily among people who are doing so to earn supplementary income and for a short amount of hours. The increase in the various self-employment activities has not occurred in people’s “main job” or as their main source of income; and
- The economic scale of these activities has not changed much when measured as a share of economy-wide total hours worked, earnings, or compensation. While headcount measures of self-employment activity do show a large increase, the overall economic impact of this activity is relatively small in scale and growth.
The following table summarizes SSA data through 2015, the most recent year available, by “type of earnings”, meaning it distinguishes between those with regular W-2 earnings and those with self-employment earnings: the data show the number of individuals with each type of income and the amount of earnings from each type of earnings. Note that in any given year or at any particular point in time, workers can have income both from regular W-2 employment and from self-employment. One indication of this is that the sum of W-2 filers and the self-employed exceeds the total number of workers, indicating that about 40 percent of self-employed also filed a W-2.Read more
Janus decision is not about union finances—it’s about working people’s finances
Today, the Supreme Court issued its final opinions from October Term 2017. This ends a particularly devastating term for working people—and for our democracy. One of the most troubling elements of the decisions impacting workers is the court’s repeated undermining of workers’ ability to act collectively in addressing workplace issues. This can be seen in the both Epic Systems Corp. and Janus. Corporate interests have long fought to erode the right of workers’ to join together. The Supreme Court certainly advanced this attack this term.
It is likely that the small group of foundations with ties to the largest and most powerful corporate lobbies that are behind the Janus case feel validated by today’s opinion that shamefully safeguards their interests by contorting the First Amendment. However, this victory will be short lived. Working people in this country know that the economy is not working for them. Today’s decision is likely to make that more true, but at the same time, it has already made workers’ right to a union and collective bargaining a topic covered by cable news and in newspapers throughout the country—a feat in and of itself. As was seen in the reaction to the teachers’ strikes in West Virginia, Oklahoma, and beyond, when issues of economic justice and workers’ rights are put front and center, the interests of the wealthy few rarely prevail.
Much will be said of Janus and its impact on unions—particularly union finances. But today’s decision is really about working people’s finances—our wages and our benefits. Unions provide a means for working people to come together and ensure that we are paid fairly and treated with dignity on the job. Unions are fundamental to a fair economy. Union membership cuts not just across political party affiliation, but also across race, gender, and ethnicity, ensuring that often marginalized voices are represented. Unions also provide an effective, organized voice for working people in our political process—helping to win minimum wage increases and civil rights protections for all working people. Today, millions of men and women in this country are union members, and millions more view unions favorably. Over half of all Americans say that the decline in union representation has been bad for working people in the United States. The Supreme Court today focused on fair share fees, but the focus going forward must be on a fair economy for working people and unions are clearly a critical part of that fight.
Workers of color are far more likely to be paid poverty-level wages than white workers
Marking the 50th anniversary of the 1968 Poor People’s Campaign, EPI has described the potential to reduce poverty through work, provided there are jobs with decent wages and adequate hours available to everyone who can and wants to work. Unfortunately, even when jobs are available, workers are often paid so little that they can still be left in poverty. Today, one in nine U.S. workers are paid wages that would leave them in poverty for their family size if they are the sole earner in their family—even with a full-time, year-round schedule.
Although the share of workers earning poverty wages has declined over the past three decades, there are still large racial and ethnic differences in the shares of workers being paid at adequate wage levels. As shown in the first figure below, workers of color are far more likely to be paid poverty-level wages than white workers. In 2017, 8.6 percent of white workers were paid poverty wages—i.e., hourly wages that would leave them below the federal poverty guideline for their family size if they are the sole earner in the family, even if they work full-time, year-round. In contrast, 19.2 percent—nearly one in five—Hispanic workers were paid poverty wages, and 14.3 percent—roughly one in seven—black workers were paid poverty wages. Asian or Pacific Islander workers also had higher poverty-wage rates than white workers, at 10.9 percent.
Workers of color are far more likely to be paid poverty-level wages than white workers: Share of workers earning poverty-level wages, by race/ethnicity, 1986–2017
| Year | White | Black | Hispanic | Asian/P.I. |
|---|---|---|---|---|
| 1986 | 15.4% | 23.5% | 28.3% | |
| 1987 | 14.6% | 22.5% | 27.7% | |
| 1988 | 14.4% | 21.8% | 26.9% | |
| 1989 | 13.5% | 21.0% | 26.6% | 16.8% |
| 1990 | 14.5% | 22.7% | 30.2% | 18.3% |
| 1991 | 14.4% | 22.7% | 30.7% | 18.7% |
| 1992 | 14.6% | 22.4% | 30.9% | 19.2% |
| 1993 | 14.4% | 22.1% | 31.2% | 18.6% |
| 1994 | 14.8% | 22.3% | 33.1% | 19.3% |
| 1995 | 14.8% | 21.8% | 34.2% | 20.0% |
| 1996 | 13.9% | 22.0% | 32.2% | 19.9% |
| 1997 | 13.9% | 21.8% | 33.5% | 20.4% |
| 1998 | 12.6% | 18.7% | 30.8% | 18.3% |
| 1999 | 12.0% | 18.2% | 29.6% | 17.1% |
| 2000 | 10.8% | 16.2% | 28.1% | 15.4% |
| 2001 | 10.4% | 16.0% | 27.1% | 13.4% |
| 2002 | 10.3% | 15.3% | 26.5% | 14.2% |
| 2003 | 10.0% | 14.6% | 24.7% | 12.8% |
| 2004 | 10.7% | 15.0% | 26.0% | 14.1% |
| 2005 | 10.2% | 15.5% | 25.6% | 13.7% |
| 2006 | 9.8% | 14.1% | 24.3% | 12.2% |
| 2007 | 9.9% | 14.7% | 23.9% | 12.5% |
| 2008 | 10.1% | 15.1% | 23.0% | 13.0% |
| 2009 | 11.1% | 15.2% | 25.6% | 12.5% |
| 2010 | 10.5% | 14.7% | 26.0% | 13.1% |
| 2011 | 10.6% | 14.9% | 25.3% | 13.1% |
| 2012 | 11.2% | 16.6% | 26.6% | 14.4% |
| 2013 | 11.0% | 16.4% | 26.1% | 14.0% |
| 2014 | 11.1% | 17.8% | 24.6% | 13.1% |
| 2015 | 10.7% | 16.8% | 24.9% | 14.0% |
| 2016 | 9.6% | 15.4% | 21.0% | 11.8% |
| 2017 | 8.6% | 14.3% | 19.2% | 10.9% |
Notes: A “poverty-level wage” is a wage that would leave a full-time, year-round worker below the federal poverty guideline for their family size if they are the sole earner in the family. Poverty wage thresholds are specific to each family size, and family sizes are calculated using the total number of people in each family or subfamily within the CPS data. The "Asian or Pacific Islander" race category is only available beginning in 1989.
Source: EPI analysis of Current Population Survey Outgoing Rotation Group microdata
Among workers of all races and ethnicities, the shares being paid poverty wages have declined from highs reached in either the mid-1980s or the mid-1990s. However, the share of black workers earning poverty wages in 2017 (14.3 percent) was still slightly above where it was in 2006 (14.1 percent.) Black workers are the only group for whom the share receiving poverty wages is not at its lowest level on record.
Notably, racial gaps have been remarkably consistent—if not gotten worse—over time. The share of black workers earning poverty-level wages has consistently been 1.5 times that of white workers for the entirety of the series. The ratio of the Hispanic poverty-wage rate to the white poverty-wage rate has actually grown since the 1980s. In 1986, the share of Hispanic workers earning poverty-level wages was 1.8 times that of white workers; in 2017, it was 2.2 times the share of white workers.Read more
Nonemployer establishments grew in 2016 but their real revenues were stable: This confirms other data on self-employment showing more activity, but little economic impact
Last week’s release of the new Bureau of Labor Statistics (BLS) Contingent Worker Survey (CWS) has renewed public interest in tracking the number of self-employed or independent contractors. Today’s release of the U.S. Census nonemployer establishment data for 2016 provides another useful data point about the trends in self-employment.
Our analysis of these new nonemployer establishment data affirm the pattern seen through 2015. As we wrote yesterday: these data confirm previous general findings regarding Uber drivers, all online demand platform work, and independent contractors more generally. These previous findings are:
- There is an increase in the amount of people involved in self-employment or online platform types of work activity;
- The increase is primarily among people who are doing so to earn supplementary income and for a short amount of hours. The increase in the various self-employment activities has not occurred in people’s “main job” or as their main source of income; and
- The economic scale of these activities has not increased greatly when measured as a share of hours worked or compensation earned. While “headcount” measures do show a large increase, the overall economic impact is relatively small.
As we show, there has been a significant increase in the headcount of nonemployer establishments. However, the economic impact, as measured by the share of nonemployer establishment revenues in total revenues, has not increased in roughly 20 years. Nonemployer establishments grew by 2.0 percent from 2015 to 2016 but their real revenues grew by just 0.2 percent, evidence of a very small economic impact. In fact, over the medium term there has been a slight decline in the nonemployer establishment share of all revenue between 2007 and 2016, from 3.3 to 3.1 percent of all revenue. This indicates that the growth of nonemployer establishments seems to reflect the growth of self-employed individuals operating unincorporated businesses that generate very little revenue, including the period since 2011 when Uber, Lyft, and other online platform work expanded rapidly.Read more
Has self-employment surged? Data on nonemployer establishments confirm other data showing more activity, but not much economic impact
Update: Read the analysis of 2016 nonemployer establishment data.
Last week’s release of the new Bureau of Labor Statistics (BLS) Contingent Worker Survey (CWS) has renewed public interest in tracking the number of self-employed or independent contractors. The upcoming release of the U.S. Census nonemployer establishment data for 2016 this Thursday will provide another useful data point about the trends in self-employment.
Our analysis of nonemployer establishment data through 2015 indicates that these data confirm previous general findings regarding Uber drivers, all online demand platform work, and independent contractors more generally. These previous findings are:
- There is an increase in the amount of people involved in these types of work activity;
- The increase is primarily among people who are doing so to earn supplementary income and for a short amount of hours. The increase in the various self-employment activities has not occurred in people’s “main job” or as their main source of income; and
- The economic scale of these activities has not increased greatly when measured as a share of hours worked or compensation earned. While “headcount” measures do show a large increase, the overall economic impact is relatively small.
As we will show, there has been a significant increase in the headcount of nonemployer establishments. However, the economic impact, as measured by the share of nonemployer establishment revenues in total revenues, has not increased in roughly 20 years. This indicates that the growth of nonemployer establishments seems to reflect the growth of self-employed individuals operating unincorporated businesses that generate very little revenue.
Background on CWS and nonemployer data
The CWS is based on a household survey and showed that in 2017, the share of independent contractors in total employment was 6.9 percent, comparable to what was reported in all of the other CWS surveys back to 1995. This has elicited surprise by many observers, especially those that have touted the explosion of gig work or freelancing.
The release of new Census data on nonemployer establishments for 2016 this month provides another opportunity to track these trends. These Census data capture the phenomenon of self-employment by examining business establishment/firm data rather than asking individual workers or households about employment. Census describes the data as:
“data for businesses that have no paid employees and are subject to federal income tax. Most nonemployers are self-employed individuals operating unincorporated businesses (known as sole proprietorships), which may or may not be the owner’s principal source of income.”
Various analysts have used these data to track the rise of self-employment with many arguing that the rapid rise of nonemployer establishments reflect a surge of self-employment and gig work. Abraham et al. (2017) note that the growth of nonemployer establishments was faster than self-employment in the Current Population Survey (CPS). They cite this evidence (along with tax records) as being consistent with the argument that the CPS is missing some of the growth of in self-employment, pointing out that nonemployer establishments “have trended upwards as a percent of the number of earners.” Steve King of Emergent Research, a leading analyst of gig and “independent worker” trends, has also said that nonemployer data are “a useful general indicator of U.S. self-employment.”
All of the analyses we have seen of these data solely focus on headcount measures, tracking the number of nonemployer establishments, and do not examine the economic impact, as we do in our analysis by examining the revenues of nonemployer establishments.
This may be surprising since the Census used to (but now does not) warn data users of the following:
“The majority of all business establishments in the United States are nonemployers, yet these firms average less than 4 percent of all sales and receipts nationally. Due to their small economic impact, these firms are excluded from most other Census Bureau business statistics.”Read more
How big is AI-related employment? Not that big at all—despite what Stanford’s AI Index Annual Report tries to claim
There is much discussion about the potential for artificial intelligence (AI) to transform our workplaces, possibly leading to fewer overall jobs and greater economic inequality in the future. This discussion has always made me wonder to what extent AI is already being used to produce goods and services. So, I was excited to learn about the AI Index from reading the recent Furman and Seamans paper on “AI and the Economy.” Furman and Seamans write: “The AI index, a non-profit project designed to track activity and progress in AI, provides a number of interesting facts designed to track the scientific progress in and impact of artificial intelligence and robotics.” I was even more excited to see the AI index reporting on “the growth of the share of US jobs requiring AI skills.” However, my excitement soon ended when I realized that the information they offered completely obscured the (lack of) importance of the underlying data, and I have to reluctantly conclude that the AI index offers extremely misleading hype on AI jobs rather than useful information. I am getting tired of overhyped phenomena, so this blog post is to alert the public.
The AI Index highlights the fact that “the share of jobs requiring AI skills in the US has grown 4.5x since 2013” (see the graph below). That sounds like a huge explosion of jobs related to AI, right? But exactly how many jobs are they talking about being AI-related now compared with in the past? One cannot tell from their information, because while it shows the growth in the share of AI jobs, it provides no information of the level of these shares (either now or in the past). I am always careful to not present data showing the percent changes of percentages, because this is often misleading. For example, when a share rises from 1 percentage point to 2 percentage points, it has risen 100 percent. If a share rises from 20 percentage points to 22 percentage points, it has only risen by 10 percent. Yet in the latter example the change in the level of the share is twice as large (2 percentage points, compared to 1). So what does it tell us about the share of AI jobs in the economy today to tell us that this share has grown 350 percent, without telling us the initial level of the share? Absolutely nothing.
CEO pay: Still not related to performance
This post originally appeared on the CEPR blog.
Earlier this year we did an analysis of CEO compensation in the health insurance industry to see if it was affected by the cap on deductibility imposed by the Affordable Care Act (ACA). One of the provisions of the ACA limited the amount of CEO pay that health insurers could deduct on their taxes to $500,000, beginning in 2013.
This provision effectively raised the cost of CEO pay to insurers by more than 50 percent. Prior to 2013, the deduction in effect meant that the government was picking up 35 cents of every dollar of CEO pay, while the companies were paying just 65 cents. 1 With the new provision in place, insurers are now paying 100 cents of every dollar of CEO pay in excess of $500,000.
If the pay reflects the value of the CEO to the company, we should expect this change to reduce the pay of CEOs in the insurance industry. For example, if a CEO gets paid $20 million a year, this should mean that she delivers roughly $20 million in additional value to shareholders.
When the CEO’s pay was fully deductible, the $20 million paid to the CEO actually only cost the company $13 million. This would presumably be the number that matters to shareholders since they care about how much money comes out of their pockets, not the number on the CEO’s paycheck.
Why is wealthy Westport trying to gut police pensions?
Police in Westport, Connecticut are resisting an attempt to slash their pension and partially replace it with a 401(k)-style plan. Such a move would mess with a tried-and-true system that promotes secure and orderly retirement, in favor of an inefficient one that harms workers with no benefit to taxpayers.
Westport is a latecomer to a trend that appears to have nearly run its course. A few years ago, the Wall Street Journal praised San Jose Mayor Chuck Reed for taking an axe to police and other public employee pensions. Along with Rhode Island Treasurer (later Governor) Gina Raimondo, Reed had become a public face of the pension gutting movement, leading a statewide initiative backed by hedge fund billionaires. Reed and Raimondo, both Democrats, were lauded by conservative think tanks and the Journal for taking on public-sector unions, ignoring the fact that they were courting more powerful interests—the financial industry and wealthy donors.
Similar initiatives followed in Dallas, Memphis, and Palm Beach, among other places. But as the Journal reported last year, in an apparent change of heart, cities that slashed police pensions were later forced to restore benefits or spend millions on retention bonuses in efforts to stem outflows of experienced officers. In Palm Beach, for example, 24 mid-career police officers left in the four-year period after the city cut police and firefighter pensions and partly replaced them with 401(k)-style plans, compared with just one mid-career officer in the previous four years. The exodus of police and firefighters to neighboring jurisdictions caused the city to incur millions in additional training and overtime costs. Five years later, the city reversed course, restoring pension benefits and dropping the 401(k)-style plans.
Social Security trustees report shows why we should expand the program—not look for excuses to cut it
There’s no real news in the Social Security trustees report released this afternoon. We’re now a year closer to the date the trust fund will be exhausted, 2034 (same as last year’s projection), at which point current revenues will still be sufficient to cover 77 percent of benefits even if nothing is done to shore up the system’s finances. Each year, the release of the trustees report provides an occasion for Social Security scaremongering by those wanting to shrink our social insurance system. But not only can we afford current benefits, we can afford to expand them.
The average retired worker beneficiary receives an annual benefit of $16,933. Disability and survivor benefits are even more modest. Social Security benefits are replacing a declining share of income at retirement, thanks to a rising normal retirement age and increased taxation of benefits—cuts passed in 1983 that are gradually taking effect (an increase in the retirement age is really just an across-the-board benefit cut that can be offset by retiring later). Rising Medicare premiums, which are deducted from Social Security, also reduce net benefits.
Despite these trends, recent Census research has found that retirees are somewhat better off than previously thought, thanks to income from traditional defined benefit pensions that is underreported in household surveys. Nevertheless, Social Security remains by far the most important source of income for most seniors. It constitutes most of the income of seniors in the bottom half of the income distribution and is the single biggest source of income for all but those in the ninth and tenth income deciles, for whom defined benefit pensions and earned income loom larger.
Seven facts about tipped workers and the tipped minimum wage
As debate continues on a referendum to raise the tipped minimum wage in Washington, D.C., to the minimum wage for nearly all other workers, we wanted to take a few minutes to set the record straight on the facts about tipped worker wages and incomes. Currently, eight states do not have differential treatments of the tipped workforce in terms of the minimum wage.1 Throughout this post, these will be referred to as “equal treatment” states. To be clear, tipped workers in these equal treatment states receive the full, regular state minimum wage plus tips.
Over the last several years, there has been a great deal of research about the minimum wage and tipped restaurant workers, in particular, and we are going to draw on some of that research to make several key points: 1. In the District of Columbia, women, African American, and Hispanic workers are disproportionately minimum wage workers, including tipped minimum wage workers; 2. Maintaining a separate, lower minimum wage for tipped workers perpetuates racial and gender inequities; 3. In states that have a lower tipped minimum wage, tipped workers have worse economic outcomes and higher poverty rates than their counterparts in equal treatment states; 4. Tipped work is overwhelmingly low-wage work, even in D.C.; 5. Wage theft is particularly acute in food and drink service, and restaurants across the country have been found to be in violation of wage and hour laws; 6. Waitstaff have higher take-home pay in equal treatment states than in D.C.; and 7. The restaurant industry thrives in equal treatment states.
Here, we take a closer look at each point:
1. Women, African Americans, and Hispanic workers have disproportionately benefited from minimum wage increases in Washington, D.C. Furthermore, contrary to popular opinion, the vast majority of minimum-wage earners are not teenagers or college students working part-time jobs.
2. Research indicates that having a separate, lower minimum wage for tipped workers perpetuates racial and gender inequities, and results in worse economic outcomes for tipped workers. Forcing service workers to rely on tips for their wages creates tremendous instability in income flows, making it more difficult to budget or absorb financial shocks. Furthermore, research has also shown that the practice of tipping is often discriminatory, with white service workers receiving larger tips than black service workers for the same quality of service.