An Open Letter to Sec. of Labor Tom Perez
An open letter to Secretary of Labor Tom Perez and Wage and Hour Administrator David Weil
Dear Mr. Secretary:
Several newspapers and journals, including Computerworld and the L.A. Times, have reported that Southern California Edison (SCE), a public utility, has laid off hundreds of its U.S. employees and replaced them with H-1B guestworkers employed by the India-based IT services firms Infosys and Tata Consultancy Services. As my colleague, Ron Hira, has written, “Adding to the injustice, American workers losing their jobs are being forced to do “knowledge transfers,” an ugly euphemism that means being forced to train your own foreign replacement.”
As you know, the law (the Immigration and Nationality Act) forbids the hiring of H-1B temporary foreign guestworkers whose employment would “adversely affect the wages and working conditions of U.S. workers comparably employed.” Clearly, taking away the jobs, wages and benefits of the laid-off SCE employees does adversely affect their wages and working conditions.
You have authority under the Immigration and Nationality Act to investigate this case, but I have seen no announcement that you intend to do so or that you share my sense of outrage that the H-1B program is being abused in such an egregious way. I hope that we will soon learn that the Department of Labor intends to investigate and remedy this harm to skilled U.S. workers who have pursued education and training in a technical field, worked hard, and played by the rules. Our government should, at the very least, ensure that its programs, including its visa programs, are not used to destroy the careers and financial security of its people.
Sincerely,
Ross Eisenbrey
Vice President
Economic Policy Institute
Wage Theft by Employers is Costing U.S. Workers Billions of Dollars a Year
Rampant wage theft in the United States is a huge problem for struggling workers. Surveys reveal that the underpayment of owed wages can reduce affected workers’ income by 50 percent or more. Most recently, a careful study of minimum wage violations in New York and California in 2011 commissioned by the U.S. Department of Labor (DOL) determined that the affected employees’ lost weekly wages averaged 37–49 percent of their income. This wage theft drove between 15,000 and 67,000 families below the poverty line. Another 50,000–100,000 already impoverished families were driven deeper into poverty.
The extensive weekly minimum wage violations uncovered by the DOL study in California and New York alone amount to an estimated $1.6 billion–$2.5 billion over the course of a full year. Given that the combined population of California and New York is 18.5 percent of the U.S. total, it is reasonable to estimate that minimum wage violations nationwide amount to at least $8.6 billion a year, and as much as $13.8 billion a year. On the one hand, violations in these two states might be less frequent because the wage and hour enforcement effort in New York and California is greater than in most states and violations might be deterred (Florida, for example, does not have a state labor department). But on the other hand, their large immigrant populations might increase the prevalence of wage theft—the DOL study found that non-citizens were 1.6 to 3.1 times more likely to suffer from a minimum wage violation.
The DOL study vastly understates the total impact of wage theft because it reported only on minimum wage violations, which are more frequent than overtime violations but usually involve smaller per violation dollar amounts than many overtime pay violations. A bookkeeper, for example, earning an annual salary of $45,000, who works 10 hours of unpaid overtime a week might lose $325, whereas a minimum wage worker forced to work “off-the-clock” unpaid for 10 hours would lose “only” $72.50, or ten times the state minimum wage if it were higher than the federal minimum. (Overtime violations are very frequent among low wage workers: a 2009 study found that on a weekly basis, 19 percent of front-line workers in low wage industries were cheated out of overtime pay to which they were entitled.)
DOL’s new study shows the need for much greater efforts to ensure employer compliance. Helpfully, the president has called for increases in the budget and staffing of the Wage and Hour Division, but Congress should revisit the obsolete penalties for non-compliance: repeated or willful violations of the minimum wage and overtime requirements are subject to a maximum fine of only $1,100.
A Milestone Week for Apple’s Stock, but Not its Workers
This week was a milestone for Apple. As its stock continues to rise, its market cap exceeded $700 billion—the largest valuation ever achieved by any U.S. company. This milestone, however, must be viewed with considerably less admiration after one takes a close look at its new “supplier responsibility” report. The report reveals important information about one of the less appetizing ingredients of Apple’s vast success: the continued mistreatment of the workers who make its products. The report shows that widespread labor rights violations can still be found in Apple’s massive supply chain, and that Apple continues to obfuscate these realities in its public communications on the subject.
Apple fails to report that its own data shows that labor practices are getting worse in several important areas. In its new report, which covers 2014, Apple says that in 92 percent of cases, the workweeks of the employees in its supply chain fell below its 60 hours per week standard. Apple fails to report that this compliance rate is down from the 2013 compliance rate of 95 percent. In 2014, Apple found that the overall labor rights compliance rate in the area of Health and Safety was 70 percent; it fails to state that this is down from the 2013 compliance rate of 77 percent. Notably, while Apple fails to report prior year data on those issues, which reveal negative trends, the report does provide such data on other topics—those where this year’s data is better than that of prior years.
The effects of Apple’s reforms are often dubious and overstated by the company. For example, in reporting that 92 percent of the time workers in its supply chain are working less than 60 hours per week, Apple ignores the fact that workweeks at its Chinese factories still consistently break Chinese law, which restricts workweeks to less than 50 hours and which Apple has repeatedly pledged to uphold. The average workweek Apple reports still exceeds this legal limit by a substantial margin. Apple also continues to make the remarkable claim that nearly all its suppliers have achieved freedom of association (the right to organize unions and bargain collectively), saying its suppliers achieved 96 percent compliance with this standard. As Apple is aware, such freedom is non-existent in China. Independent unions are illegal. Workers who try to form them go to jail. Moreover, the information available about a program run by the Fair Labor Association (FLA), which was supposedly going to provide a greater voice for Apple’s workers (within the cramped confines of Chinese law), indicates it has fallen woefully short of its stated goals. Further, Apple touts training programs under which, according to the company, 2.3 million workers were trained in labor rights in 2014. This is a large number, to be sure; unfortunately, it is the suppliers themselves, not worker rights advocates or worker representatives (and not even Apple or its new training academy), that provide this training—and Apple provides no substantive information on its actual content or impact. Independent reports indicate that this management-provided training may be entirely cursory. (Apple’s repudiation of the use of bonded foreign labor was a positive step, but does not address the much larger, multi-faceted problem within Apple’s supply chain in China of the excessive use of domestic labor hired through dispatch agencies.)
Less Than Half the Truth: Jobs and Wages in Export Industries
Trade is a hot topic on Capitol Hill this year. President Obama has asked members of Congress for “fast track” trade promotion authority in order to finalize proposed trade deals with Asia and Europe that set the stage for growing, trade-related job displacement. One of the president’s core, frequently repeated arguments for these trade and investment deals is that “our businesses export more than ever, and exporters tend to pay their workers higher wages.” But that’s less than half the story. Trade is a two-way street, and talking about exports without considering imports is like keeping score in a baseball game by counting only the runs scored by the home team. It might make you feel good, but it won’t tell you who’s winning the game. Sadly, when it comes to trade and wages, trade is driving down the average wages of American workers because the United States runs large trade deficits with the world as a whole, including many countries in Asia and Europe—the regions targeted in current trade negotiations.
A case in point is provided by U.S. trade with China, which was responsible for nearly half (46.5 percent) of our $736.8 billion goods trade deficit in 2014. Jobs in industries exporting to China did pay well in 2009-2011 (the last years for which we have complete wage data)—an average of $872.89 per week, or 10.3 percent more than workers making non-traded goods and services (who earned only $791.14 per week), as shown in the figure below. However, workers in import-competing industries were paid even better—an average of $1,021.66 per week, or 29.1 percent more than workers in non-traded industries.
Congress and President Obama Cannot Sit Idly By While Companies Use H-1B Guestworkers to Replace American Workers
A recent investigation by Computerworld revealed that hundreds of information technology (IT) workers were laid off by Southern California Edison (SCE) and replaced with temporary foreign workers through the H-1B guestworker visa program, which allows employers to hire temporary foreign workers for up to six years if they have at least a college degree (most work in IT). The replacement H-1B workers are employed by two India-based IT services firms that specialize in outsourcing and offshoring U.S. jobs: Infosys and Tata Consultancy Services. While U.S. Sen. Jeff Sessions (R-Ala.) and Rep. Darrell Issa (R-Calif.) have publicly criticized the move, it doesn’t look like any action will be taken to reverse it.
SCE describes itself as “one of the nation’s largest electric utilities…deliver[ing] power to more than 14 million people.” SCE earned net profits of $1.4 billion on $13.2 billion in revenues over the past year. The company’s stock price is up 10 percent over that time and it pays its investors a 4.8 percent yield in dividends. An observer could be forgiven for believing that a job delivering safe and reliable power to homes in the United States might be reasonably safe from being offshored to India or even outsourced to temporary foreign workers. But he or she would be mistaken. In fact, the SCE case is just one more example in a long line of cases in which American workers are being replaced by H-1B workers.
Adding to the injustice, American workers losing their jobs are being forced to do “knowledge transfers,” an ugly euphemism that means being forced to train your own foreign replacement.
Americans should be outraged that most of our politicians sit idly by while outsourcing firms hijack the nation’s temporary foreign worker programs. Unpublished H-1B data from United States Citizenship and Immigration Services reveals the scale of the problem: A majority of H-1B visas are now being used by firms that displace American workers and facilitate the offshoring of high-wage jobs.
The Unemployed Exceed Job Openings in Almost Every Industry
One of the recurring myths following the Great Recession has been that recovery in the labor market has lagged because workers don’t have the right skills. The figure below, which shows the number of unemployed workers and the number of job openings in December by industry, is a useful way to examine this idea. If today’s labor market woes were the result of skills shortages or mismatches, we would expect to see some sectors where there are more unemployed workers than job openings, and others where there are more job openings than unemployed workers. What we find, however, is that there are more unemployed workers than jobs openings in almost every industry.
The notable exception is health care and social assistance, which has been consistently adding jobs throughout the business cycle. There is now one unemployed worker for every job opening in that sector, suggesting a tighter labor market for those workers. However, we have yet to see any sign of decent wage gains yet, which would be the final indicator that the labor market, at least for those workers, were approaching reasonable health.
Other sectors have seen little-to-no improvement in their job-seekers-to-job-openings ratios. There are still about six unemployed construction workers for every job opening. In other words, despite claims from some employers, there is no shortage of construction workers.
Taken as a whole, these numbers demonstrate that the main problem in the labor market is a broad-based lack of demand for workers—not available workers lacking the skills needed for the sectors with job openings.
Unemployed and job openings, by industry (in millions)
| Industry | Unemployed | Job openings |
|---|---|---|
| Professional and business services | 1.0833 | 0.8846 |
| Health care and social assistance | 0.7053 | 0.7228 |
| Retail trade | 1.0993 | 0.4843 |
| Accommodation and food services | 0.9564 | 0.5871 |
| Government | 0.6781 | 0.4474 |
| Finance and insurance | 0.2590 | 0.2308 |
| Durable goods manufacturing | 0.4543 | 0.1803 |
| Other services | 0.3686 | 0.1476 |
| Wholesale trade | 0.1610 | 0.1525 |
| Transportation, warehousing, and utilities | 0.3565 | 0.1648 |
| Information | 0.1535 | 0.0992 |
| Construction | 0.7621 | 0.1273 |
| Nondurable goods manufacturing | 0.3002 | 0.1084 |
| Educational services | 0.2298 | 0.0793 |
| Real estate and rental and leasing | 0.1139 | 0.0569 |
| Arts, entertainment, and recreation | 0.2117 | 0.0698 |
| Mining and logging | 0.0524 | 0.0293 |
Note: Because the data are not seasonally adjusted, these are 12-month averages, January 2014–December 2014.
Source: EPI analysis of data from the Job Openings and Labor Turnover Survey and the Current Population Survey
Layoffs and Quits Hold Steady in December
The hires, quits, and layoffs rates all held fairly steady in the December Job Openings and Labor Turnover Survey (JOLTS). As you can see in the figure below, layoffs shot up during the recession but recovered quickly and have been at prerecession levels for more than three years. The fact that this trend continued in December is a good sign. That said, not only do layoffs need to come down before we see a full recovery in the labor market, but hiring needs to pick up. While the hires rate has been generally improving, it’s still below its prerecession level.
The voluntary quits rate had been flat since February (1.8 percent), and saw a modest spike up in September to 2.0 percent, before falling to 1.9 percent in October and holding steady through December. A larger number of people voluntarily quitting their jobs indicates a strong labor market—one where workers are able to leave jobs that are not right for them and find new ones. In December, the quits rate was still 9.2 percent lower than it was in 2007, before the recession began.
Over the year, the quits rate has averaged 1.8 percent, an improvement over its average rate of 1.4 percent in 2009 and 2010. Each consecutive year has seen modest improvement, an average increase in the quits rate of 0.1 percentage points per year. Before long, we should look for a return to pre-recession levels of voluntary quits, which would mean that fewer workers are locked into jobs they would leave if they could.
Hires, quits, and layoff rates, December 2000–December 2014
| Month | Hires rate | Layoffs rate | Quits rate |
|---|---|---|---|
| Dec-2000 | 4.1% | 1.4% | 2.3% |
| Jan-2001 | 4.4% | 1.6% | 2.6% |
| Feb-2001 | 4.1% | 1.4% | 2.5% |
| Mar-2001 | 4.2% | 1.6% | 2.4% |
| Apr-2001 | 4.0% | 1.5% | 2.4% |
| May-2001 | 4.0% | 1.5% | 2.4% |
| Jun-2001 | 3.8% | 1.5% | 2.3% |
| Jul-2001 | 3.9% | 1.5% | 2.2% |
| Aug-2001 | 3.8% | 1.4% | 2.1% |
| Sep-2001 | 3.8% | 1.6% | 2.1% |
| Oct-2001 | 3.8% | 1.7% | 2.2% |
| Nov-2001 | 3.7% | 1.6% | 2.0% |
| Dec-2001 | 3.7% | 1.4% | 2.0% |
| Jan-2002 | 3.7% | 1.4% | 2.2% |
| Feb-2002 | 3.7% | 1.5% | 2.0% |
| Mar-2002 | 3.5% | 1.4% | 1.9% |
| Apr-2002 | 3.8% | 1.5% | 2.1% |
| May-2002 | 3.8% | 1.5% | 2.1% |
| Jun-2002 | 3.7% | 1.4% | 2.0% |
| Jul-2002 | 3.8% | 1.5% | 2.1% |
| Aug-2002 | 3.7% | 1.4% | 2.0% |
| Sep-2002 | 3.7% | 1.4% | 2.0% |
| Oct-2002 | 3.7% | 1.4% | 2.0% |
| Nov-2002 | 3.8% | 1.5% | 1.9% |
| Dec-2002 | 3.8% | 1.5% | 2.0% |
| Jan-2003 | 3.8% | 1.5% | 1.9% |
| Feb-2003 | 3.6% | 1.5% | 1.9% |
| Mar-2003 | 3.4% | 1.4% | 1.9% |
| Apr-2003 | 3.6% | 1.6% | 1.8% |
| May-2003 | 3.5% | 1.5% | 1.8% |
| Jun-2003 | 3.7% | 1.6% | 1.8% |
| Jul-2003 | 3.6% | 1.6% | 1.8% |
| Aug-2003 | 3.6% | 1.5% | 1.8% |
| Sep-2003 | 3.7% | 1.5% | 1.9% |
| Oct-2003 | 3.8% | 1.4% | 1.9% |
| Nov-2003 | 3.6% | 1.4% | 1.9% |
| Dec-2003 | 3.8% | 1.5% | 1.9% |
| Jan-2004 | 3.7% | 1.5% | 1.9% |
| Feb-2004 | 3.6% | 1.4% | 1.9% |
| Mar-2004 | 3.9% | 1.4% | 2.0% |
| Apr-2004 | 3.9% | 1.5% | 2.0% |
| May-2004 | 3.8% | 1.4% | 1.9% |
| Jun-2004 | 3.8% | 1.4% | 2.0% |
| Jul-2004 | 3.7% | 1.4% | 2.0% |
| Aug-2004 | 3.9% | 1.5% | 2.0% |
| Sep-2004 | 3.8% | 1.4% | 2.0% |
| Oct-2004 | 3.9% | 1.4% | 2.0% |
| Nov-2004 | 3.9% | 1.5% | 2.1% |
| Dec-2004 | 4.0% | 1.5% | 2.1% |
| Jan-2005 | 3.9% | 1.4% | 2.1% |
| Feb-2005 | 3.9% | 1.4% | 2.0% |
| Mar-2005 | 3.9% | 1.5% | 2.1% |
| Apr-2005 | 4.0% | 1.4% | 2.1% |
| May-2005 | 3.9% | 1.4% | 2.1% |
| Jun-2005 | 3.9% | 1.5% | 2.1% |
| Jul-2005 | 3.9% | 1.4% | 2.0% |
| Aug-2005 | 4.0% | 1.4% | 2.2% |
| Sep-2005 | 4.0% | 1.4% | 2.3% |
| Oct-2005 | 3.8% | 1.3% | 2.2% |
| Nov-2005 | 3.9% | 1.2% | 2.2% |
| Dec-2005 | 3.7% | 1.3% | 2.1% |
| Jan-2006 | 3.9% | 1.3% | 2.1% |
| Feb-2006 | 3.9% | 1.3% | 2.2% |
| Mar-2006 | 3.9% | 1.2% | 2.2% |
| Apr-2006 | 3.8% | 1.3% | 2.1% |
| May-2006 | 4.0% | 1.4% | 2.2% |
| Jun-2006 | 3.9% | 1.2% | 2.2% |
| Jul-2006 | 3.9% | 1.3% | 2.2% |
| Aug-2006 | 3.8% | 1.2% | 2.2% |
| Sep-2006 | 3.8% | 1.3% | 2.1% |
| Oct-2006 | 3.8% | 1.3% | 2.1% |
| Nov-2006 | 4.0% | 1.3% | 2.3% |
| Dec-2006 | 3.8% | 1.3% | 2.2% |
| Jan-2007 | 3.8% | 1.2% | 2.2% |
| Feb-2007 | 3.8% | 1.3% | 2.2% |
| Mar-2007 | 3.8% | 1.3% | 2.2% |
| Apr-2007 | 3.7% | 1.3% | 2.1% |
| May-2007 | 3.8% | 1.3% | 2.2% |
| Jun-2007 | 3.8% | 1.3% | 2.0% |
| Jul-2007 | 3.7% | 1.3% | 2.1% |
| Aug-2007 | 3.7% | 1.3% | 2.1% |
| Sep-2007 | 3.7% | 1.5% | 1.9% |
| Oct-2007 | 3.8% | 1.4% | 2.1% |
| Nov-2007 | 3.7% | 1.4% | 2.0% |
| Dec-2007 | 3.6% | 1.3% | 2.0% |
| Jan-2008 | 3.5% | 1.3% | 2.0% |
| Feb-2008 | 3.5% | 1.4% | 2.0% |
| Mar-2008 | 3.4% | 1.3% | 1.9% |
| Apr-2008 | 3.5% | 1.3% | 2.1% |
| May-2008 | 3.3% | 1.3% | 1.9% |
| Jun-2008 | 3.5% | 1.5% | 1.9% |
| Jul-2008 | 3.3% | 1.4% | 1.8% |
| Aug-2008 | 3.3% | 1.6% | 1.7% |
| Sep-2008 | 3.1% | 1.4% | 1.8% |
| Oct-2008 | 3.3% | 1.6% | 1.8% |
| Nov-2008 | 2.9% | 1.6% | 1.5% |
| Dec-2008 | 3.2% | 1.8% | 1.6% |
| Jan-2009 | 3.1% | 1.9% | 1.5% |
| Feb-2009 | 3.0% | 1.9% | 1.5% |
| Mar-2009 | 2.8% | 1.8% | 1.4% |
| Apr-2009 | 2.9% | 2.0% | 1.3% |
| May-2009 | 2.8% | 1.6% | 1.3% |
| Jun-2009 | 2.8% | 1.6% | 1.3% |
| Jul-2009 | 2.9% | 1.7% | 1.3% |
| Aug-2009 | 2.9% | 1.6% | 1.3% |
| Sep-2009 | 3.0% | 1.6% | 1.3% |
| Oct-2009 | 2.9% | 1.5% | 1.3% |
| Nov-2009 | 3.1% | 1.4% | 1.4% |
| Dec-2009 | 2.9% | 1.5% | 1.3% |
| Jan-2010 | 3.0% | 1.4% | 1.3% |
| Feb-2010 | 2.9% | 1.4% | 1.3% |
| Mar-2010 | 3.2% | 1.4% | 1.4% |
| Apr-2010 | 3.1% | 1.3% | 1.5% |
| May-2010 | 3.4% | 1.3% | 1.4% |
| Jun-2010 | 3.1% | 1.5% | 1.5% |
| Jul-2010 | 3.2% | 1.6% | 1.4% |
| Aug-2010 | 3.0% | 1.4% | 1.4% |
| Sep-2010 | 3.1% | 1.4% | 1.4% |
| Oct-2010 | 3.1% | 1.3% | 1.4% |
| Nov-2010 | 3.2% | 1.4% | 1.4% |
| Dec-2010 | 3.2% | 1.4% | 1.5% |
| Jan-2011 | 3.0% | 1.3% | 1.4% |
| Feb-2011 | 3.1% | 1.3% | 1.4% |
| Mar-2011 | 3.2% | 1.3% | 1.5% |
| Apr-2011 | 3.2% | 1.3% | 1.5% |
| May-2011 | 3.1% | 1.3% | 1.5% |
| Jun-2011 | 3.3% | 1.4% | 1.5% |
| Jul-2011 | 3.1% | 1.3% | 1.5% |
| Aug-2011 | 3.2% | 1.3% | 1.5% |
| Sep-2011 | 3.3% | 1.3% | 1.5% |
| Oct-2011 | 3.2% | 1.3% | 1.5% |
| Nov-2011 | 3.2% | 1.3% | 1.5% |
| Dec-2011 | 3.2% | 1.3% | 1.5% |
| Jan-2012 | 3.2% | 1.2% | 1.5% |
| Feb-2012 | 3.3% | 1.3% | 1.6% |
| Mar-2012 | 3.3% | 1.2% | 1.6% |
| Apr-2012 | 3.2% | 1.4% | 1.6% |
| May-2012 | 3.3% | 1.4% | 1.6% |
| Jun-2012 | 3.2% | 1.3% | 1.6% |
| Jul-2012 | 3.2% | 1.2% | 1.6% |
| Aug-2012 | 3.3% | 1.4% | 1.6% |
| Sep-2012 | 3.1% | 1.3% | 1.4% |
| Oct-2012 | 3.2% | 1.3% | 1.5% |
| Nov-2012 | 3.3% | 1.3% | 1.6% |
| Dec-2012 | 3.2% | 1.2% | 1.6% |
| Jan-2013 | 3.2% | 1.2% | 1.7% |
| Feb-2013 | 3.4% | 1.2% | 1.7% |
| Mar-2013 | 3.2% | 1.3% | 1.6% |
| Apr-2013 | 3.3% | 1.3% | 1.6% |
| May-2013 | 3.3% | 1.3% | 1.6% |
| Jun-2013 | 3.2% | 1.2% | 1.6% |
| Jul-2013 | 3.3% | 1.2% | 1.7% |
| Aug-2013 | 3.4% | 1.2% | 1.7% |
| Sep-2013 | 3.4% | 1.3% | 1.7% |
| Oct-2013 | 3.3% | 1.1% | 1.8% |
| Nov-2013 | 3.3% | 1.1% | 1.8% |
| Dec-2013 | 3.3% | 1.2% | 1.8% |
| Jan-2014 | 3.3% | 1.2% | 1.7% |
| Feb-2014 | 3.4% | 1.2% | 1.8% |
| Mar-2014 | 3.4% | 1.2% | 1.8% |
| Apr-2014 | 3.5% | 1.2% | 1.8% |
| May-2014 | 3.4% | 1.2% | 1.8% |
| Jun-2014 | 3.5% | 1.2% | 1.8% |
| Jul-2014 | 3.6% | 1.2% | 1.8% |
| Aug-2014 | 3.4% | 1.2% | 1.8% |
| Sep-2014 | 3.6% | 1.2% | 2.0% |
| Oct-2014 | 3.7% | 1.3% | 1.9% |
| Nov-2014 | 3.6% | 1.2% | 1.9% |
| Dec-2014 | 3.7% | 1.2% | 1.9% |
Note: Shaded areas denote recessions. The hires rate is the number of hires during the entire month as a percent of total employment. The layoff rate is the number of layoffs and discharges during the entire month as a percent of total employment. The quits rate is the number of quits during the entire month as a percent of total employment.
Source: EPI analysis of Bureau of Labor Statistics Job Openings and Labor Turnover Survey
Job Openings Were Stronger in 2014 than 2013 or 2012, but We Have Still Not Fully Recovered
The number of job openings hit 5.0 million in December, according to this morning’s Job Openings and Labor Turnover Summary (JOLTS)—a slight increase from 4.8 million in November. Meanwhile, according to the Census’s Current Population Survey, there was a slight drop in people looking for work, to 8.7 million. Taken together, this means there were 1.7 times as many job seekers as job openings in December—the lowest this ratio has been since November 2007.
This slight decline in the jobs-seekers-to-job-openings ratio is a continuation of its steady decrease, since its high of 6.8-to-1 in July 2009, as you can see in the figure below. If the economy were stronger, the ratio would be even smaller—a 1-to-1 ratio would mean that there were roughly as many job openings as job seekers—but this indicates that we are moving in the right direction.
With the December data, we can also look at what’s happened throughout 2014, compared to the rest of the recovery. The job-seekers-to-jobs-openings ratio has been consistently falling, from a high of 5.9 percent in 2009 down to an average of 2.1 percent average in 2014. The average annual ratio fell 0.8 over the last year.
While the outlook for jobless workers is clearly improving, the job-seekers-to-jobs-openings ratio fails to account for the full extent of declines in labor force participation over the course of the recovery. 8.7 million unemployed workers understates how many job openings will be needed when a robust jobs recovery finally begins, due to the 6.1 million potential workers (in December) who are currently not in the labor market, but who would be if job opportunities were strong. Many of these “missing workers” will go back to looking for a job when the labor market picks up, so job openings will be needed for them, too.
The job-seekers ratio, December 2000–December 2014
| Month | Unemployed job seekers per job opening |
|---|---|
| Dec-2000 | 1.1 |
| Jan-2001 | 1.1 |
| Feb-2001 | 1.3 |
| Mar-2001 | 1.3 |
| Apr-2001 | 1.3 |
| May-2001 | 1.4 |
| Jun-2001 | 1.5 |
| Jul-2001 | 1.5 |
| Aug-2001 | 1.7 |
| Sep-2001 | 1.8 |
| Oct-2001 | 2.1 |
| Nov-2001 | 2.3 |
| Dec-2001 | 2.3 |
| Jan-2002 | 2.3 |
| Feb-2002 | 2.4 |
| Mar-2002 | 2.3 |
| Apr-2002 | 2.6 |
| May-2002 | 2.4 |
| Jun-2002 | 2.5 |
| Jul-2002 | 2.5 |
| Aug-2002 | 2.4 |
| Sep-2002 | 2.5 |
| Oct-2002 | 2.4 |
| Nov-2002 | 2.4 |
| Dec-2002 | 2.8 |
| Jan-2003 | 2.3 |
| Feb-2003 | 2.5 |
| Mar-2003 | 2.8 |
| Apr-2003 | 2.8 |
| May-2003 | 2.8 |
| Jun-2003 | 2.8 |
| Jul-2003 | 2.8 |
| Aug-2003 | 2.7 |
| Sep-2003 | 2.9 |
| Oct-2003 | 2.7 |
| Nov-2003 | 2.6 |
| Dec-2003 | 2.5 |
| Jan-2004 | 2.5 |
| Feb-2004 | 2.4 |
| Mar-2004 | 2.5 |
| Apr-2004 | 2.4 |
| May-2004 | 2.2 |
| Jun-2004 | 2.4 |
| Jul-2004 | 2.1 |
| Aug-2004 | 2.2 |
| Sep-2004 | 2.1 |
| Oct-2004 | 2.1 |
| Nov-2004 | 2.3 |
| Dec-2004 | 2.1 |
| Jan-2005 | 2.2 |
| Feb-2005 | 2.1 |
| Mar-2005 | 2.0 |
| Apr-2005 | 1.9 |
| May-2005 | 2.0 |
| Jun-2005 | 1.9 |
| Jul-2005 | 1.8 |
| Aug-2005 | 1.8 |
| Sep-2005 | 1.8 |
| Oct-2005 | 1.8 |
| Nov-2005 | 1.7 |
| Dec-2005 | 1.7 |
| Jan-2006 | 1.7 |
| Feb-2006 | 1.7 |
| Mar-2006 | 1.6 |
| Apr-2006 | 1.6 |
| May-2006 | 1.6 |
| Jun-2006 | 1.6 |
| Jul-2006 | 1.8 |
| Aug-2006 | 1.6 |
| Sep-2006 | 1.5 |
| Oct-2006 | 1.5 |
| Nov-2006 | 1.5 |
| Dec-2006 | 1.5 |
| Jan-2007 | 1.6 |
| Feb-2007 | 1.5 |
| Mar-2007 | 1.4 |
| Apr-2007 | 1.5 |
| May-2007 | 1.5 |
| Jun-2007 | 1.5 |
| Jul-2007 | 1.6 |
| Aug-2007 | 1.6 |
| Sep-2007 | 1.6 |
| Oct-2007 | 1.7 |
| Nov-2007 | 1.7 |
| Dec-2007 | 1.8 |
| Jan-2008 | 1.8 |
| Feb-2008 | 1.9 |
| Mar-2008 | 1.9 |
| Apr-2008 | 2.0 |
| May-2008 | 2.1 |
| Jun-2008 | 2.3 |
| Jul-2008 | 2.4 |
| Aug-2008 | 2.6 |
| Sep-2008 | 3.0 |
| Oct-2008 | 3.1 |
| Nov-2008 | 3.4 |
| Dec-2008 | 3.7 |
| Jan-2009 | 4.4 |
| Feb-2009 | 4.6 |
| Mar-2009 | 5.4 |
| Apr-2009 | 6.1 |
| May-2009 | 6.0 |
| Jun-2009 | 6.2 |
| Jul-2009 | 6.8 |
| Aug-2009 | 6.5 |
| Sep-2009 | 6.2 |
| Oct-2009 | 6.5 |
| Nov-2009 | 6.3 |
| Dec-2009 | 6.1 |
| Jan-2010 | 5.5 |
| Feb-2010 | 6.0 |
| Mar-2010 | 5.8 |
| Apr-2010 | 5.0 |
| May-2010 | 5.1 |
| Jun-2010 | 5.3 |
| Jul-2010 | 5.0 |
| Aug-2010 | 5.0 |
| Sep-2010 | 5.2 |
| Oct-2010 | 4.8 |
| Nov-2010 | 4.9 |
| Dec-2010 | 5.0 |
| Jan-2011 | 4.8 |
| Feb-2011 | 4.6 |
| Mar-2011 | 4.4 |
| Apr-2011 | 4.5 |
| May-2011 | 4.5 |
| Jun-2011 | 4.3 |
| Jul-2011 | 4.0 |
| Aug-2011 | 4.3 |
| Sep-2011 | 3.9 |
| Oct-2011 | 4.0 |
| Nov-2011 | 4.2 |
| Dec-2011 | 3.7 |
| Jan-2012 | 3.5 |
| Feb-2012 | 3.7 |
| Mar-2012 | 3.3 |
| Apr-2012 | 3.5 |
| May-2012 | 3.4 |
| Jun-2012 | 3.3 |
| Jul-2012 | 3.5 |
| Aug-2012 | 3.4 |
| Sep-2012 | 3.4 |
| Oct-2012 | 3.2 |
| Nov-2012 | 3.2 |
| Dec-2012 | 3.4 |
| Jan-2013 | 3.3 |
| Feb-2013 | 3.0 |
| Mar-2013 | 3.0 |
| Apr-2013 | 3.1 |
| May-2013 | 3.0 |
| Jun-2013 | 3.0 |
| Jul-2013 | 3.0 |
| Aug-2013 | 2.9 |
| Sep-2013 | 2.8 |
| Oct-2013 | 2.8 |
| Nov-2013 | 2.6 |
| Dec-2013 | 2.6 |
| Jan-2014 | 2.6 |
| Feb-2014 | 2.5 |
| Mar-2014 | 2.5 |
| Apr-2014 | 2.2 |
| May-2014 | 2.1 |
| Jun-2014 | 2.0 |
| Jul-2014 | 2.1 |
| Aug-2014 | 2.0 |
| Sep-2014 | 2.0 |
| Oct-2014 | 1.9 |
| Nov-2014 | 1.9 |
| Dec-2014 | 1.7 |
Note: Shaded areas denote recessions.
Source: EPI analysis of Bureau of Labor Statistics Job Openings and Labor Turnover Survey and Current Population Survey
Increasing Labor Force Participation Leads to Fewer Missing Workers
The official unemployment rate ticked up slightly last month as more potential workers entered the labor force. While is it a positive sign that more people are actively looking for work, the unemployment rate still understates the weakness of job opportunities. This is due to the existence of a large pool of “missing workers”—potential workers who, because of weak job opportunities, are neither employed nor actively seeking a job. In other words, these are people who would be either working or looking for work if job opportunities were significantly stronger.
The number of missing workers has been hovering around 6 million for over a year. They fell slightly in January, which could be the start of a positive trend. As the economy gets stronger, I would expect more people to start looking for work. At this point, the fact remains that there are still 5.8 million missing workers. And, if the missing workers were actively looking for work, the unemployment rate would be 9.0 percent.
Millions of potential workers sidelined: Missing workers,* January 2006–January 2015
| Date | Missing workers |
|---|---|
| 2006-01-01 | 530,000 |
| 2006-02-01 | 110,000 |
| 2006-03-01 | 110,000 |
| 2006-04-01 | 250,000 |
| 2006-05-01 | 210,000 |
| 2006-06-01 | 110,000 |
| 2006-07-01 | 60,000 |
| 2006-08-01 | -120,000 |
| 2006-09-01 | 120,000 |
| 2006-10-01 | -50,000 |
| 2006-11-01 | -220,000 |
| 2006-12-01 | -500,000 |
| 2007-01-01 | -460,000 |
| 2007-02-01 | -210,000 |
| 2007-03-01 | -150,000 |
| 2007-04-01 | 650,000 |
| 2007-05-01 | 560,000 |
| 2007-06-01 | 360,000 |
| 2007-07-01 | 370,000 |
| 2007-08-01 | 840,000 |
| 2007-09-01 | 410,000 |
| 2007-10-01 | 800,000 |
| 2007-11-01 | 280,000 |
| 2007-12-01 | 250,000 |
| 2008-01-01 | -320,000 |
| 2008-02-01 | 220,000 |
| 2008-03-01 | 50,000 |
| 2008-04-01 | 340,000 |
| 2008-05-01 | -60,000 |
| 2008-06-01 | 20,000 |
| 2008-07-01 | -70,000 |
| 2008-08-01 | -90,000 |
| 2008-09-01 | 180,000 |
| 2008-10-01 | 60,000 |
| 2008-11-01 | 420,000 |
| 2008-12-01 | 420,000 |
| 2009-01-01 | 710,000 |
| 2009-02-01 | 620,000 |
| 2009-03-01 | 1,050,000 |
| 2009-04-01 | 750,000 |
| 2009-05-01 | 650,000 |
| 2009-06-01 | 650,000 |
| 2009-07-01 | 1,040,000 |
| 2009-08-01 | 1,320,000 |
| 2009-09-01 | 2,050,000 |
| 2009-10-01 | 2,270,000 |
| 2009-11-01 | 2,300,000 |
| 2009-12-01 | 3,120,000 |
| 2010-01-01 | 2,770,000 |
| 2010-02-01 | 2,690,000 |
| 2010-03-01 | 2,440,000 |
| 2010-04-01 | 1,940,000 |
| 2010-05-01 | 2,530,000 |
| 2010-06-01 | 2,950,000 |
| 2010-07-01 | 3,220,000 |
| 2010-08-01 | 2,830,000 |
| 2010-09-01 | 3,200,000 |
| 2010-10-01 | 3,640,000 |
| 2010-11-01 | 3,310,000 |
| 2010-12-01 | 3,800,000 |
| 2011-01-01 | 3,910,000 |
| 2011-02-01 | 4,110,000 |
| 2011-03-01 | 3,960,000 |
| 2011-04-01 | 4,000,000 |
| 2011-05-01 | 4,110,000 |
| 2011-06-01 | 4,220,000 |
| 2011-07-01 | 4,640,000 |
| 2011-08-01 | 4,100,000 |
| 2011-09-01 | 3,990,000 |
| 2011-10-01 | 4,090,000 |
| 2011-11-01 | 4,090,000 |
| 2011-12-01 | 4,150,000 |
| 2012-01-01 | 4,450,000 |
| 2012-02-01 | 4,180,000 |
| 2012-03-01 | 4,240,000 |
| 2012-04-01 | 4,630,000 |
| 2012-05-01 | 4,240,000 |
| 2012-06-01 | 4,060,000 |
| 2012-07-01 | 4,520,000 |
| 2012-08-01 | 4,630,000 |
| 2012-09-01 | 4,500,000 |
| 2012-10-01 | 3,930,000 |
| 2012-11-01 | 4,370,000 |
| 2012-12-01 | 4,070,000 |
| 2013-01-01 | 4,350,000 |
| 2013-02-01 | 4,790,000 |
| 2013-03-01 | 5,310,000 |
| 2013-04-01 | 5,060,000 |
| 2013-05-01 | 4,840,000 |
| 2013-06-01 | 4,700,000 |
| 2013-07-01 | 5,030,000 |
| 2013-08-01 | 5,150,000 |
| 2013-09-01 | 5,370,000 |
| 2013-10-01 | 6,120,000 |
| 2013-11-01 | 5,700,000 |
| 2013-12-01 | 5,950,000 |
| 2014-01-01 | 5,850,000 |
| 2014-02-01 | 5,650,000 |
| 2014-03-01 | 5,330,000 |
| 2014-04-01 | 6,210,000 |
| 2014-05-01 | 5,940,000 |
| 2014-06-01 | 5,950,000 |
| 2014-07-01 | 5,810,000 |
| 2014-08-01 | 5,890,000 |
| 2014-09-01 | 6,250,000 |
| 2014-10-01 | 5,720,000 |
| 2014-11-01 | 5,760,000 |
| 2014-12-01 | 6,100,000 |
| 2015-01-01 | 5,760,000 |
* Potential workers who, due to weak job opportunities, are neither employed nor actively seeking work
Note: Volatility in the number of missing workers in 2006–2008, including cases of negative numbers of missing workers, is simply the result of month-to-month variability in the sample. The Great Recession–induced pool of missing workers began to form and grow starting in late 2008.
Source: EPI analysis of Mitra Toossi, “Labor Force Projections to 2016: More Workers in Their Golden Years,” Bureau of Labor Statistics Monthly Labor Review, November 2007; and Current Population Survey public data series
Similarly, we saw a tick up in the employment-to-population ratio for prime-working-age population in January, following a trend that has been slowly moving in the right direction for years. That said, it’s clear that there is a long way to go before we return to pre-recession labor market health.
Employment-to-population ratio of workers ages 25–54, 2006–2015
| Month | Employment to population ratio |
|---|---|
| 2006-01-01 | 79.6% |
| 2006-02-01 | 79.7% |
| 2006-03-01 | 79.8% |
| 2006-04-01 | 79.6% |
| 2006-05-01 | 79.7% |
| 2006-06-01 | 79.8% |
| 2006-07-01 | 79.8% |
| 2006-08-01 | 79.8% |
| 2006-09-01 | 79.9% |
| 2006-10-01 | 80.1% |
| 2006-11-01 | 80.0% |
| 2006-12-01 | 80.1% |
| 2007-01-01 | 80.3% |
| 2007-02-01 | 80.1% |
| 2007-03-01 | 80.2% |
| 2007-04-01 | 80.0% |
| 2007-05-01 | 80.0% |
| 2007-06-01 | 79.9% |
| 2007-07-01 | 79.8% |
| 2007-08-01 | 79.8% |
| 2007-09-01 | 79.7% |
| 2007-10-01 | 79.6% |
| 2007-11-01 | 79.7% |
| 2007-12-01 | 79.7% |
| 2008-01-01 | 80.0% |
| 2008-02-01 | 79.9% |
| 2008-03-01 | 79.8% |
| 2008-04-01 | 79.6% |
| 2008-05-01 | 79.5% |
| 2008-06-01 | 79.4% |
| 2008-07-01 | 79.2% |
| 2008-08-01 | 78.8% |
| 2008-09-01 | 78.8% |
| 2008-10-01 | 78.4% |
| 2008-11-01 | 78.1% |
| 2008-12-01 | 77.6% |
| 2009-01-01 | 77.0% |
| 2009-02-01 | 76.7% |
| 2009-03-01 | 76.2% |
| 2009-04-01 | 76.2% |
| 2009-05-01 | 75.9% |
| 2009-06-01 | 75.9% |
| 2009-07-01 | 75.8% |
| 2009-08-01 | 75.6% |
| 2009-09-01 | 75.1% |
| 2009-10-01 | 75.0% |
| 2009-11-01 | 75.2% |
| 2009-12-01 | 74.8% |
| 2010-01-01 | 75.1% |
| 2010-02-01 | 75.1% |
| 2010-03-01 | 75.1% |
| 2010-04-01 | 75.4% |
| 2010-05-01 | 75.1% |
| 2010-06-01 | 75.2% |
| 2010-07-01 | 75.1% |
| 2010-08-01 | 75.0% |
| 2010-09-01 | 75.1% |
| 2010-10-01 | 75.0% |
| 2010-11-01 | 74.8% |
| 2010-12-01 | 75.0% |
| 2011-01-01 | 75.2% |
| 2011-02-01 | 75.1% |
| 2011-03-01 | 75.3% |
| 2011-04-01 | 75.1% |
| 2011-05-01 | 75.2% |
| 2011-06-01 | 75.0% |
| 2011-07-01 | 75.0% |
| 2011-08-01 | 75.1% |
| 2011-09-01 | 74.9% |
| 2011-10-01 | 74.9% |
| 2011-11-01 | 75.3% |
| 2011-12-01 | 75.4% |
| 2012-01-01 | 75.6% |
| 2012-02-01 | 75.6% |
| 2012-03-01 | 75.7% |
| 2012-04-01 | 75.7% |
| 2012-05-01 | 75.7% |
| 2012-06-01 | 75.7% |
| 2012-07-01 | 75.6% |
| 2012-08-01 | 75.7% |
| 2012-09-01 | 75.9% |
| 2012-10-01 | 76.0% |
| 2012-11-01 | 75.8% |
| 2012-12-01 | 75.9% |
| 2013-01-01 | 75.7% |
| 2013-02-01 | 75.9% |
| 2013-03-01 | 75.9% |
| 2013-04-01 | 75.9% |
| 2013-05-01 | 76.0% |
| 2013-06-01 | 75.9% |
| 2013-07-01 | 76.0% |
| 2013-08-01 | 75.9% |
| 2013-09-01 | 75.9% |
| 2013-10-01 | 75.5% |
| 2013-11-01 | 76.0% |
| 2013-12-01 | 76.1% |
| 2014-01-01 | 76.5% |
| 2014-02-01 | 76.5% |
| 2014-03-01 | 76.6% |
| 2014-04-01 | 76.5% |
| 2014-05-01 | 76.4% |
| 2014-06-01 | 76.8% |
| 2014-07-01 | 76.6% |
| 2014-08-01 | 76.8% |
| 2014-09-01 | 76.8% |
| 2014-10-01 | 76.9% |
| 2014-11-01 | 76.9% |
| 2014-12-01 | 77.0% |
| 2015-01-01 | 77.2% |
Source: EPI analysis of Bureau of Labor Statistics' Current Population Survey public data series.
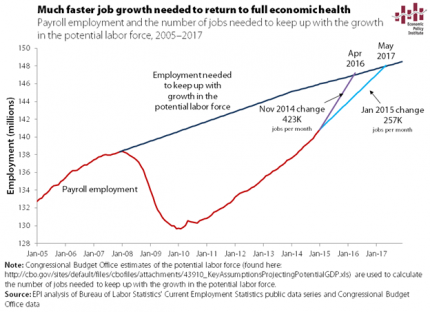
Much Stronger Job Growth is Needed If We’re Going to See a Healthy Economy Any Time Soon
Today’s job report is a solid start to the new year, and could be a sign that the economy has shifted into a slightly higher gear. At 257,000 jobs a month, we would get to pre-recession labor market health by May 2017 (as shown in the figure below).
The BLS revisions to 2014 payroll employment suggest moderately faster growth than initially reported last year, particularly in the last quarter of 2014. If we were to use the highest rate of growth last year—November’s 423,000 jobs added—in each ensuing month, we would return to 2007 labor market health by April 2016, over a year sooner.
There is no reason to expect a much faster growth rate of jobs, but stronger numbers on jobs will hopefully translate into decent wage growth sometime in the foreseeable future. It’s not there yet, but we can only hope.
Nominal Wage Growth Still Far Below Target
This morning’s jobs report showed the economy added 257,000 jobs in January, and the numbers for December and November were revised upward. But even with the positive revisions to 2014 and the solid jobs growth last month, there’s clearly still tremendous slack in the labor market, as evidenced by lagging nominal wage growth. While January’s 0.5 percent jump in wages is a good sign, it’s important not to read too much into any one month, as there’s considerable volatility in the series. Over the year, nominal average hourly earnings have only grown 2.2 percent. From the figure below, it is clear the nominal wage growth has been hovering around 2 percent for the last five years.
It is also apparent from the figure that nominal wages have grown far slower than any reasonable wage target. The fact is that the economy is not growing enough for workers to feel the effects in their paychecks and not enough for the Federal Reserve to slow the economy down out of fear of upcoming inflationary pressure. If the Fed acts too soon, it will slow labor share’s recovery and come at a cost to Americans’ living standards. It is imperative that the Fed keep their foot off the brake for as long as it takes to see modest (if not strong) wage growth for America’s workers.
Nominal wage growth has been far below target in the recovery: Year-over-year change in private-sector nominal average hourly earnings, 2007–2015
| All nonfarm employees | Production/nonsupervisory workers | |
|---|---|---|
| Mar-2007 | 3.6427146% | 4.1112455% |
| Apr-2007 | 3.3234127% | 3.8461538% |
| May-2007 | 3.7257824% | 4.1441441% |
| Jun-2007 | 3.8575668% | 4.1267943% |
| Jul-2007 | 3.4482759% | 4.0524434% |
| Aug-2007 | 3.5433071% | 4.0404040% |
| Sep-2007 | 3.2337090% | 4.1493776% |
| Oct-2007 | 3.2778865% | 3.7780401% |
| Nov-2007 | 3.3203125% | 3.8869258% |
| Dec-2007 | 3.1113272% | 3.8123167% |
| Jan-2008 | 3.1067961% | 3.8619075% |
| Feb-2008 | 3.0464217% | 3.7296037% |
| Mar-2008 | 3.0332210% | 3.7746806% |
| Apr-2008 | 2.8324532% | 3.7037037% |
| May-2008 | 3.0172414% | 3.6908881% |
| Jun-2008 | 2.6666667% | 3.6186100% |
| Jul-2008 | 3.0000000% | 3.7227950% |
| Aug-2008 | 3.2794677% | 3.8263849% |
| Sep-2008 | 3.2747983% | 3.6425726% |
| Oct-2008 | 3.3159640% | 3.9249147% |
| Nov-2008 | 3.5916824% | 3.8548753% |
| Dec-2008 | 3.6303630% | 3.8418079% |
| Jan-2009 | 3.5310734% | 3.7183099% |
| Feb-2009 | 3.4725481% | 3.6516854% |
| Mar-2009 | 3.1775701% | 3.5254617% |
| Apr-2009 | 3.2212885% | 3.2924107% |
| May-2009 | 2.8358903% | 3.0589544% |
| Jun-2009 | 2.7365492% | 2.9379157% |
| Jul-2009 | 2.5889968% | 2.7056875% |
| Aug-2009 | 2.4390244% | 2.6402640% |
| Sep-2009 | 2.2977941% | 2.7457441% |
| Oct-2009 | 2.3383769% | 2.6272578% |
| Nov-2009 | 2.0529197% | 2.6746725% |
| Dec-2009 | 1.8198362% | 2.5027203% |
| Jan-2010 | 1.9554343% | 2.6072787% |
| Feb-2010 | 1.8140590% | 2.4932249% |
| Mar-2010 | 1.7663043% | 2.2702703% |
| Apr-2010 | 1.7639077% | 2.4311183% |
| May-2010 | 1.8987342% | 2.5903940% |
| Jun-2010 | 1.7607223% | 2.4771136% |
| Jul-2010 | 1.8476791% | 2.4731183% |
| Aug-2010 | 1.7070979% | 2.4115756% |
| Sep-2010 | 1.8867925% | 2.2447889% |
| Oct-2010 | 1.8817204% | 2.5066667% |
| Nov-2010 | 1.6540009% | 2.1796917% |
| Dec-2010 | 1.7426273% | 2.0169851% |
| Jan-2011 | 1.9625335% | 2.2233986% |
| Feb-2011 | 1.8262806% | 2.1152829% |
| Mar-2011 | 1.8246551% | 2.1141649% |
| Apr-2011 | 1.9111111% | 2.1097046% |
| May-2011 | 2.0408163% | 2.1041557% |
| Jun-2011 | 2.1295475% | 2.0493957% |
| Jul-2011 | 2.2566372% | 2.2560336% |
| Aug-2011 | 1.9434629% | 1.9884877% |
| Sep-2011 | 1.9400353% | 1.9864088% |
| Oct-2011 | 2.1108179% | 1.7169615% |
| Nov-2011 | 2.0228672% | 1.8210198% |
| Dec-2011 | 1.9762846% | 1.8210198% |
| Jan-2012 | 1.7060367% | 1.3982393% |
| Feb-2012 | 1.9247594% | 1.5018125% |
| Mar-2012 | 2.1416084% | 1.7080745% |
| Apr-2012 | 2.0497165% | 1.7561983% |
| May-2012 | 1.7826087% | 1.4425554% |
| Jun-2012 | 1.9548219% | 1.5447992% |
| Jul-2012 | 1.7741238% | 1.3853258% |
| Aug-2012 | 1.8630849% | 1.3340174% |
| Sep-2012 | 1.9896194% | 1.3839057% |
| Oct-2012 | 1.4642550% | 1.2787724% |
| Nov-2012 | 1.8965517% | 1.4307614% |
| Dec-2012 | 2.1102498% | 1.6351559% |
| Jan-2013 | 2.1505376% | 1.8896834% |
| Feb-2013 | 2.1030043% | 2.0408163% |
| Mar-2013 | 1.8827557% | 1.8829517% |
| Apr-2013 | 1.9658120% | 1.7258883% |
| May-2013 | 2.0504058% | 1.8791265% |
| Jun-2013 | 2.1729868% | 2.0283976% |
| Jul-2013 | 1.9132653% | 1.9736842% |
| Aug-2013 | 2.2118248% | 2.1265823% |
| Sep-2013 | 2.0356234% | 2.1739130% |
| Oct-2013 | 2.2495756% | 2.2727273% |
| Nov-2013 | 2.1573604% | 2.2670025% |
| Dec-2013 | 1.9401097% | 2.3127200% |
| Jan-2014 | 1.9789474% | 2.2055138% |
| Feb-2014 | 2.1017234% | 2.4500000% |
| Mar-2014 | 2.1419572% | 2.2977023% |
| Apr-2014 | 1.9698240% | 2.2954092% |
| May-2014 | 2.0510674% | 2.3928215% |
| Jun-2014 | 1.9599666% | 2.2862823% |
| Jul-2014 | 2.0442219% | 2.2828784% |
| Aug-2014 | 2.1223471% | 2.4789291% |
| Sep-2014 | 1.9950125% | 2.2761009% |
| Oct-2014 | 1.9510170% | 2.2222222% |
| Nov-2014 | 1.9461698% | 2.1674877% |
| Dec-2014 | 1.6549441% | 1.6216216% |
| Jan-2015 | 2.1982742% | 1.9607843% |
* Nominal wage growth consistent with the Federal Reserve Board's 2 percent inflation target, 1.5 percent productivity growth, and a stable labor share of income.
Source: EPI analysis of Bureau of Labor Statistics Current Employment Statistics public data series
What to Watch on Jobs Day: Signs of a Tightening Labor Market?
The economy is slowly recovering from the Great Recession. We saw stronger job growth in 2014 than in 2013 or 2012. In 2015, I hope to see signs of even stronger job growth, pulling the missing workers back into the labor force, and achieving decent, if not strong, wage growth for most. I’ll be looking at these factors when the jobs report comes out tomorrow and throughout the year.
First, jobs growth. If we continue to see the average rate of job growth experienced in 2014, it will be the summer of 2017 when we return to pre-recession labor market health. 2014’s rate of job growth was a positive step, but I’m hoping for even more.
Second, labor force participation. While the unemployment rate continued to fall through 2014, it remains elevated across the population (by age, race, gender, education, sector, occupation)—and even so, it does not reflect the full picture of the labor market. Some of the decline is due to an increase in employment, but some of it is due to a drop in labor force participation. Between November and December 2014, 70 percent of the decline in the number of unemployed people was caused not by workers finding jobs but by people leaving the labor force, or not entering it in the first place.
To better explain this trend, we’ve been tracking what we call the “missing workers.” These are people who have left (or never entered) the labor force, but who would be working or looking for work if job opportunities were significantly more robust. Because jobless workers are only counted as unemployed if they are actively seeking work, these missing workers are not reflected in the official (U3) unemployment rate. We compare today’s labor force participation rate with projections based solely on structural changes in the workforce—like the retiring baby boomers—and find that there are currently 6.1 million missing workers. If these missing workers were actively looking for work, the unemployment rate would be 9.1 percent.
Obama’s Budget: Mostly a Political Document, and That’s Just Fine
This post originally ran on the Wall Street Journal‘s Think Tank blog.
The White House released its annual budget on Monday for fiscal year 2016. On the one hand, this may seem like a low-value exercise, given the dim prospects for its major initiatives passing a Republican-controlled Congress. But on the other hand, the raft of stories written about it prove the president continues to have unrivaled power in setting the terms of policy debate.
And the terms set by the 2016 budget are really useful.
Most of the big-ticket items were previewed: significant increases on tax rates for the highest-income households on income they receive simply from wealth-holdings, higher taxes on large transfers of wealth, tax cuts for low- and middle-income taxpayers, and substantial spending increases on community colleges, early childhood care, and infrastructure.
One item that wasn’t telegraphed by the White House included corporate tax reforms that would impose a minimum 19% tax on foreign earnings of U.S. firms with no opportunity for deferral. This is a very big step in the right direction, if still a little shy of perfect since deferral should be ended and U.S. firms should be taxed at the going corporate income tax rate regardless of where income is earned. But 19% is a lot better than today’s implicit 0% on income held abroad. Further, a large chunk of the budget’s infrastructure proposals is financed by a one-time tax of 14% on accumulated earnings of U.S. corporations held abroad. Again, this is much better than the frequently floated alternative of allowing U.S. firms to repatriate their foreign-held earnings at a preferential rate.
Ideas Good and Not so Good: Infrastructure Investment and Corporate Taxes
President Obama released his fiscal year 2016 budget proposal earlier this week. The proposal is full of good ideas, so-so ideas, and some not so good ideas. One great idea is to devote more money to the Highway Trust Fund for infrastructure investments, which improves job growth now and in the future. At the moment, however, it’s paired with the not-so good idea to pay for it with a mandatory one-time 14 percent tax on the $2 trillion of tax-deferred foreign earnings of U.S. corporations, which would bring in $268 billion over the six years. To be clear, this is an improvement over the other “one-time” corporate tax change often floated to realize a temporary revenue windfall—a full repatriation tax “holiday” for earnings accumulated overseas. So if the Obama proposal is a lot better than a full holiday, what’s the problem? The proposed one-time tax rate is still too low.
The 14 percent one-time tax is a transition tax to the president’s proposal to institute a 19 percent tax on corporate foreign-sourced earnings. Currently, corporate foreign-sourced earnings are subject to the U.S. corporate income tax, but payment of the tax is deferred (i.e., no U.S. taxes are paid at all) until the corporation brings to earnings to the United States (or in the jargon: repatriates the earnings). The earnings are then theoretically taxed at the statutory corporate tax rate of 35 percent, but due to various deductions and tax credits most corporations pay substantially less than the 35 percent rate. It is estimated that firms have stashed away $2 trillion in untaxed earnings overseas. One reason it makes sense for them to stash money overseas is that Congress has in the past offered a repatriation tax “holiday,” which allowed them to repatriate it at hugely preferential rates. And proposals to do this again have been percolating for years, so it makes a lot of sense for multinationals to wait and see if they get another windfall.
This largely explains why the business community, rather than jumping at the chance to face a 14 percent tax rate instead of the 35 percent rate, wants the transition tax rate to be no higher than 5 percent or even lower. Of course they can’t flat-out argue that they’re actually waiting for another pure windfall, so instead they argue the 14 percent rate somehow harms competitiveness, though they don’t explain how. Let’s examine this specious argument.
Firms compete over customers for their products and competitiveness, by its very nature, is forward looking since the past can’t be changed. The tax on income that has already been earned will not affect a firm’s behavior; the accumulated $2 trillion of untaxed income is based on past decisions, which cannot be changed. Consequently, there is no reason to tax this income at a rate less than the statutory corporate tax rate since there is no competitiveness issue. A lower tax rate just rewards firms for the aggressive tax planning that allowed them to accumulate $2 trillion in untaxed earnings.
TPP and Provisions to Stop Currency Management: Not That Hard
As discussions surrounding the proposed Trans-Pacific Partnership (TPP) heat up, there has been a new push to include provisions within the agreement to keep countries from managing the value of their currency for competitive gain vis-à-vis their trading partners. This push got an unexpected (by me, anyhow) boost recently when former U.S. Treasury Secretary and former Obama administration National Economic Council Director Larry Summers called for it (see page 22 in the link).
This currency management is a key cause of persistent U.S. trade deficits, and it is widespread. Given that our trade deficit drags on demand growth, and given that generating sufficient demand to reach full employment is likely to be a key economic problem in coming years, this is an important issue to address. Further, given that U.S. tariffs are extremely low, it’s hard to think of any other issue besides currency management that could possibly matter more for trade flows, so excluding it from the TPP seems odd. And yet many TPP proponents are extremely reluctant to include binding tools to stop currency management in the treaty. There have been many arguments for why the United States can’t or shouldn’t stop currency management, but the latest rationale is pretty novel: the claim is that including a currency chapter in the TPP would let other countries use the provisions of the treaty to stop the Federal Reserve from engaging in expansionary monetary policy. If such a provision had been in effect during the Great Recession, this argument continues, it would have kept the Fed from engaging in the quantitative easing (QE) that it undertook to blunt the recession and spur recovery.
Tying the Fed’s hands like this would indeed be a bad thing, but there’s no reason at all to think one couldn’t define currency management in way that did not constrain the Fed or any other central bank wanting to undertake similar maneuvers.
A Great Idea: End the Sequester
President Obama released his 2016 budget proposal this morning. While president’s budgets are rarely implemented, especially if Congress is controlled by the opposite party, they help to set the agenda for the upcoming legislative year. And this year the president has a great idea that should not be disregarded: ending the sequester.
The president has proposed increasing discretionary spending by over $70 billion, which would effectively put an end to the sequester-induced straight jacket on the budget. Half of the increase would be directed for defense discretionary spending and the other half for nondefense discretionary programs—i.e., the programs that fund public investments. While the proposed spending increase is not enough to meet our actual needs, it is a start.
As a reminder, the sequester is the result of legislation Congress passed and President Obama signed in 2011. At the time, the discretionary caps and sequester were a bad idea; today they are a bad and dangerous idea. This self-imposed austerity was the major factor in the slow recovery from the Great Recession. Recently, Erskine Bowles, a deficit hawk and co-chair of the 2010 National Commission on Fiscal Responsibility and Reform (often called Simpson-Bowles) said “I don’t think it gets any stupider than the sequester.” I agree. Let’s hope the president forcefully pushes Congress to end the stupid sequester.
Sluggish Wage Growth Continues Throughout 2014
Today, the Bureau of Labor Statistics (BLS) released the Employment Cost Index (ECI), a closely watched measure of labor costs, for the last quarter of 2014. Nominal year-over-year compensation for private industry workers rose 2.3 percent, while private sector wages and salaries rose 2.2 percent.
To put these numbers in perspective, below is a chart of the year-over-year changes in both the ECI compensation and wage series along with the monthly BLS Current Employment Statistics (CES) nominal wage series for all nonfarm employees. It’s clear that nominal wage growth (using any of these measures) has been flat for a long time—and there’s little evidence this trend has changed in recent months.
The horizontal shaded area represents growth of 3.5 to 4 percent—nominal wage growth consistent with the Fed’s 2 percent inflation target and a stable labor share of income (given a range of 1.5 to 2 percent trend productivity growth).
We need to see consistent wage growth above this range before there is a hint of upward pressure on prices stemming from too-tight labor markets. Thus, the Fed should not even consider raising interest rates to forestall inflation until wage growth is consistently above this target.
Year-over-year change in private-sector nominal average hourly earnings, 2007–2014
| CES, all private | ECI, wages and salaries | ECI, total compensation | |
|---|---|---|---|
| 2007-03-01 | 3.6427146% | 3.5749752% | 3.1746032% |
| 2007-04-01 | 3.3234127% | ||
| 2007-05-01 | 3.7257824% | ||
| 2007-06-01 | 3.8575668% | 3.3431662% | 3.1465093% |
| 2007-07-01 | 3.4482759% | ||
| 2007-08-01 | 3.5433071% | ||
| 2007-09-01 | 3.2337090% | 3.4146341% | 3.1219512% |
| 2007-10-01 | 3.2778865% | ||
| 2007-11-01 | 3.3203125% | ||
| 2007-12-01 | 3.1113272% | 3.2945736% | 3.0038760% |
| 2008-01-01 | 3.1067961% | ||
| 2008-02-01 | 3.0464217% | ||
| 2008-03-01 | 3.0332210% | 3.1639501% | 3.1730769% |
| 2008-04-01 | 2.8324532% | ||
| 2008-05-01 | 3.0172414% | ||
| 2008-06-01 | 2.6666667% | 3.1398668% | 2.9551954% |
| 2008-07-01 | 3.0000000% | ||
| 2008-08-01 | 3.2794677% | ||
| 2008-09-01 | 3.2747983% | 2.9245283% | 2.8382214% |
| 2008-10-01 | 3.3159640% | ||
| 2008-11-01 | 3.5916824% | ||
| 2008-12-01 | 3.6303630% | 2.6266417% | 2.4459078% |
| 2009-01-01 | 3.5310734% | ||
| 2009-02-01 | 3.4725481% | ||
| 2009-03-01 | 3.1775701% | 2.0446097% | 1.8639329% |
| 2009-04-01 | 3.2212885% | ||
| 2009-05-01 | 2.8358903% | ||
| 2009-06-01 | 2.7365492% | 1.5682657% | 1.4814815% |
| 2009-07-01 | 2.5889968% | ||
| 2009-08-01 | 2.4390244% | ||
| 2009-09-01 | 2.2977941% | 1.3748854% | 1.1959522% |
| 2009-10-01 | 2.3383769% | ||
| 2009-11-01 | 2.0529197% | ||
| 2009-12-01 | 1.8198362% | 1.2797075% | 1.1937557% |
| 2010-01-01 | 1.9554343% | ||
| 2010-02-01 | 1.8140590% | ||
| 2010-03-01 | 1.7663043% | 1.4571949% | 1.6468435% |
| 2010-04-01 | 1.7639077% | ||
| 2010-05-01 | 1.8987342% | ||
| 2010-06-01 | 1.7607223% | 1.6348774% | 1.9160584% |
| 2010-07-01 | 1.8476791% | ||
| 2010-08-01 | 1.7070979% | ||
| 2010-09-01 | 1.8867925% | 1.6274864% | 2.0000000% |
| 2010-10-01 | 1.8817204% | ||
| 2010-11-01 | 1.6540009% | ||
| 2010-12-01 | 1.7426273% | 1.8050542% | 2.0871143% |
| 2011-01-01 | 1.9625335% | ||
| 2011-02-01 | 1.8262806% | ||
| 2011-03-01 | 1.8246551% | 1.6157989% | 1.9801980% |
| 2011-04-01 | 1.9111111% | ||
| 2011-05-01 | 2.0408163% | ||
| 2011-06-01 | 2.1295475% | 1.6979446% | 2.3276634% |
| 2011-07-01 | 2.2566372% | ||
| 2011-08-01 | 1.9434629% | ||
| 2011-09-01 | 1.9400353% | 1.6903915% | 2.1390374% |
| 2011-10-01 | 2.1108179% | ||
| 2011-11-01 | 2.0228672% | ||
| 2011-12-01 | 1.9762846% | 1.5957447% | 2.2222222% |
| 2012-01-01 | 1.7060367% | ||
| 2012-02-01 | 1.9247594% | ||
| 2012-03-01 | 2.1416084% | 1.8551237% | 2.1182701% |
| 2012-04-01 | 2.0497165% | ||
| 2012-05-01 | 1.7826087% | ||
| 2012-06-01 | 1.9548219% | 1.8453427% | 1.8372703% |
| 2012-07-01 | 1.7741238% | ||
| 2012-08-01 | 1.8630849% | ||
| 2012-09-01 | 1.9896194% | 1.8372703% | 1.9197208% |
| 2012-10-01 | 1.4642550% | ||
| 2012-11-01 | 1.8965517% | ||
| 2012-12-01 | 2.1102498% | 1.7452007% | 1.8260870% |
| 2013-01-01 | 2.1505376% | ||
| 2013-02-01 | 2.1030043% | ||
| 2013-03-01 | 1.8827557% | 1.7346054% | 1.9014693% |
| 2013-04-01 | 1.9658120% | ||
| 2013-05-01 | 2.0504058% | ||
| 2013-06-01 | 2.1729868% | 1.8981881% | 1.8900344% |
| 2013-07-01 | 1.9132653% | ||
| 2013-08-01 | 2.2118248% | ||
| 2013-09-01 | 2.0356234% | 1.8041237% | 1.8835616% |
| 2013-10-01 | 2.2495756% | ||
| 2013-11-01 | 2.1573604% | ||
| 2013-12-01 | 1.9401097% | 2.0583190% | 1.9641332% |
| 2014-01-01 | 1.9789474% | ||
| 2014-02-01 | 2.1017234% | ||
| 2014-03-01 | 2.1419572% | 1.7050298% | 1.6963528% |
| 2014-04-01 | 1.9698240% | ||
| 2014-05-01 | 2.0510674% | ||
| 2014-06-01 | 1.9599666% | 1.8628281% | 2.0236088% |
| 2014-07-01 | 2.0442219% | ||
| 2014-08-01 | 2.1223471% | ||
| 2014-09-01 | 1.9950125% | 2.2784810% | 2.2689076% |
| 2014-10-01 | 1.9510170% | ||
| 2014-11-01 | 1.9461698% | ||
| 2014-12-01 | 1.6549441% | 2.1848739% | 2.3450586% |
* Nominal wage growth consistent with the Federal Reserve Board's 2 percent inflation target, 1.5 percent productivity growth, and a stable labor share of income.
Source: EPI analysis of Bureau of Labor Statistics Current Employment Statistics (CES) public data series and Bureau of Labor Statistics Employment Cost Index (ECI)
Congress, Consider the Facts not Fiction before Voting to Repeal the Medical Device Tax
A priority of the new GOP-dominated Congress is to dismantle the Affordable Care Act (ACA), otherwise known as Obamacare. Having failed to repeal the ACA in the past, the GOP is now starting to nibble at the edges of the ACA, hoping to weaken it. One nibble that is likely to see congressional action soon, and which may even pass in both houses, is the repeal of the medical device tax.
The medical device tax is a small 2.3 percent excise tax on the manufacturer’s price of medical devices. It applies to manufacturers and importers of medical devices. The purpose of the tax is to raise revenue to help offset the costs of the ACA by taxing industries that benefit from health care reform: as reform leads to more people with health insurance coverage, the demand for health care—including medical devices—is likely to rise. The medical device tax became effective on January 1, 2013 and is projected to raise about $3 billion per year, or almost $30 billion over 10 years.
The medical device industry, which apparently is represented by Advanced Medical Technology Association (AdvaMed), argues this small tax is a job killer. According to a recent “study” by AdvaMed, the tax reduced industry employment by 14,000 jobs in 2013, or 3.2 percent of the employees in the industry. Furthermore, the “study” argues that R&D has been reduced in the industry, although no numbers are reported. AdvaMed says they estimated this number from a survey of 55 companies in the industry—less than a quarter of the firms in the industry.
This appears to be pretty damning evidence against the medical device tax, but how does it square with what really happened? Every year, Ernst & Young (E&Y) issues a report on the financial condition of the industry; the E&Y data come from a variety of sources including company financial reports. E&Y shows that industry revenues increased by 4 percent between 2012 and 2013, R&D spending increased by 6 percent, and employment increased by 5 percent. In the first year of the medical device tax, the industry created over 20,000 jobs! Oh, and profits were up by 32 percent.
Of course, it is impossible to say what would have happened in the absence of the medical device tax; perhaps more jobs would have been created. But, contrary to AdvaMed’s fictions, it is clear that the number of jobs in the industry has not fallen.
At about the same time the AdvaMed “study” was released, the Congressional Research Service issued an updated report on this tax. The report concludes: “The analysis suggests that most of the tax will fall on consumer prices, and not on profits of medical device companies. The effect on the price of health care, however, will most likely be negligible because of the small size of the tax and small share of health care spending attributable to medical devices.”
Unless Congress is willing to replace lost revenue from the repeal of the medical device tax, they should keep this small tax on one group that benefits from the ACA.
New Data Show Top 1 Percent Really are Different from You and Me
On Monday, we released new estimates of top incomes by state for 2012, based on the work done by Thomas Piketty and Emmanuel Saez. Coincidentally, Saez just released a preliminary update to 2013 of the national top income time series. Saez’s key finding is that the average income of the top 1 percent in the U.S. fell in 2013 by 14.9%. This decline at the top was large enough to lower overall average incomes in 2013 by 3.2%. The good news is, the bottom 99% saw their earnings climb—but by a very modest and somewhat disappointing 0.2%.
Illustrating that the top 1 percent really are different from you and me, Saez notes the fall in income at the top is due to high income earners shifting income from 2013 to 2012 in an effort to reduce their tax liabilities in anticipation of higher top marginal tax rates which took effect in 2013. In an earlier EPI analysis in October 2014, Lawrence Mishel and Will Kimball reported on the decline of wages among the top 1 percent of wage earners, which prefigured these results for households. Similarly, Mishel and Kimball also noted the changes in taxes and suggested this decline was probably only temporary.
Saez expects top incomes to rebound in 2014, but fall short of their 2012 values. Indeed, James Parrott of the Fiscal Policy Institute noted in his summary of New York State top income trends (look up your state’s top income trends here) that data from the New York State Division of the Budget indicate that the top 1 percent’s share of New York personal income tax liability is expected to reach 42.5% in 2015—just shy of its 2012 value of 43.2%.
Trade Agreements or Boosting Wages? We Can’t Do Both
It’s widely expected that in tonight’s State of the Union address President Obama will call for actions to boost wages for low- and moderate-wage Americans, and also for moving forward on two trade agreements—the Trans-Pacific Partnership (TPP) and the Trans-Atlantic Trade and Investment Partnership (TTIP).
These two calls are deeply contradictory. To put it plainly, if policymakers—including the President—are really serious about boosting wage growth for low and moderate-wage Americans, then the push to fast-track TPP and TTIP makes no sense.
The steady integration of the United States and generally much-poorer global economy over the past generation is a non-trivial reason why wages for the vast majority of American workers have become de-linked from overall economic growth. This is not a novel economic theory—the most staid textbook models argue precisely that for a country like the United States, expanded trade should be expected to (yes) lift overall national incomes, but should redistribute so much from labor to capital owners, so that wages actually fall. So, it can boost national income even while leaving the incomes of most people in the nation lower than otherwise.
The intuition on how is pretty easy. Take the most caricatured example of how expanded trade works: the United States produces and exports more capital-intensive goods (say airplanes) and imports more labor-intensive goods (say apparel). By focusing on what we’re relatively better at producing (capital-intensive airplanes)and trading this extra output for what our trading partners are relatively better at producing (labor-intensive apparel), we can see national incomes rise in both countries. This specialization in the United States requires shifting resources (i.e., workers and capital) out of apparel production and into airplane production. But each $1 in apparel production lost requires more labor and less capital than the $1 in airplane production gained—causing an excess supply of labor and an excess demand for capital. Capital’s return rises while labor’s wage falls.
The President’s Twofer
In the weeks leading up to the State of the Union address, President Obama has gradually laid out his vision for America. I am particularly impressed with his proposal to make two years of community college free for students who are willing to work for it. This program would help young adults from lower-income families get a needed start toward a four year college education or vocation training for a career.
Critics have argued it is easy to propose a new program without paying for it. Well, last Saturday, the president said how he will pay for it: raise taxes. What is great about his tax proposal is it is a twofer. First, it would raise needed revenue—$320 billion over 10 years—to pay for the policies that would help low- and middle-income families. Second, it would make the tax code fairer and help reduce the growth in the share of income going to the top 1 percent by increasing taxes on capital income—bringing taxes levied on income gained from wealth closer to income gained from working. The administration estimates that 99 percent of the impact of this proposal would affect the richest 1 percent and more than 80 percent would affect just the richest 0.1 percent.
The main tax proposal is changing how capital gains are taxed. The tax rate on capital gains and dividends is increased to 28 percent—the rate under President Reagan. Currently, the tax rate on capital gains and dividends is 20 percent plus a 3.8 percent surtax. The president’s proposal would increase the tax rate to 24.2 percent plus the 3.8 percent surtax.
In addition, the proposal removes a loophole—the “stepped-up basis” loophole—that allows the wealthiest taxpayers to escape paying tax on inherited assets. We at EPI have been pushing for this change for years. Currently, when assets are transferred, say in a bequest, no taxes are due on appreciated assets. For example, suppose an individual purchases $10 million in stock. That person would have to pay taxes on any realized capital gains when the stock is sold (if the stock was sold for $100 million then the individual would pay taxes on the difference between the purchase price—the basis—and the sales price or $90 million). But if the individual never sells the assets and passes on the $100 million of stock to an heir, no capital gains taxes are due on the $90 million gain. Furthermore, when the individual receiving the assets sells the assets, the basis is stepped-up to $100 million rather than $10 million. The president’s proposals would retain the $10 million basis for the heir (called carry-over basis) and taxes would be paid on any gains when the assets are inherited. In an era with a deeply eroded estate tax, removing this “stepped-up basis” loophole would help us tax large blocks of inherited wealth—essentially adopting some of Thomas Piketty’s ideas for pushing back against rising income and wealth inequality.
What I Want to Hear in the State of the Union Address
On Tuesday, President Obama will deliver his State of the Union address, which gives him an opportunity to lay out his priorities and set an agenda for the year ahead.
At EPI, we have argued that raising wages is the central economic challenge. It is terrific news that the president will address wage stagnation in his speech. After a year of strong job creation but continued stagnant wage growth, many economists and commentators—not to mention the American people—are beginning to focus on wages. Even the new GOP-controlled Congress is paying lip service to the middle class squeeze (but is offering no program to address these challenges). So we are now entering into a great debate about what can be done to raise wages. Ross Eisenbrey and I offered our solutions in a recent interview in The New Republic.
Given congressional obstruction, the president has done his best to address our most pressing economic challenges through executive action:
Paid Leave is Vital to Families’ Economic Security
Yesterday, President Obama proposed a fundamental right to earned paid sick leave for all workers in this country. He also directed federal agencies to offer paid family leave to their workers. This is welcome news.
The fact is, we are behind all of our economic peers in the world in terms of providing what should be a bare minimum standard: paid leave when workers are sick, have doctor’s appointments, or need to care for family members. We also fall short when it comes to family leave—although California has had great success with their paid family leave initiative. Meanwhile, Bloomberg put out a great graphic comparing maternity leave in the United States with other countries in the world. It’s easy to see how far we have to go.
Employers, workers, and the public would all benefit from paid sick and family leave. My colleagues and I have shown through a series of studies on cities and states that paid sick leave is of negligible cost to employers, and we have presented this evidence at state legislative hearings. Mandatory paid sick time would mean that the many employers that already provide paid sick days would have a level playing field with their competitors, and all employers would be able to more easily maintain healthy workplaces. While any new labor standard generates concerns about the business climate and job creation, the evidence from jurisdictions that require paid sick days has all been positive.
Average Real Hourly Wage Growth in 2014 Was No Better Than 2013
The Bureau of Labor Statistics released the Consumer Price Index for December 2014 today, which lets us look at trends in real (inflation-adjusted) wages over the year. In the aftermath of the Great Recession, the U.S. economy has seen very little real wage growth. Real hourly wage growth fell 1.0 percent in 2011, and then 0.1 percent in 2012. Over the last two years, real wage growth has been positive, but slow: real wages rose 0.5 percent in 2013 and 0.4 percent in 2014. Even with the drop in inflation over the last couple of months, average wages increased in 2014 slightly less than in 2013. This means that, by definition, there has been no acceleration in wage growth. Decent wage growth would look like inflation plus productivity growth (around 1.5 to 2.0 percent). Given this, it is clear that the Federal Reserve should not take action to slow the economy down.
Our nominal wage tracker shows just how much wage growth has been falling short of reasonable targets. The labor market and the economy could withstand even higher wage growth because labor’s share of corporate sector income yet to rise in this recovery, and profits are still at record highs. Therefore, real wage growth can be accomplished without putting pressure on prices.
Turning to monthly wages, the figure below shows real average hourly earnings of all private employees (top line) and production/nonsupervisory workers (bottom line) since the recession began in December 2007. For both series, you can see that real wages fell during the recession, then jumped up in late 2008, in direct response to a drop in inflation. When inflation falls and nominal wages hold steady, the mathematical result is a rise in inflation-adjusted wages. After the deflation leading up to 2009 stopped boosting real wages, wage growth has been flat.
White House Breaks Silence on Disability Rule
The White House finally weighed in on the new House rule preventing a simple fix to extend the life of Social Security’s Disability Insurance (DI) trust fund. The fund is projected to run out next year, and if revenue isn’t reallocated from the larger Old Age and Survivors Insurance (OASI) program, disability benefits, already meager, will be reduced by a fifth, as taxes allocated to the program aren’t enough to cover promised benefits. Though a routine reapportionment of payroll taxes would address the problem, the new rule prohibits such a move unless steps are taken to extend the solvency of the Social Security system as a whole.
Since a simple majority is required to overturn the rule or vote for benefit cuts, the rule appears largely symbolic. But depending on whom you talk to, it may or may not have real political repercussions. One thing seems clear: It’s an attempt to pit retirees against disabled beneficiaries, with Republicans positioning themselves as advocates of seniors and reformers of a disability system supposedly rife with fraud and abuse.
What happens when this comes to a head in an election year? Though Republicans may be hoping to force benefit cuts by creating an artificial crisis, it seems unlikely that they’ll let 11 million disabled beneficiaries and their dependents, who disproportionately live in red states, experience sharp benefit cuts, which would cause the average benefit to drop below the federal poverty line.
How to Increase Revenue Without Increasing Taxes
Rep. Lloyd Doggett and Sen. Sheldon Whitehouse introduced the Stop Tax Haven Abuse Act earlier this week (Rep. Doggett and former-Sen. Carl Levin introduced a similar bill in the 113th Congress). The bill would strengthen reporting standards for multinational corporations, strengthen various enforcement provisions, and end certain loopholes that allow corporations to avoid paying U.S. taxes as well as “check-the-box rules.” An explanation of these rules can be found here. It would also deal with what’s known as the “Ugland House” problem.
Though most people are aware of the nice beaches in the Cayman Islands, they are probably unaware of the Ugland House. The Cayman Islands is a tax haven for many profitable U.S. multinational corporations, who claim to earn substantial profits there but pay no taxes to Cayman authorities. In 2008, foreign subsidiaries of U.S. multinational corporations reported they earned $43 billion in the Cayman Islands, which is rather interesting, because this amount is 20 times the Cayman Islands’ GDP. It is simply not possible that this amount could reflect legitimate business activities in the Caymans. This is where the Ugland House comes in.
The Ugland House (on South Church Street in George Town on Grand Cayman) is home to the law firm of Maples and Calder. It is also the legal “home” to over 18,000 corporations, many of which are foreign subsidiaries of U.S. corporations. The Ugland House serves as nothing more than a mailing address for these corporations—their only contact with the Cayman Islands. Their actual business operations are located in other countries, like the United States. A lot of money, however, is credited to this address. (It is worth noting there is a building in another well-known tax haven that serves the same purpose: 1209 North Orange Street in Wilmington, Delaware.)
So far, Congress has been uninterested in doing anything about this tax avoidance problem. The Stop Tax Haven Abuse Act would address this problem by categorizing corporations worth more than $50 million which are managed and controlled in the United States as U.S. taxpayers, no matter where they are incorporated. It is estimated that this act would raise almost $300 billion in revenue over 10 years. While some members appear to think that making U.S. taxpayers pay what they owe amounts to a tax hike, Rep. Doggett and Sen. Whitehouse are to be congratulated on their efforts to curb the flagrant abuse of tax loopholes by profitable companies that can afford to pay their fair share.
Still No Sign of a Skills Mismatch—Unemployment is Elevated Across the Board
One of the recurring myths following the Great Recession has been that recovery in the labor market has lagged because workers don’t have the right skills. The figure below, which shows the number of unemployed workers and the number of job openings in November by industry, is a useful way to examine this idea. If today’s labor market woes were the result of skills shortages or mismatches, we would expect to see some sectors where there are more unemployed workers than job openings and others where there are more job openings than unemployed workers. What we find, however, is that there are more unemployed workers than jobs openings across the board.
Some sectors have been closing the gap faster than others. Health care and social assistance, which has been consistently adding jobs throughout the business cycle, has a ratio quickly approaching 1. Wholesale trade is also moving towards a ratio of 1. And on the other end of the spectrum, there are 6.2 unemployed construction workers for every job opening. Arts, entertainment, and recreation has the second highest ratio, at 3.2-to-1.
Taken as a whole, these numbers demonstrate that the main problem in the labor market is a broad-based lack of demand for workers—not available workers lacking the skills needed for the sectors with job openings.
Unemployed and job openings, by industry (in millions)
| Industry | Unemployed | Job openings |
|---|---|---|
| Professional and business services | 1.1029 | 0.8648 |
| Health care and social assistance | 0.7116 | 0.7004 |
| Retail trade | 1.1112 | 0.4763 |
| Accommodation and food services | 0.9649 | 0.5807 |
| Government | 0.6825 | 0.4352 |
| Finance and insurance | 0.2636 | 0.2311 |
| Durable goods manufacturing | 0.4713 | 0.1775 |
| Other services | 0.3750 | 0.1480 |
| Wholesale trade | 0.1597 | 0.1526 |
| Transportation, warehousing, and utilities | 0.3663 | 0.1645 |
| Information | 0.1507 | 0.0989 |
| Construction | 0.7853 | 0.1272 |
| Nondurable goods manufacturing | 0.3048 | 0.1088 |
| Educational services | 0.2258 | 0.0784 |
| Real estate and rental and leasing | 0.1148 | 0.0566 |
| Arts, entertainment, and recreation | 0.2175 | 0.0685 |
| Mining and logging | 0.0518 | 0.0293 |
Note: Because the data are not seasonally adjusted, these are 12-month averages, December 2013–November 2014.
Source: EPI analysis of data from the Job Openings and Labor Turnover Survey and the Current Population Survey
Little Change in Hires, Quits, or Layoffs in November 2014
The hires, quits, and layoffs rate held fairly steady in the November Job Openings and Labor Turnover Survey (JOLTS), released today. Total separations—the combination of quits, layoffs, discharges, and other separations—fell slightly in November.
The figure below shows the hires rate, the quits rate, and the layoffs rate. Layoffs shot up during the recession but recovered quickly and have been at prerecession levels for more than three years. This makes sense, as the economy is in a recovery and businesses are no longer shedding workers at an elevated rate. The fact that this trend continued in November is a good sign. However, not only do layoffs need to come down before we see a full recovery in the labor market, but hiring needs to pick up. While the hires rate has been generally improving, it’s still below its prerecession level.
The voluntary quits rate had been flat since February (1.8 percent), and saw a modest spike up in September to 2.0 percent, before falling to 1.9 percent in October and holding steady in November. A larger number of people voluntarily quitting their jobs indicates a strong labor market, where hiring is prevalent and workers are able to leave jobs that are not right for them and find new ones. There are still 9.1 percent fewer voluntary quits each month than there were in 2007, before the recession began. We should be hoping for a return to pre-recession levels of in voluntary quits, which would mean that fewer workers are locked into jobs they would leave if they could.
Total hires, layoffs, and quits, December 2000–November 2014
| Month | Hires | Layoffs | Quits |
|---|---|---|---|
| Dec-2000 | 5.395 | 1.879 | 3.044 |
| Jan-2001 | 5.801 | 2.109 | 3.39 |
| Feb-2001 | 5.434 | 1.8 | 3.284 |
| Mar-2001 | 5.619 | 2.134 | 3.178 |
| Apr-2001 | 5.335 | 1.929 | 3.191 |
| May-2001 | 5.358 | 2.007 | 3.116 |
| Jun-2001 | 5.083 | 1.924 | 2.993 |
| Jul-2001 | 5.173 | 1.941 | 2.945 |
| Aug-2001 | 5.076 | 1.878 | 2.823 |
| Sep-2001 | 4.961 | 2.056 | 2.729 |
| Oct-2001 | 5.016 | 2.222 | 2.843 |
| Nov-2001 | 4.887 | 2.12 | 2.621 |
| Dec-2001 | 4.788 | 1.881 | 2.627 |
| Jan-2002 | 4.9 | 1.84 | 2.894 |
| Feb-2002 | 4.883 | 1.97 | 2.675 |
| Mar-2002 | 4.626 | 1.765 | 2.526 |
| Apr-2002 | 4.93 | 1.9 | 2.71 |
| May-2002 | 4.923 | 1.931 | 2.722 |
| Jun-2002 | 4.821 | 1.85 | 2.602 |
| Jul-2002 | 5.014 | 1.99 | 2.688 |
| Aug-2002 | 4.881 | 1.856 | 2.607 |
| Sep-2002 | 4.87 | 1.888 | 2.608 |
| Oct-2002 | 4.803 | 1.847 | 2.563 |
| Nov-2002 | 4.941 | 1.912 | 2.497 |
| Dec-2002 | 4.93 | 1.986 | 2.647 |
| Jan-2003 | 5.008 | 1.98 | 2.489 |
| Feb-2003 | 4.681 | 1.95 | 2.498 |
| Mar-2003 | 4.444 | 1.868 | 2.428 |
| Apr-2003 | 4.689 | 2.023 | 2.387 |
| May-2003 | 4.618 | 1.977 | 2.394 |
| Jun-2003 | 4.772 | 2.136 | 2.365 |
| Jul-2003 | 4.721 | 2.053 | 2.341 |
| Aug-2003 | 4.666 | 1.979 | 2.38 |
| Sep-2003 | 4.87 | 1.893 | 2.468 |
| Oct-2003 | 4.898 | 1.889 | 2.508 |
| Nov-2003 | 4.726 | 1.812 | 2.495 |
| Dec-2003 | 4.967 | 1.951 | 2.503 |
| Jan-2004 | 4.839 | 1.913 | 2.423 |
| Feb-2004 | 4.69 | 1.838 | 2.467 |
| Mar-2004 | 5.17 | 1.889 | 2.662 |
| Apr-2004 | 5.115 | 1.911 | 2.623 |
| May-2004 | 4.951 | 1.858 | 2.482 |
| Jun-2004 | 4.949 | 1.88 | 2.666 |
| Jul-2004 | 4.858 | 1.819 | 2.67 |
| Aug-2004 | 5.129 | 1.954 | 2.639 |
| Sep-2004 | 4.984 | 1.829 | 2.593 |
| Oct-2004 | 5.122 | 1.794 | 2.585 |
| Nov-2004 | 5.204 | 1.954 | 2.818 |
| Dec-2004 | 5.239 | 1.973 | 2.772 |
| Jan-2005 | 5.187 | 1.913 | 2.83 |
| Feb-2005 | 5.203 | 1.909 | 2.675 |
| Mar-2005 | 5.207 | 1.958 | 2.854 |
| Apr-2005 | 5.291 | 1.884 | 2.765 |
| May-2005 | 5.271 | 1.911 | 2.842 |
| Jun-2005 | 5.286 | 1.967 | 2.796 |
| Jul-2005 | 5.301 | 1.862 | 2.747 |
| Aug-2005 | 5.431 | 1.878 | 2.938 |
| Sep-2005 | 5.429 | 1.902 | 3.053 |
| Oct-2005 | 5.065 | 1.717 | 2.943 |
| Nov-2005 | 5.227 | 1.639 | 2.928 |
| Dec-2005 | 5.057 | 1.735 | 2.823 |
| Jan-2006 | 5.218 | 1.719 | 2.853 |
| Feb-2006 | 5.347 | 1.721 | 3.013 |
| Mar-2006 | 5.294 | 1.63 | 3.037 |
| Apr-2006 | 5.125 | 1.743 | 2.808 |
| May-2006 | 5.47 | 1.933 | 3.049 |
| Jun-2006 | 5.256 | 1.674 | 3.034 |
| Jul-2006 | 5.357 | 1.767 | 2.943 |
| Aug-2006 | 5.208 | 1.627 | 2.95 |
| Sep-2006 | 5.213 | 1.741 | 2.914 |
| Oct-2006 | 5.17 | 1.77 | 2.936 |
| Nov-2006 | 5.469 | 1.826 | 3.096 |
| Dec-2006 | 5.19 | 1.724 | 3.083 |
| Jan-2007 | 5.195 | 1.681 | 2.975 |
| Feb-2007 | 5.178 | 1.762 | 2.995 |
| Mar-2007 | 5.287 | 1.787 | 2.985 |
| Apr-2007 | 5.153 | 1.856 | 2.89 |
| May-2007 | 5.217 | 1.725 | 2.978 |
| Jun-2007 | 5.18 | 1.83 | 2.829 |
| Jul-2007 | 5.106 | 1.797 | 2.898 |
| Aug-2007 | 5.131 | 1.841 | 2.89 |
| Sep-2007 | 5.136 | 2.071 | 2.638 |
| Oct-2007 | 5.203 | 1.911 | 2.853 |
| Nov-2007 | 5.177 | 1.924 | 2.823 |
| Dec-2007 | 5.035 | 1.794 | 2.823 |
| Jan-2008 | 4.868 | 1.823 | 2.818 |
| Feb-2008 | 4.863 | 1.875 | 2.809 |
| Mar-2008 | 4.759 | 1.842 | 2.619 |
| Apr-2008 | 4.857 | 1.854 | 2.839 |
| May-2008 | 4.604 | 1.813 | 2.639 |
| Jun-2008 | 4.782 | 2.021 | 2.62 |
| Jul-2008 | 4.467 | 1.906 | 2.495 |
| Aug-2008 | 4.58 | 2.137 | 2.375 |
| Sep-2008 | 4.297 | 1.96 | 2.417 |
| Oct-2008 | 4.454 | 2.126 | 2.443 |
| Nov-2008 | 3.899 | 2.187 | 2.083 |
| Dec-2008 | 4.271 | 2.407 | 2.129 |
| Jan-2009 | 4.111 | 2.502 | 2.04 |
| Feb-2009 | 4.004 | 2.468 | 1.959 |
| Mar-2009 | 3.697 | 2.442 | 1.804 |
| Apr-2009 | 3.87 | 2.592 | 1.731 |
| May-2009 | 3.736 | 2.118 | 1.711 |
| Jun-2009 | 3.649 | 2.123 | 1.737 |
| Jul-2009 | 3.807 | 2.237 | 1.71 |
| Aug-2009 | 3.734 | 2.063 | 1.642 |
| Sep-2009 | 3.846 | 2.095 | 1.644 |
| Oct-2009 | 3.746 | 1.972 | 1.67 |
| Nov-2009 | 3.966 | 1.863 | 1.786 |
| Dec-2009 | 3.819 | 1.981 | 1.69 |
| Jan-2010 | 3.895 | 1.871 | 1.683 |
| Feb-2010 | 3.805 | 1.79 | 1.735 |
| Mar-2010 | 4.163 | 1.861 | 1.818 |
| Apr-2010 | 4.085 | 1.677 | 1.906 |
| May-2010 | 4.38 | 1.754 | 1.779 |
| Jun-2010 | 4.078 | 1.996 | 1.91 |
| Jul-2010 | 4.12 | 2.067 | 1.846 |
| Aug-2010 | 3.916 | 1.761 | 1.864 |
| Sep-2010 | 3.991 | 1.785 | 1.888 |
| Oct-2010 | 4.063 | 1.661 | 1.877 |
| Nov-2010 | 4.13 | 1.772 | 1.821 |
| Dec-2010 | 4.17 | 1.778 | 1.943 |
| Jan-2011 | 3.901 | 1.685 | 1.814 |
| Feb-2011 | 4.048 | 1.65 | 1.872 |
| Mar-2011 | 4.246 | 1.716 | 1.988 |
| Apr-2011 | 4.216 | 1.673 | 1.933 |
| May-2011 | 4.131 | 1.694 | 1.99 |
| Jun-2011 | 4.296 | 1.849 | 1.946 |
| Jul-2011 | 4.157 | 1.749 | 1.971 |
| Aug-2011 | 4.192 | 1.719 | 2.043 |
| Sep-2011 | 4.321 | 1.766 | 2.029 |
| Oct-2011 | 4.237 | 1.747 | 1.965 |
| Nov-2011 | 4.263 | 1.77 | 1.97 |
| Dec-2011 | 4.256 | 1.717 | 1.973 |
| Jan-2012 | 4.282 | 1.654 | 1.978 |
| Feb-2012 | 4.446 | 1.772 | 2.09 |
| Mar-2012 | 4.473 | 1.666 | 2.191 |
| Apr-2012 | 4.316 | 1.828 | 2.097 |
| May-2012 | 4.43 | 1.859 | 2.162 |
| Jun-2012 | 4.35 | 1.778 | 2.141 |
| Jul-2012 | 4.257 | 1.628 | 2.092 |
| Aug-2012 | 4.44 | 1.896 | 2.119 |
| Sep-2012 | 4.232 | 1.771 | 1.941 |
| Oct-2012 | 4.357 | 1.76 | 2.043 |
| Nov-2012 | 4.465 | 1.771 | 2.095 |
| Dec-2012 | 4.343 | 1.596 | 2.138 |
| Jan-2013 | 4.389 | 1.578 | 2.301 |
| Feb-2013 | 4.551 | 1.618 | 2.268 |
| Mar-2013 | 4.301 | 1.755 | 2.103 |
| Apr-2013 | 4.457 | 1.7 | 2.238 |
| May-2013 | 4.541 | 1.783 | 2.198 |
| Jun-2013 | 4.418 | 1.662 | 2.199 |
| Jul-2013 | 4.525 | 1.666 | 2.305 |
| Aug-2013 | 4.592 | 1.701 | 2.346 |
| Sep-2013 | 4.701 | 1.783 | 2.381 |
| Oct-2013 | 4.512 | 1.547 | 2.426 |
| Nov-2013 | 4.574 | 1.511 | 2.448 |
| Dec-2013 | 4.578 | 1.702 | 2.417 |
| Jan-2014 | 4.516 | 1.703 | 2.368 |
| Feb-2014 | 4.699 | 1.596 | 2.475 |
| Mar-2014 | 4.706 | 1.638 | 2.461 |
| Apr-2014 | 4.77 | 1.701 | 2.467 |
| May-2014 | 4.738 | 1.656 | 2.487 |
| Jun-2014 | 4.791 | 1.657 | 2.484 |
| Jul-2014 | 4.934 | 1.726 | 2.547 |
| Aug-2014 | 4.742 | 1.619 | 2.51 |
| Sep-2014 | 5.075 | 1.653 | 2.753 |
| Oct-2014 | 5.101 | 1.757 | 2.712 |
| Nov-2014 | 4.990 | 1.612 | 2.618 |
Note: Shaded areas denote recessions.
Source: EPI analysis of Bureau of Labor Statistics Job Openings and Labor Turnover Survey
Job-Seekers-to-Job-Openings Ratio Continues its Downward Trend in November
The number of job openings hit 5.0 million in November, according to this morning’s Job Openings and Labor Turnover Summary (JOLTS)—a slight increase from 4.8 million in October. Meanwhile, according to the Census’s Current Population Survey, there were 9.0 million job seekers, which means there were 1.8 times as many job seekers as job openings in November—the lowest since January 2008. A rate of 1-to-1 would mean that there were roughly as many job openings as job seekers. In a stronger economy, the ratio would be smaller, but we are definitely moving in the right direction.
This slight decline in the jobs-seekers-to-job-openings ratio is a continuation of its steady decrease, since its high of 6.8-to-1 in July 2009, as you can see in the figure below. The ratio has fallen by 0.8 over the last year.
At the same time, the 9.0 million unemployed workers understates how many job openings will be needed when a robust jobs recovery finally begins, due to the 5.8 million potential workers (in November) who are currently not in the labor market, but who would be if job opportunities were strong. Many of these “missing workers” will go back to looking for a job when the labor market picks up, so job openings will be needed for them, too.
Furthermore, a job opening when the labor market is weak often does not mean the same thing as a job opening when the labor market is strong. There is a wide range of “recruitment intensity” with which a company can deal with a job opening. If a firm is trying hard to fill an opening, it may increase the compensation package and/or scale back the required qualifications. On the other hand, if it is not trying very hard, it might hike up the required qualifications and/or offer a meager compensation package. Perhaps unsurprisingly, research shows that recruitment intensity is cyclical—it tends to be stronger when the labor market is strong, and weaker when the labor market is weak. This means that when a job opening goes unfilled when the labor market is weak, as it is today, companies may very well be holding out for an overly-qualified candidate at a cheap price.
The job-seekers ratio, December 2000–November 2014
| Month | Unemployed job seekers per job opening |
|---|---|
| Dec-2000 | 1.1 |
| Jan-2001 | 1.1 |
| Feb-2001 | 1.3 |
| Mar-2001 | 1.3 |
| Apr-2001 | 1.3 |
| May-2001 | 1.4 |
| Jun-2001 | 1.5 |
| Jul-2001 | 1.5 |
| Aug-2001 | 1.7 |
| Sep-2001 | 1.8 |
| Oct-2001 | 2.1 |
| Nov-2001 | 2.3 |
| Dec-2001 | 2.3 |
| Jan-2002 | 2.3 |
| Feb-2002 | 2.4 |
| Mar-2002 | 2.3 |
| Apr-2002 | 2.6 |
| May-2002 | 2.4 |
| Jun-2002 | 2.5 |
| Jul-2002 | 2.5 |
| Aug-2002 | 2.4 |
| Sep-2002 | 2.5 |
| Oct-2002 | 2.4 |
| Nov-2002 | 2.4 |
| Dec-2002 | 2.8 |
| Jan-2003 | 2.3 |
| Feb-2003 | 2.5 |
| Mar-2003 | 2.8 |
| Apr-2003 | 2.8 |
| May-2003 | 2.8 |
| Jun-2003 | 2.8 |
| Jul-2003 | 2.8 |
| Aug-2003 | 2.7 |
| Sep-2003 | 2.9 |
| Oct-2003 | 2.7 |
| Nov-2003 | 2.6 |
| Dec-2003 | 2.5 |
| Jan-2004 | 2.5 |
| Feb-2004 | 2.4 |
| Mar-2004 | 2.5 |
| Apr-2004 | 2.4 |
| May-2004 | 2.2 |
| Jun-2004 | 2.4 |
| Jul-2004 | 2.1 |
| Aug-2004 | 2.2 |
| Sep-2004 | 2.1 |
| Oct-2004 | 2.1 |
| Nov-2004 | 2.3 |
| Dec-2004 | 2.1 |
| Jan-2005 | 2.2 |
| Feb-2005 | 2.1 |
| Mar-2005 | 2.0 |
| Apr-2005 | 1.9 |
| May-2005 | 2.0 |
| Jun-2005 | 1.9 |
| Jul-2005 | 1.8 |
| Aug-2005 | 1.8 |
| Sep-2005 | 1.8 |
| Oct-2005 | 1.8 |
| Nov-2005 | 1.7 |
| Dec-2005 | 1.7 |
| Jan-2006 | 1.7 |
| Feb-2006 | 1.7 |
| Mar-2006 | 1.6 |
| Apr-2006 | 1.6 |
| May-2006 | 1.6 |
| Jun-2006 | 1.6 |
| Jul-2006 | 1.8 |
| Aug-2006 | 1.6 |
| Sep-2006 | 1.5 |
| Oct-2006 | 1.5 |
| Nov-2006 | 1.5 |
| Dec-2006 | 1.5 |
| Jan-2007 | 1.6 |
| Feb-2007 | 1.5 |
| Mar-2007 | 1.4 |
| Apr-2007 | 1.5 |
| May-2007 | 1.5 |
| Jun-2007 | 1.5 |
| Jul-2007 | 1.6 |
| Aug-2007 | 1.6 |
| Sep-2007 | 1.6 |
| Oct-2007 | 1.7 |
| Nov-2007 | 1.7 |
| Dec-2007 | 1.8 |
| Jan-2008 | 1.8 |
| Feb-2008 | 1.9 |
| Mar-2008 | 1.9 |
| Apr-2008 | 2.0 |
| May-2008 | 2.1 |
| Jun-2008 | 2.3 |
| Jul-2008 | 2.4 |
| Aug-2008 | 2.6 |
| Sep-2008 | 3.0 |
| Oct-2008 | 3.1 |
| Nov-2008 | 3.4 |
| Dec-2008 | 3.7 |
| Jan-2009 | 4.4 |
| Feb-2009 | 4.6 |
| Mar-2009 | 5.4 |
| Apr-2009 | 6.1 |
| May-2009 | 6.0 |
| Jun-2009 | 6.2 |
| Jul-2009 | 6.8 |
| Aug-2009 | 6.5 |
| Sep-2009 | 6.2 |
| Oct-2009 | 6.5 |
| Nov-2009 | 6.3 |
| Dec-2009 | 6.1 |
| Jan-2010 | 5.5 |
| Feb-2010 | 6.0 |
| Mar-2010 | 5.8 |
| Apr-2010 | 5.0 |
| May-2010 | 5.1 |
| Jun-2010 | 5.3 |
| Jul-2010 | 5.0 |
| Aug-2010 | 5.0 |
| Sep-2010 | 5.2 |
| Oct-2010 | 4.8 |
| Nov-2010 | 4.9 |
| Dec-2010 | 5.0 |
| Jan-2011 | 4.8 |
| Feb-2011 | 4.6 |
| Mar-2011 | 4.4 |
| Apr-2011 | 4.5 |
| May-2011 | 4.5 |
| Jun-2011 | 4.3 |
| Jul-2011 | 4.0 |
| Aug-2011 | 4.3 |
| Sep-2011 | 3.9 |
| Oct-2011 | 4.0 |
| Nov-2011 | 4.2 |
| Dec-2011 | 3.7 |
| Jan-2012 | 3.5 |
| Feb-2012 | 3.7 |
| Mar-2012 | 3.3 |
| Apr-2012 | 3.5 |
| May-2012 | 3.4 |
| Jun-2012 | 3.3 |
| Jul-2012 | 3.5 |
| Aug-2012 | 3.4 |
| Sep-2012 | 3.4 |
| Oct-2012 | 3.2 |
| Nov-2012 | 3.2 |
| Dec-2012 | 3.4 |
| Jan-2013 | 3.3 |
| Feb-2013 | 3.0 |
| Mar-2013 | 3.0 |
| Apr-2013 | 3.1 |
| May-2013 | 3.0 |
| Jun-2013 | 3.0 |
| Jul-2013 | 3.0 |
| Aug-2013 | 2.9 |
| Sep-2013 | 2.8 |
| Oct-2013 | 2.8 |
| Nov-2013 | 2.6 |
| Dec-2013 | 2.6 |
| Jan-2014 | 2.6 |
| Feb-2014 | 2.5 |
| Mar-2014 | 2.5 |
| Apr-2014 | 2.2 |
| May-2014 | 2.1 |
| Jun-2014 | 2.0 |
| Jul-2014 | 2.1 |
| Aug-2014 | 2.0 |
| Sep-2014 | 2.0 |
| Oct-2014 | 1.9 |
| Nov-2014 | 1.8 |
Note: Shaded areas denote recessions.
Source: EPI analysis of Bureau of Labor Statistics Job Openings and Labor Turnover Survey and Current Population Survey
Single-Digit Black Unemployment May Not be So Far Away
Double-digit black unemployment rates have been the norm for the past six years. However, following another solid month of job growth in December 2014, the black unemployment rate fell to 10.4 percent—just half a percentage point away from single digits. In a previous post, I highlighted the strong labor market gains made by people of color in 2014, based on every major economic indicator, including the unemployment rate, employment-to-population ratio (EPOP) and labor force participation. From December 2013–December 2014, African Americans had the largest increase in both labor force participation rate and EPOP of any demographic group. Combined with the fact that unemployment rates for whites (4.8 percent) and Hispanics (6.5 percent) have moved steadily closer to pre-recession levels, it’s not unreasonable to assume that, if 2014 labor market trends continue into 2015, black employment could really get a boost.
By projecting the 2014 average monthly change in the size of the black labor force and the number of unemployed black workers through 2015, I calculated a projected monthly black unemployment rate. I also used monthly averages over the past two years, both by level and percent change. Based on these estimates shown in the figure below, the black unemployment rate could finally fall below 10 percent by mid-2015.
2015 projected black unemployment rates based on 2013 and 2014 trends in labor force and unemployed
| Date | 2014 avg level change/mo | 2013-2014 avg level change/mo | 2014 avg percent change/mo | 2013-2014 avg percent change/mo |
|---|---|---|---|---|
| Dec-2014 | 10.4% | 10.4% | 10.4% | 10.4% |
| Jan-2015 | 10.3% | 10.3% | 10.3% | 10.3% |
| Feb-2015 | 10.2% | 10.1% | 10.2% | 10.2% |
| Mar-2015 | 10.1% | 10.0% | 10.1% | 10.1% |
| Apr-2015 | 10.0% | 9.9% | 10.0% | 10.0% |
| May-2015 | 9.9% | 9.7% | 9.9% | 9.9% |
| Jun-2015 | 9.7% | 9.6% | 9.8% | 9.8% |
| Jul-2015 | 9.6% | 9.4% | 9.7% | 9.7% |
| Aug-2015 | 9.5% | 9.3% | 9.6% | 9.5% |
| Sep-2015 | 9.4% | 9.1% | 9.4% | 9.4% |
| Oct-2015 | 9.3% | 9.0% | 9.3% | 9.3% |
| Nov-2015 | 9.2% | 8.9% | 9.2% | 9.2% |
| Dec-2015 | 9.1% | 8.7% | 9.1% | 9.1% |
Source: EPI analysis of Bureau of Labor Statistics' Current Population Survey public data series