Black Unemployment Rate Falls to Single Digits in April as Black Men Catch Up to Black Women
In January of this year, I projected that the black unemployment rate would reach single digits by mid-2015. That happened this month as job growth of 223,000 in April was more in line with the monthly average in 2014. At 9.6 percent, the black unemployment rate is the lowest it’s been since June 2008 and nearly two (1.8) percentage points below where it was this time last year. Though this is an important milestone, the rate remains above the annual average of 8.3 percent in 2007, meaning there’s still much further to go before we declare a full recovery for black workers.
Though the unemployment rate for black men fell to nearly the same rate for black women in April, black men and black women have made very unequal progress, as can be seen in Figure A. This is an amplification of the fact that although men lost more jobs than women during the recession, they have also rebounded faster in the recovery.
Black unemployment rate by gender, December 2007–April 2015
| Black Men | Black Women | |
|---|---|---|
| Dec-2007 | 10.0% | 8.0% |
| Jan-2008 | 10.0% | 8.2% |
| Feb-2008 | 9.0% | 7.8% |
| Mar-2008 | 9.8% | 8.7% |
| Apr-2008 | 9.2% | 8.1% |
| May-2008 | 10.4% | 8.9% |
| Jun-2008 | 10.7% | 8.3% |
| Jul-2008 | 11.8% | 8.3% |
| Aug-2008 | 11.4% | 9.9% |
| Sep-2008 | 12.8% | 9.9% |
| Oct-2008 | 13.3% | 9.6% |
| Nov-2008 | 13.6% | 9.7% |
| Dec-2008 | 14.9% | 9.6% |
| Jan-2009 | 15.7% | 10.1% |
| Feb-2009 | 16.5% | 11.2% |
| Mar-2009 | 16.6% | 11.0% |
| Apr-2009 | 18.4% | 11.9% |
| May-2009 | 17.8% | 12.4% |
| Jun-2009 | 17.5% | 12.5% |
| Jul-2009 | 17.2% | 12.7% |
| Aug-2009 | 17.7% | 12.3% |
| Sep-2009 | 17.6% | 13.3% |
| Oct-2009 | 18.3% | 13.6% |
| Nov-2009 | 18.8% | 13.0% |
| Dec-2009 | 18.4% | 14.0% |
| Jan-2010 | 19.2% | 14.1% |
| Feb-2010 | 19.2% | 13.3% |
| Mar-2010 | 20.6% | 13.5% |
| Apr-2010 | 18.7% | 14.7% |
| May-2010 | 17.5% | 13.6% |
| Jun-2010 | 18.4% | 12.4% |
| Jul-2010 | 17.8% | 13.7% |
| Aug-2010 | 18.1% | 14.0% |
| Sep-2010 | 18.3% | 14.0% |
| Oct-2010 | 17.6% | 13.9% |
| Nov-2010 | 18.1% | 14.4% |
| Dec-2010 | 17.3% | 13.9% |
| Jan-2011 | 18.1% | 13.7% |
| Feb-2011 | 17.6% | 13.7% |
| Mar-2011 | 18.2% | 13.6% |
| Apr-2011 | 18.6% | 14.6% |
| May-2011 | 18.5% | 14.3% |
| Jun-2011 | 17.9% | 14.5% |
| Jul-2011 | 17.4% | 14.4% |
| Aug-2011 | 18.6% | 14.5% |
| Sep-2011 | 17.3% | 14.7% |
| Oct-2011 | 16.6% | 13.0% |
| Nov-2011 | 17.6% | 13.9% |
| Dec-2011 | 16.7% | 14.3% |
| Jan-2012 | 13.7% | 13.4% |
| Feb-2012 | 15.6% | 12.7% |
| Mar-2012 | 15.1% | 13.1% |
| Apr-2012 | 15.0% | 11.7% |
| May-2012 | 14.9% | 12.3% |
| Jun-2012 | 15.3% | 13.5% |
| Jul-2012 | 15.7% | 12.6% |
| Aug-2012 | 15.1% | 12.9% |
| Sep-2012 | 15.2% | 12.1% |
| Oct-2012 | 15.5% | 13.0% |
| Nov-2012 | 14.5% | 12.3% |
| Dec-2012 | 14.8% | 13.2% |
| Jan-2013 | 14.4% | 13.2% |
| Feb-2013 | 14.2% | 13.5% |
| Mar-2013 | 13.7% | 12.6% |
| Apr-2013 | 13.8% | 12.5% |
| May-2013 | 14.9% | 12.2% |
| Jun-2013 | 14.7% | 12.9% |
| Jul-2013 | 13.5% | 11.4% |
| Aug-2013 | 14.8% | 11.3% |
| Sep-2013 | 15.4% | 11.0% |
| Oct-2013 | 14.0% | 12.1% |
| Nov-2013 | 13.4% | 11.5% |
| Dec-2013 | 12.7% | 11.1% |
| Jan-2014 | 13.3% | 11.0% |
| Feb-2014 | 13.7% | 10.4% |
| Mar-2014 | 12.8% | 11.7% |
| Apr-2014 | 12.0% | 10.9% |
| May-2014 | 12.2% | 10.7% |
| Jun-2014 | 11.7% | 9.9% |
| Jul-2014 | 12.1% | 10.8% |
| Aug-2014 | 11.7% | 11.4% |
| Sep-2014 | 11.9% | 10.2% |
| Oct-2014 | 11.6% | 10.2% |
| Nov-2014 | 12.1% | 10.1% |
| Dec-2014 | 12.0% | 9.0% |
| Jan-2015 | 11.5% | 9.3% |
| Feb-2015 | 11.3% | 9.5% |
| Mar-2015 | 10.7% | 9.6% |
| Apr-2015 | 9.7% | 9.5% |
Source: EPI analysis of Bureau of Labor Statistics' Current Population Survey
Between April 2014 and April 2015, job gains for black men far outpaced those of black women (an increase of 7.6 percent and 3.9 percent, respectively). As a result, black men’s unemployment rate declined 2.3 percentage points over the last year, compared to a decline of 1.4 percentage points for black women. Since the end of 2014, employment growth for black women has slowed even further, leaving black women’s unemployment rate 0.5 percentage points higher in April 2015 than it was in December 2014. Meanwhile, black men’s unemployment rate was 2.3 percentage points lower in April 2015 than December 2014.
Although caution should always be used in placing too much emphasis on a single month of data, the last four months raise some questions about whether the recovery has stalled for black women and why.
Today’s Jobs Data More Evidence That Currency Manipulation Is Not a Problem That’s Behind Us
Recent debates over the Trans-Pacific Partnership (TPP) have highlighted the failure of the treaty to include a provision to stop countries from actively weakening the value of their own currency in order to run trade surpluses.
The way this currency management works is that countries (most notably China, though there are many others as well) buy assets denominated in dollars—mostly U.S. Treasuries. This boosts the demand for dollars in global markets and weakens demand for the Chinese renminbi. This in turn increases the value of the dollar, which makes U.S. exports expensive in global markets and makes foreign imports cheaper to U.S. consumers. The result is that exports are suppressed while imports grow and the U.S. trade deficit widens.
Opponents of including a currency provision in the TPP have made a number of bad arguments, and one of them is that currency management was once a problem, but isn’t anymore. They often point to recent appreciation of the Chinese currency as evidence that the problem of currency management is behind us. But this is incorrect—the evidence that currency management is still a problem is simply that foreign purchases of dollar-denominated assets remained strong in 2014. There is zero doubt that absent this continued intervention, the U.S. dollar would weaken. Further, the nearly $1 trillion in purchases of dollar denominated assets that has characterized each year since 2008 has led to a large stock of dollar assets held by foreign investors and governments, and this large stock (over and above the annual flow of dollar purchases) also keeps the value of the dollar stronger than it would otherwise be.
Further, two pieces of recent evidence suggest strongly that excess dollar strength could be becoming a real drag on recovery. In the first quarter numbers on gross domestic product, the rising trade deficit knocked 1.3 percentage points off the economy’s annualized growth rate. Then trade data for March came in showing a very large rise in the deficit. Finally, today’s jobs report shows that growth of employment in manufacturing has stagnated in the last quarter (rising at an average monthly rate of less than 2,000 jobs), after rising at an average monthly rate of 18,000 in 2014.
A $12 Minimum Wage Would Give More Than One in Four Working Moms a Raise
This post is crossposted on the National Women’s Law Center’s Womenstake Blog.
Here’s a Mother’s Day gift idea for Congress: Rather than getting mom flowers or chocolate, how about passing a policy that increases economic security for families, injects billions of dollars into communities, and ensures that women and people of color are paid more fairly?
That’s just what the Raise the Wage Act would do. Introduced last week by Sen. Patty Murray (D-WA) and Rep. Robert “Bobby” Scott (D-VA), the Raise the Wage Act would increase the minimum wage from $7.25 to $12 per hour by 2020 and then “index” it to median wages, so that the minimum would automatically go up as overall wages rose, beginning in 2021. It also would gradually phase out the lower tipped minimum cash wage so that tipped workers would be paid the regular minimum wage before tips—something that only happens in a handful of states today. Federal law currently allows employers to pay tipped workers a pre-tip wage of just $2.13 per hour, a policy that leaves tipped workers nearly twice as likely to live in poverty as other workers.
Passing the Raise the Wage Act would especially help women, particularly women of color. Women are the majority (56 percent) of workers who would benefit from increasing the federal minimum wage to $12 by 2020. As shown in the figure below, 30 percent of working women—roughly 20 million—would get a raise. The gains are even more substantial for working women of color, 37 percent of whom—8.6 million—would see their pay increase. (All of these statistics are available in EPI’s analysis of the proposal.)
Share of selected groups that would get a raise by increasing the federal minimum wage to $12 by 2020
| Share of each group that would get a raise by increasing the federal minimum wage to $12 by 2020 | |
|---|---|
| Women | 29.6% |
| Working moms | 27.3% |
| Single moms | 39.6% |
| Women of color | 37.1% |
Source: EPI analysis of Raise the Wage Act using Current Population Survey Outgoing Rotation Group microdata
Summing Up the Data on Jobs and Wages
Recent weeks have seen a raft of pretty bad economic news. Last month’s jobs report showed a marked slowdown in employment growth—with 126,000 new jobs reported in March, down from the 269,000 average pace of growth that had characterized the previous 12 months. And gross domestic product (GDP) in the first quarter was essentially stagnant—rising at just a 0.2 percent annualized rate. March trade data showed an enormous rise in the trade deficit, which will likely drive the revised numbers on GDP into negative territory.
Given this backdrop, there was a bit more at stake than usual in today’s monthly jobs report. So, what’s the verdict? Mixed.
Job growth in April was 223,000—much closer to the 2014 year-round average than March’s numbers. And the unemployment rate ticked down (insignificantly) to 5.4 percent. Both of these numbers are good news.
But the weak March job growth was revised down even further, to 85,000. The prime-age employment-to-population ratio remains slightly off its February peak (77.2 percent down from 77.3).
Worse, some very nascent signs of pickup in wage growth seem to have melted away. The three-month change in average hourly earnings picked up to 2.7 percent in the March jobs report, but receded down to 2.3 percent in this month’s data. For the year, average hourly earnings rose 2.2 percent—the same desultory pace that has characterized essentially the entire recovery. For production workers (80 percent of the private sector workforce) wage growth was even weaker, increasing just 1.9 percent over the past year.
Where does all of this leave us?
Indiana Politicians Act to Drive Down Constituents’ Wages
While policy makers in Washington are at least paying lip service to the need to lift the stagnant wages of America’s middle class, politicians in state capitals across the country are cutting the wages and benefits of public employees and school teachers, passing so-called “right-to-work” laws to weaken unions, and cutting back on unemployment insurance with the aim of forcing jobless workers to take any job, no matter how poor.
Indiana is a leader in this sorry parade. It passed right-to-work two years ago, and now the legislature has repealed (with the support of a governor with aspirations for national office) the state’s eight-decade old prevailing-wage law, which required contractors on state-funded construction projects to pay their construction workers the average wage in the locality where the work is done. Like the federal Davis-Bacon Act, the rationale for the law was straightforward: The state government should not be in the business of driving down wages. When it pays for construction work, rather than forcing a race to the bottom, it should respect local area standards.
But powerful interests, from the Koch Brothers and the American Legislative Exchange Council to the Associated Builders and Contractors, like the idea of a race to the bottom. From their perspective, the best wage is the lowest wage they can get away with, since companies’ profit margins will be higher with every dollar that isn’t paid to a construction worker. Indiana politicians are dancing to the tune the Kochs are calling.
What to Watch on Jobs Day: Looking for a Pickup in Job Growth, Signs of Wage Growth, and a Glimpse at the Future for the Graduating Class of 2015
Last month’s jobs numbers—plus the downward revisions to previous months—were disappointing at best. When the latest jobs report comes out this Friday, we’ll be watching the top-line employment numbers to see if that’s just a blip or a new trend. The recent slowdown in job growth could be largely due to unseasonably harsh weather. If that’s the case, then we can expect a solid bounce back this month. If not, and slower growth in recent months is actually the start of a new trend, more trouble may lie ahead—and policymakers should take the need to spur a stronger recovery more seriously.
Before the recent slowdown in job growth, it looked like the main lagging indicator was wage growth. Last week, the Employment Cost Index showed a pick-up in growth with year-over-year civilian nominal compensation rising 2.6 percent. While this is a bit faster growth than some other wage series indicate, it’s still far below thresholds that should prompt the Federal Reserve to begin raising interest rates to slow down the economy out of fear of wage-led inflationary pressure. It is true that real (inflation-adjusted) wage growth has been healthy in recent months, but this is driven by rapidly decelerating inflation, not strong nominal wage growth. The rapid price disinflation is driven in turn by a combination of transitory shocks (e.g., oil price declines) which will likely not continue and overall economic weakness. And, the fact remains that there is a long history of poor wages to make up. All indicators of wage growth need to be consistently stronger for a full recovery.
A $12 Minimum Wage Would Bring the United States in Line with International Peers
In We Can Afford a $12 Federal Minimum Wage in 2020, Larry Mishel, John Schmitt, and I explain that raising the federal minimum wage to $12 by 2020 is an eminently achievable and worthwhile goal. As the paper explains, $12 in 2020 would equal a modest 11 percent increase in purchasing power over the 1968 minimum wage, yet would essentially be the same as the 1968 minimum’s value as a percentage of the typical worker’s wage. In other words, raising the minimum wage to $12 by 2020 would simply restore the 1968 relationship between what minimum-wage workers were paid relative to what typical workers were paid—and in doing so, would raise the wages of more than a quarter of all working Americans.
Raising the federal minimum wage to $12 by 2020 would also bring the U.S. minimum wage more in line with the rest of the developed world. This relationship between the minimum wage and the median wage—also known as the “Kaitz index”—is tracked by the Organisation for Economic Co-operation and Development (OECD). As shown in the figure below, according to the OECD, in 2013, the United States had the third-lowest minimum-to-median wage ratio among developed countries—only Mexico and the Czech Republic had lower Kaitz indices. However, if the United States raised its minimum wage to $12, and other countries’ minimum-to-median ratios were to remain unchanged, the United States would move to the eleventh spot. 1

CEA Report Is Simply Not That Relevant to Current Trade Policy Debates
The White House Council of Economic Advisers (CEA) released a report last Friday touting the benefits of international trade for the American economy. The paper provides an interesting review of research on a range of trade’s economic effects, yet the report is largely irrelevant to current trade policy debates. Worse, when its findings are related to current trade policy debates, they are often reported in ways that could mislead readers.
The weaknesses of the report generally fall into one of three areas.
First, the overwhelming focus of the report touts the benefits of trade flows qua trade flows, and often even compares outcomes relative to a hypothetical scenario where trade barriers were raised so high that the U.S. economy became completely autarkic. Academics might find this interesting, but nobody in today’s economic debate argues for increasing U.S. trade barriers, let alone to historically never-seen levels. The CEA acknowledges this explicitly by noting that barriers to foreign imports coming into the U.S. economy are already extremely low and unlikely to be reduced significantly by treaties like the Trans-Pacific Partnership (TPP). Several times, the report alludes to potential benefits of the TPP and other treaties in pulling down barriers to U.S. exports abroad, but fails to mention what is by far the most important barrier to U.S. export success—several major trading partners (including some proposed TPP partners) managing the value of their own currencies for competitive gain vis-à-vis the United States.
Second, the report spends very little time on the most important non-currency issue regarding trade policy: the distribution of gains and losses. When the report does cite research on distribution, it is woefully incomplete, looking only at how the benefits from trade are distributed while ignoring the costs. The research on the comprehensive costs and benefits of this issue is pretty clear: trade with labor abundant trading partners, like many of those in the proposed TPP, tends to lower wages for the majority of U.S. workers and provide gains only to the upper end of the income distribution.
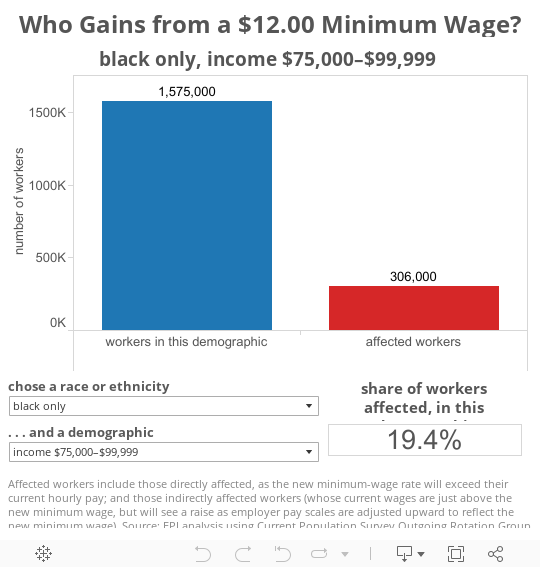
Minimum Wage Increase Hits the Bulls’ Eye
Social or labor market policies are measured by their reach, their adequacy, and their costs. By these metrics, a minimum wage increase is a slam dunk. A generation of research now demonstrates pretty decisively that markets can accommodate a reasonably higher minimum at no significant threat to job creation—especially when ancillary gains (productivity gains, less turnover, increase in aggregate demand) are taken into account. Raising the minimum wage makes almost no demands on the public purse, and could in fact recoup much of the current public subsidy (through working families’ reliance on means-tested tax credits, cash assistance, health care, and food security programs) of low-wage employment. Even a small increase promises to make a big difference: in 2013, Arin Dube estimated that an increase to $10.10 would raise the incomes of poor families (those at the 10th percentile) by 12 percent and lift five to seven million out of poverty. An increase to $12 would likely have even larger poverty-fighting effects.
While much of our social and tax policy is either poorly targeted (it reaches the poor unevenly) or aimed in in the wrong direction (it benefits those who don’t need it), a minimum wage increase hits the bull’s-eye. As EPI’s new estimates of the impact of the “Raise the Wage Act” (bringing the minimum to $12.00/hour by 2020) underscore, the benefits of an increase would flow overwhelmingly to those—young workers, single parents, workers of color—who need it the most. The interactive graphic below summarizes this important new work: the first menu sorts workers by race, the second by income, age, family status, labor force participation, and educational attainment.
EPI Applauds the Issuance of Two New Rules Implementing the H-2B Visa Program
After more than five years of litigation in numerous jurisdictions by immigrant and worker advocates who challenged the Bush administration’s illegally promulgated regulations for the H-2B temporary foreign worker program, the Department of Homeland Security (DHS) and the Department of Labor (DOL) have jointly promulgated two new rules—the H-2B “Comprehensive Interim Final Rule” and the “Wage Methodology Final Rule”—which establish important but modest protections for low-wage U.S. workers and guestworkers.
The H-2B temporary foreign worker program—which has been only minimally regulated since 2008—has facilitated the exploitation and human trafficking of guestworkers who work for U.S. employers in various industries, including landscaping, hospitality, forestry, seafood, fairs and carnivals, and construction. A judgment of $14 million in damages was recently awarded to five Indian H-2B guestworkers by a federal jury in Louisiana; the case is just one example of the many abuses that have been inflicted upon H-2B workers over the years.
EPI applauds the new worker protections provided by the H-2B Comprehensive Interim Final Rule, which goes into effect immediately but will be finalized after a 60-day comment period. This rule was originally proposed and finalized in 2012, after notice to the public and the collection and analysis of comments, but was postponed by congressional appropriations riders and enjoined by federal courts at the request of employer associations. While the rules impose some new duties on H-2B employers, the burdens are minimal and justified. The rules will result in more U.S. workers being hired for open positions and prevent the exploitation of H-2B workers. We echo the sentiment of 10 senators who asked DHS and DOL to “mirror the 2012 rule as much as possible” when the rule is finalized after 60 days.
The new protections for H-2B guestworkers include: the right to a copy of their work contract in a language they can understand; a guarantee that they will be paid for at least three-quarters of the hours promised in their work contracts; and reimbursement for inbound travel expenses after a worker completes 50 percent of the employment contract, and employer-paid outbound transportation if the worker remains employed until the end of the job order or if the worker is dismissed before the end of the job order.
Skepticism About Trade Deals is Warranted
In 1993, it seemed obvious to me that NAFTA was about one main thing: providing a huge new (and much cheaper) labor force to U.S. manufacturers by making it safe for them to build factories in Mexico without fear of expropriation or profit-limiting regulation. But the Clinton administration claimed it would open a new market to U.S. business, and U.S. Trade Representative Mickey Kantor, President Clinton, and even Labor Secretary Bob Reich argued that it would create jobs for American workers and even increase job creation in the U.S. auto and steel industries. They said NAFTA would benefit Mexican workers and help create a bigger Mexican middle class, while deterring migrant workers from crossing the border to seek jobs in the United States with better wages. They also argued an alternative theory: that NAFTA would help keep U.S. manufacturers from moving to Southeast Asia, and that it was better to keep that off-shored work in our hemisphere and along our border.
What actually happened?
- The trade balance with Mexico went from positive to very negative, resulting in the loss of more than 600,000 jobs in the United States.
- Mexico’s corn farmers were overwhelmed by a flood of cheaper U.S. corn and almost 2 million agricultural workers were displaced. Most of them migrated illegally to the United States and remain here as exploited, undocumented workers.
- Wages fell for Mexican industrial workers, to the point that autoworkers in Mexico now make less than Chinese autoworkers. Some Japanese carmakers start paying Mexican workers at 90 to 150 pesos per day, or $6 to $10.
- U.S. auto companies shifted investment to Mexico to exploit its much cheaper labor. AP reports that “Mexican auto production more than doubled in the past 10 years. The consulting firm IHS Automotive expects it to rise another 50 percent to just under 5 million by 2022. U.S. production is expected to increase only 3 percent, to 12.2 million vehicles, in the next 7 years.” Since NAFTA’s enactment, employment in the U.S. motor vehicle and parts industry has declined by more than 200,000 jobs.
More recent claims about the expected benefits of free trade agreement with Korea have proven hollow, too. Instead of creating 70,000 jobs, the net effect has been a higher trade deficit and the loss of 60,000 jobs. Worse, the harshest impact of that deal won’t be felt for several more years, when protective tariffs on pickup trucks are eliminated, making Korean imports 25 percent cheaper than they are today. U.S. auto workers will be hard hit.
And then there’s Permanent Normal Trade Relations with China and China’s admission to the WTO, which led to an explosion of imports and the loss of more than 3 million jobs, mostly in manufacturing and mostly in occupations that paid more than the jobs created in exports industries.
One bad experience after another: that’s why so many are so opposed to fast track and more NAFTA-style free trade deals.
From Ferguson to Baltimore: The Fruits of Government-Sponsored Segregation
In Baltimore in 1910, a black Yale law school graduate purchased a home in a previously all-white neighborhood. The Baltimore city government reacted by adopting a residential segregation ordinance, restricting African Americans to designated blocks. Explaining the policy, Baltimore’s mayor proclaimed, “Blacks should be quarantined in isolated slums in order to reduce the incidence of civil disturbance, to prevent the spread of communicable disease into the nearby White neighborhoods, and to protect property values among the White majority.”
Thus began a century of federal, state, and local policies to quarantine Baltimore’s black population in isolated slums—policies that continue to the present day, as federal housing subsidy policies still disproportionately direct low-income black families to segregated neighborhoods and away from middle class suburbs.
Whenever young black men riot in response to police brutality or murder, as they have done in Baltimore this week, we’re tempted to think we can address the problem by improving police quality—training officers not to use excessive force, implementing community policing, encouraging police to be more sensitive, prohibiting racial profiling, and so on. These are all good, necessary, and important things to do. But such proposals ignore the obvious reality that the protests are not really (or primarily) about policing.
In 1968, following hundreds of similar riots nationwide, a commission appointed by President Lyndon Johnson concluded that “[o]ur nation is moving toward two societies, one black, one white—separate and unequal” and that “[s]egregation and poverty have created in the racial ghetto a destructive environment totally unknown to most white Americans.” The Kerner Commission (headed by Illinois Governor Otto Kerner) added that “[w]hat white Americans have never fully understood—but what the Negro can never forget—is that white society is deeply implicated in the ghetto. White institutions created it, white institutions maintain it, and white society condones it.”
Stagnant GDP at the Start of 2015 is the Latest Evidence That the Economy Hasn’t Reached Escape Velocity
The Commerce Department estimates that U.S. gross domestic product (GDP, the widest measure of overall economic activity) was near stagnant in the first three months of 2015, growing at only a 0.2 percent annualized rate. This is a clear deceleration from the 2.2 percent growth rate in the previous quarter. Final sales (GDP minus the volatile inventory components of GDP) actually declined in the first quarter.
Most of this deceleration is likely transitory—due in part to particularly bad weather in the first quarter. Growth in the rest of 2015 will most likely be faster than previously projected, as the economy bounces back from this weak start to the year. Yet data on GDP in recent years confirms that the U.S. economy has not reached escape velocity—growth rates have not broken past the 2-2.5 pace that normally is associated with rapid declines in economic slack. Because growth has been steady for years, it might be tempting for some policymakers to shrug their shoulders and declare that this is the “new normal” and the best we can do. The economic evidence clearly suggests otherwise—this economy still needs active measures to boost demand to achieve a full recovery. At a minimum, this means the Federal Reserve should put off interest rate increases for the rest of 2015.
Workers Memorial Day: We Need Strong Workplace Safety and Health Protections
Here are a few recent reports about the grim toll of industrial fatalities and the hazards workers are exposed to every day, from the Cal-OSHA Reporter and other sources. Hopefully, they will remind you why we need a strong federal enforcement effort and much better programs of workers compensation for occupational injuries and illnesses. A recent NPR/ProPublica report was a wake-up call about how state legislatures are gutting the programs that compensate employees for lost limbs, lost eyes and damaged hearing, compensate them for lost wages, and pay for the medical care of injured workers.
Bumble Bee Foods facing criminal charges over worker death: “Los Angeles County District Attorney Jackie Lacey on April 27 announced that Bumble Bee Foods LLC and two others are facing criminal charges related to willfully violating worker safety rules and causing the 2012 death of an employee who became trapped inside an industrial oven at the company’s Santa Fe Springs plant.”
OSHA: York workers exposed to asbestos: “A York County company is facing a nearly half-million-dollar fine for allegedly failing to protect employees from asbestos. The York City-based First Capital Insulation Inc. allowed workers to remove asbestos improperly, failed to make sure employees’ respirators fit correctly and did not decontaminate employees and their clothing before they left a work site, the Occupational Safety and Health Administration stated in a news release this week.”
Police: Man dies in Oklahoma City industrial accident: “Oklahoma City police say a worker has died at an area commercial printing business after being trapped under a piece of machinery.”
Worker killed in cinder block wall collapse, Ramsey police say: “A 56-year-old construction worker was killed in a wall collapse at a Ramsey, New Jersey building on Wednesday, officials said.”
Just the Facts: Trade and Investment Deals Are Bad for Working Families
Last week, the president claimed that critics who say that the Trans-Pacific Partnership (TPP) “is bad for working families… don’t know what they are talking about.”
But the truth is, there is an emerging consensus that globalization has put downward pressure on the wages of most working Americans, and has redistributed income from the bottom to the top. My colleague Josh Bivens has shown that expanded trade with low-wage countries has reduced the annual wages of a typical worker by $1,800 per year. Given that there are roughly 100 million non-college-educated workers in the U.S. economy, the scale of wage losses suffered by this group likely translates to roughly $180 billion. Trade and investment deals such as the Korea-U.S. Free Trade Agreement (completed by President Obama), and the agreement to bring China into the World Trade Organization in 2001 (negotiated by President Clinton), have contributed these lost wages. It’s not surprising that one commentator concluded that “the Trans-Pacific Partnership trade deal is an abomination,” precisely because of its impacts on “low-skilled manufacturing workers and income inequality.”
Sluggish Wage Growth Over the Last Year Is Not Due to the Mix of Jobs Being Created
Over the last year, and, in fact, over the last five years, nominal wage growth has been slow—slow by historic standards and slow relative to wage growth that would be consistent with the Fed’s 2 percent overall price inflation target. Hourly wage growth has run at about 2 percent a year and, as we’ve discussed in great length, 2 percent hourly wage growth is far below the 3.5-4 percent target growth that is consistent with the Fed’s target of 2 percent price inflation and a 1.5 to 2.0 percent trend in productivity growth.
Wage growth that exceeds this 3.5 to 4 percent target for a period of time is not an economic problem to be solved. Rather, it is a normal pattern of the labor share of corporate sector income finally recovering its pre Great Recession levels. If last month’s weak job growth is just a blip and healthy job growth continues in the next year, this should eventually lead to a labor market tight enough to finally provide workers with the bargaining power necessary to bid up their wages.
There has been some discussion that the sluggish wage growth we’ve seen since the recovery began in 2009 is driven in large part by the mix of jobs being created, as if we have lower wages simply because the economy is adding more low-wage jobs. Earlier in the recovery there was likely some truth to this, as lower-wage sectors saw the first pickup in job growth. However, over the last year jobs have been created throughout the economy in high-, low-, and middle- wage sectors. The evidence suggests that the economy has been adding jobs in proportion to the rate that those jobs already exist in the economy.
Hatch and Ryan: Chasing Mice and Ignoring the Elephants
It’s a scary thing when powerful government officials misuse their power, and especially when they misuse it to afflict the needy and comfort the comfortable. This appears to be what’s happening now as the chairmen of the two congressional tax-writing committees seek to change the tax status of various worker centers that have annoyed politically active corporations like Walmart, Darden Restaurants, and McDonalds.
I am not a tax lawyer and can’t say with any certainty whether a worker center formed to provide services such as job training, education, and legal assistance to low wage workers should suddenly be transformed from a 501(c)(3) charity into a labor organization if it challenges wage theft or other labor problems caused by a store or corporation. I don’t think the law should operate that way, but the law has a lot of problems.
What I can say is that it’s a shame that Sen. Orrin Hatch and Rep. Paul Ryan are spending their time on a matter of importance only to huge corporations that need no help from Congress in crushing worker organizations, fighting wage increases, and profiting immensely from weak labor standards and high unemployment. As their letter to IRS Commissioner John Koskinen shows, Ryan and Hatch don’t like the fact that worker centers have exercised their constitutionally protected right to “protest and picket against targeted businesses.”
One of the protests the congressmen cited was a Restaurant Opportunity Center protest over the takeover of Olive Garden restaurants by a hedge fund, Starboard, that wanted to cut labor costs by $48 million and transfer the savings to the pockets of investors. The workers and the worker center weren’t asking for the right to be the exclusive bargaining representative: they just didn’t want their wages cut and didn’t want to be changed from waged employees to tipped employees. But Ryan and Hatch want the IRS to investigate the workers.
New Study Confirms that Right-To-Work Laws Are Associated with Significantly Lower Wages
Right to Work (RTW) laws weaken unions by depriving them of the funding they need to be effective, and workers, both union and non-union alike, in RTW states have lower wages. No one really disputes the first fact—workers in non-RTW states are more than twice as likely (2.4 times) to be in a union or protected by a union contract. And wages in RTW states are far lower—almost 16 percent on average. This isn’t surprising, since RTW’s proponents are anti-union hate groups and business organizations that oppose every effort to help workers organize or raise wages. In fact, their key pitch to legislators (outside of campaign contributions) is that RTW will lower labor costs, improve the “business climate,” and encourage out-of-state businesses to relocate.
So it was surprising to see the Heritage Foundation challenge the notion that RTW has no effect on a state’s wage levels. Yes, they say, wages are lower in RTW states, but it isn’t because of RTW. If true, it would leave proponents with no argument for RTW except its core purpose—weakening unions.
But in fact, it’s not true. EPI senior economist Elise Gould and co-author Will Kimball examined the Heritage report and found it to be deeply flawed. Heritage’s finding depends on statistical tricks—the removal of relevant and standard labor market controls such as the worker’s industry, and the inclusion of nonstandard and irrelevant worker characteristics and state-level amenities. Using only standard and relevant factors in the regression analysis yields a consistent finding: wages in RTW states are 3.1 percent lower than those in non-RTW states, after controlling for a full complement of individual demographic and socioeconomic factors as well as state macroeconomic indicators. This translates into RTW being associated with $1,558 lower annual wages for a typical full-time, full-year worker.
No, the TPP Won’t Be Good for the Middle Class
President Obama has been vociferously defending the Trans-Pacific Partnership (TPP) recently. He insists that it will be good for the American middle class and that TPP’s critics arguing otherwise are wrong. But in this case he’s wrong and the TPP critics are right: there is no indication at all that the TPP will be good for the American middle class.
I tried to take this on in very wonky terms in this long-ish report here, and in this post I’ll try to boil it down a bit.
The basic argument for why the TPP is likely to be a bad deal for the middle class is pretty simple. For one, even a genuine “free trade agreement” that was passed with no other complementary policies would actually not be good for the American middle class, even if it did generate gains to total national income. For another, the TPP (like nearly all trade agreements the U.S. signs) is not a “free trade agreement”—instead it’s a treaty that will specify just who will be protected from international competition and who will not. And the strongest and most comprehensive protections offered are by far those for U.S. corporate interests. Finally, there are international economic agreements that the United States could be negotiating to help the American middle class. They would look nothing like the TPP.
Even genuine “free trade” would likely be hard on the American middle class
Most (not all, but most) of the countries that would be included in the TPP are poorer and more labor-abundant than the United States. Standard trade theory has a clear prediction of what happens when the United States expands trade with such countries: total national income rises in both countries but so much income is redistributed upwards within the United States that most workers are made worse off. This is sometimes called “the curse of Stolper-Samuelson”, after the theory that first predicted it. And there is plenty of evidence to suggest that it’s not just a theory, but a pretty good explanation for (part of) the dismal performance of wages for most American workers in recent decades and the rise in inequality. And the scale of the wage-losses are much, much larger than commonly realized—it’s not just those workers who lose their jobs to imports. Instead, the majority of American workers (those without a 4-year college degree) see wage declines as a result of reduced trading costs. The intuition is simply that while waitresses and landscapers might not lose their jobs to imports, their wages are hurt by having to compete with trade-displaced apparel and steel workers.
Just Say No to the Estate Tax Repeal
The House is set today to begin consideration of an ill-conceived bill inappropriately entitled “Death Tax Repeal Act of 2015.” This bill would repeal the estate tax, a tax which only affects estates worth more than $5.4 million—the wealthiest 0.2 percent of estates in the county. Although only very few—and by definition the wealthiest—American estates are affected by the estate tax, these estates are large enough that its repeal will reduce tax revenues by $269 billion over the next 10 years. It is rather disconcerting that the Republican-led Congress wants to increase federal debt by $269 billion to give the wealthiest a tax break but can’t find $168 billion to fund the Highway Trust Fund to repair our crumbling roads and bridges.
Repealing the estate tax also has other serious adverse effects. First, the tax provides an incentive to the wealthiest Americans to leave part of their estate to charity since charitable contributions are tax deductible. Repealing the tax could dramatically reduce charitable giving as wealthy individuals decide to leave their vast estates to heirs rather than charities.
Second and more important, repeal of the estate tax goes against the founding ideals of our country as best summed up by the economist Richard T. Ely when he wrote on the estate tax in 1888:
One of the principles which controlled the action of Jefferson and other founders of this republic, was the abolition of hereditary distinctions and privileges, and their aim was to force each one to rely on his own exertions for his own fortune, desiring to give to all as nearly as practicable an equal start in the race of life.
It has also been urged by others that one of the most dangerous tendencies of our times is the increasing aggregation of wealth in a few hands. This scheme is a slight corrective, which is in harmony with the spirit of our institutions.
Equal Pay Day: Minding the (Gender Wage) Gap
Today is Equal Pay Day, a reminder that a significant pay gap still exists between men and women in our country. At the median in 2013, a woman working full-time, full year was paid only 78.3% of what a man working full-time, full-year earned. Equal Pay Day is April 14 because it marks how far into the next year women would have to work to earn the same amount that men earned in the previous year.
But while comparing median full-time, full-year workers is interesting, it is also worth looking at what the wage gap looks like at different points of the male and female hourly wage distributions. Last week, I looked at the pay gap throughout the wage distribution, and found that the gap was highest at the top. Women at the bottom 10th percentile of earners made 91 percent of men’s hourly wages. At the median, women earn 83 percent of men’s hourly wages. But at the 95th percentile, women earn only 79 percent of men’s wages.
We can also look at gender wage gaps by education level. The figure below shows the gender wage gaps at several levels of educational attainment. Even among the most educated workers—those with an advanced degree—large wage-gaps persist, with women making only 74 percent of men’s hourly wages. For those with a college degree, women make about 78 percent of male earnings.
Women earn less than men at every level of education: Hourly wages by gender and education, 2014
| Education level | Men | Women |
|---|---|---|
| Advanced degree | $44.10 | $32.82 |
| College | $33.35 | $25.94 |
| Some college | $20.19 | $16.20 |
| High school | $18.12 | $14.29 |
| Less than high school | $13.37 | $10.44 |
Source: EPI analysis of Current Population Survey Outgoing Rotation Group microdata
Although women have come a long way in terms of equality and the gender pay gap since the Equal Pay Act was signed in 1963, there is still a long way to go. Even (and sometimes especially) among the most educated and highest-earning women, significant wage gaps remain. One of the agenda items of our initiative to Raise America’s Pay is to end discriminatory practices that contribute to such gender inequalities. We need consistently strong enforcement of antidiscrimination laws in the hiring, promotion, and pay of women and minority workers. This includes greater transparency in the ways these decisions are made and ensuring that the processes available for workers to pursue any violation of their rights are effective. Wage gaps between men and women are one more way that the rules of the American labor market short changes too many working families.
Fast Track to Lost Jobs and Lower Wages
This post originally appeared in The Huffington Post.
This week, Senator Hatch will reportedly introduce “fast track” (trade promotion authority) legislation in the Senate, to help President Obama complete the proposed Trans-Pacific Partnership (TPP), a trade and investment deal with eleven other countries in Asia and the Americas. “Fast Track” authority would allow the President to submit trade agreements to Congress without giving members of Congress the opportunity to amend the deal. Experience has shown that these trade and investment deals typically result in job losses and downward pressure on the wages of most American workers. The last thing America needs is renewal of fast track and more trade and investment deals rushed through Congress.
The administration has claimed that the TPP will create jobs, but it will not. There are other policies that have attracted bipartisan support, including ending currency manipulation and rebuilding infrastructure that could each create millions of U.S. jobs. President Obama has limited political capital to expend with the Republican-controlled Congress and he must choose his policies wisely.
Trade and Jobs?
For more than twenty years, both Democratic and Republican administrations have claimed that free trade agreements like the U.S. – Korea Free Trade Agreement (KORUS) and the North American Free Trade Agreement (NAFTA) would lead to growing U.S. exports and stimulate creation of goods jobs in the United States. Bill Clinton claimed that NAFTA would create 200,000 jobs in its first two years and a million jobs in five years. President Obama claimed that KORUS would “support 70,000 American jobs” because the agreement would “increase exports of American goods by $10 billion to $11 billion.”
Claims that trade and investment deals would support domestic job creation have proven to be empty promises. Expanding exports alone is not enough to ensure that trade adds jobs to the economy. Increases in U.S. exports tend to create jobs in the United States, but increases in imports lead to job loss—by destroying existing jobs and preventing new job creation—as imports displace goods that otherwise would have been made in the United States by American workers. Thus, it is changes in trade balances—the net of exports and imports—that determine the number of jobs created or displaced by trade and investment deals like NAFTA and KORUS.
The Opportunity Dodge
This piece originally ran in The American Prospect.
We think of America as the land of opportunity, but the United States actually has low rates of upward mobility relative to other advanced nations, and there has been no improvement in decades. Creating more opportunity is therefore a worthy goal. However, when the goal of more opportunity is offered instead of addressing income inequality, it’s a dodge and an empty promise—because opportunity does not thrive amid great inequalities.
It is important to distinguish between opportunity (or mobility) and income inequality. Concerns about mobility relate to strengthening the chances that children who grow up with relatively low incomes will attain middle-class or higher incomes in their adulthood. To address income inequality, on the other hand, is to focus on whether low- and middle-income households improve their share of the economic growth generated in the next two decades. Rising inequality is best illustrated by the fact that while the top 1 percent only received 9 percent of household income in 1979, this group gained either 38 percent (using the CBO’s comprehensive measure) or 60 percent (using tax data on market-based incomes) of the income growth between 1979 and 2007. That is, the top 1 percent received four to six times its expected share of all the income growth.
The opportunity dodge is popular with centrist and conservative politicians. Conservatives, for the most part, consider income outcomes to be the result of meritocracy. “I don’t care about income inequality per se; I care about opportunity inequality,” Arthur Brooks, head of the American Enterprise Institute recently said. “I want everybody to have a chance to be mobile, to rise, for everybody to have a chance to earn success.” Likewise, Jeb Bush’s highly touted speech to the Economic Club of Detroit keyed in on “the opportunity gap.” Left unsaid is that groups losing out from income inequality are judged to have not exerted sufficient effort, to have inadequate skills, or to have pursued counterproductive behaviors (such as not getting married).
No Surprise, the Money is Not Rolling in from 401(k)s and IRAs
As I noted in earlier blog posts, Andrew Biggs of the American Enterprise Institute and retired Towers Watson executive Sylvester Schieber have been leading a chorus of retirement crisis deniers, based in large part on the claim that income surveys don’t count lump-sum distributions from retirement accounts. While no one denies that the Census Bureau’s Current Population Survey income measures don’t include these distributions, it has always been clear from other survey data—notably the Federal Reserve’s Survey of Consumer Finances—that savings in these accounts are so unequally distributed that they make little difference to most retiree households.
Starting in 2014, the Census Bureau began asking some survey respondents about lump-sum distributions as well as other questions designed to better capture income from interest-earning accounts and other sources. Preliminary results are in, and they don’t support Biggs and Schieber’s vision of sugar plums for retiree households. The median income of households 65 and older increased from $35,611 to $37,252—less than 5 percent—a far cry from the 60 percent difference Biggs and Schieber were throwing about. This is less than the increase seen by households age 45-54, whose median income rose from $67,141 to $70,802, presumably because income from retirement sources increased less than income from other interest-earning accounts.
Biggs and Schieber, usually impressively quick on the draw, have been noticeably silent.
10 Senators Join in Bipartisan Call to Investigate H-1B Abuse
The widespread, flagrant abuse of the H-1B visa, which allows employers to hire non-immigrant foreign workers for IT jobs and other skilled work, is drawing bipartisan attention in Congress. In particular, the case of Southern California Edison (SCE), which used two Indian outsourcing firms to replace 400-500 well-paid U.S. workers with cheaper guestworkers, has caught the attention of leaders from both parties. 10 senators sent a letter to the Obama administration calling for an investigation by the Departments of Justice, Homeland Security, and Labor.
As we have pointed out many times, the biggest users of the H-1B visa are not small businesses looking for a rare scientist or information technology wizard. Rather, they are big corporations like Disney, SCE, and Northeast Utilities that want to reduce their labor costs by hiring younger, cheaper foreign workers. They hire “body shops” like Tata, Infosys and Wipro to import Indian college graduates to replace U.S. workers who might be paid $30,000 or $40,000 more. And it’s legal! It’s wrong and it’s appalling, but it’s legal.
Microsoft, Google, and the other high tech companies that want to increase the number of H-1B visas available to private employers by 120,000 or so claim they can’t find the tech workers they need in the U.S. and don’t have access to enough foreign workers. There is not much evidence to support their claim. But one thing is clear: if the H-1B visa weren’t used to replace U.S. workers, there would be a lot more available to Microsoft et al. Congress should reform the H-1B and prevent its abuse before it gives any thought to expanding the number of visas available.
Misleading Math on the Korea Free Trade Agreement
This post was updated at 5:43 pm to reflect additional analysis.
Today, the Washington Post fact checker, Glenn Kessler, claimed that Public Citizen’s analysis of the Korean Free Trade Agreement (KORUS) is based on flawed economics and faulty math. Kessler accepts the White House claim that the employment effect of the KORUS should be based only “on a gain in merchandise exports,” and then claims that “the most appropriate way to look at export flows would be on an annual basis, which shows a net gain of about $2.3 billion. That’s theoretically a gain of 15,000—a far cry from the loss of 85,000 [jobs],” as estimated by Public Citizen. By ignoring imports, Kessler completely ignores one of the most important factors in the effects of trade on employment.
Imports reduce the demand for domestic goods and services. This is a fundamental assumption in introductory (and applied) macroeconomics. By ignoring it, Kessler denies his readers critical information needed to evaluate Public Citizen’s claim.
The Fact Checker approach (and the White House’s KORUS trade and job estimate) is a form of bookkeeping which counts only the credits and ignores the debits. It would earn a failing grade in any basic accounting class. Kessler spends a lot of time talking about things that make job and export calculations difficult (overall economic health, and the state of the business cycle), and yet he glosses over the impact of imports. It’s really important to calculate the jobs impact of both exports and imports, and it’s easy to do.
No Worker Shortages, but Some Sectors Show Improved Opportunities
I’ve written before about how one of the recurring myths following the Great Recession has been that recovery in the labor market has lagged because workers don’t have the right skills. The figure below, which shows the number of unemployed workers and the number of job openings in February by industry, is the best way to rebut this idea. If today’s labor market woes were the result of skills shortages or mismatches, we would expect to see some sectors where there are significantly more unemployed workers than job openings, and others where there are significantly more job openings than unemployed workers. What we find when looking at the data is that there are more unemployed workers than jobs openings in most industries.
Last year, the graph showed that the number of unemployed workers exceeded job openings in all industries, but there have been some signs of tightening in February. For several months now, health care and social assistance was the only sector where those workers appeared to be facing a tighter labor market. Now, it appears that they are not alone: finance and insurance and wholesale trade both have job seekers and job openings close to on par with each other.
This within-sector tightening is a small sign of good news in February’s JOLTS report. Unfortunately, other sectors have seen little-to-no improvement in their job-seekers-to-job-openings ratios. There are, for example, still five-and-a-half unemployed construction workers for every job opening. In other words, despite claims from some employers, there is no shortage of construction workers.
In fact, while the market does appear to be improving for some types of unemployed workers, there are no significant worker shortages anywhere in the economy. Taken as a whole, these numbers demonstrate that the main problem in the labor market is a broad-based lack of demand for workers—not available workers lacking the skills needed for the sectors with job openings.
The Quits Rate Exemplifies a Far From Strong Economy
The hires, quits, and layoffs rates all held fairly steady in the February Job Openings and Labor Turnover Survey (JOLTS) report.
As you can see in the figure below, layoffs shot up during the recession but recovered quickly and have been at prerecession levels for more than three years. The fact that this trend continued in February is a good sign. That said, not only do layoffs need to come down before we see a full recovery in the labor market, hiring needs to pick up. The hires rate was unchanged in February. It has been generally improving, but it still remains below its prerecession level.
The voluntary quits rate fell slightly from 2.0 in January to 1.9 in February, the same rate it had been for both November and December. In February, the quits rate was still 9.2 percent lower than it was in 2007, before the recession began. A larger number of people voluntarily quitting their jobs indicates a strong labor market—one where workers are able to leave jobs that are not right for them and find new ones. Before long, we should look for a return to pre-recession levels of voluntary quits, which would mean that fewer workers are locked into jobs they would leave if they could. But we are not there yet.
Hires, quits, and layoff rates, December 2000–February 2015
| Month | Hires rate | Layoffs rate | Quits rate |
|---|---|---|---|
| Dec-2000 | 4.1% | 1.4% | 2.3% |
| Jan-2001 | 4.4% | 1.6% | 2.6% |
| Feb-2001 | 4.1% | 1.4% | 2.5% |
| Mar-2001 | 4.2% | 1.6% | 2.4% |
| Apr-2001 | 4.0% | 1.5% | 2.4% |
| May-2001 | 4.0% | 1.5% | 2.4% |
| Jun-2001 | 3.8% | 1.5% | 2.3% |
| Jul-2001 | 3.9% | 1.5% | 2.2% |
| Aug-2001 | 3.8% | 1.4% | 2.1% |
| Sep-2001 | 3.8% | 1.6% | 2.1% |
| Oct-2001 | 3.8% | 1.7% | 2.2% |
| Nov-2001 | 3.7% | 1.6% | 2.0% |
| Dec-2001 | 3.7% | 1.4% | 2.0% |
| Jan-2002 | 3.7% | 1.4% | 2.2% |
| Feb-2002 | 3.7% | 1.5% | 2.0% |
| Mar-2002 | 3.5% | 1.4% | 1.9% |
| Apr-2002 | 3.8% | 1.5% | 2.1% |
| May-2002 | 3.8% | 1.5% | 2.1% |
| Jun-2002 | 3.7% | 1.4% | 2.0% |
| Jul-2002 | 3.8% | 1.5% | 2.1% |
| Aug-2002 | 3.7% | 1.4% | 2.0% |
| Sep-2002 | 3.7% | 1.4% | 2.0% |
| Oct-2002 | 3.7% | 1.4% | 2.0% |
| Nov-2002 | 3.8% | 1.5% | 1.9% |
| Dec-2002 | 3.8% | 1.5% | 2.0% |
| Jan-2003 | 3.8% | 1.5% | 1.9% |
| Feb-2003 | 3.6% | 1.5% | 1.9% |
| Mar-2003 | 3.4% | 1.4% | 1.9% |
| Apr-2003 | 3.6% | 1.6% | 1.8% |
| May-2003 | 3.5% | 1.5% | 1.8% |
| Jun-2003 | 3.7% | 1.6% | 1.8% |
| Jul-2003 | 3.6% | 1.6% | 1.8% |
| Aug-2003 | 3.6% | 1.5% | 1.8% |
| Sep-2003 | 3.7% | 1.5% | 1.9% |
| Oct-2003 | 3.8% | 1.4% | 1.9% |
| Nov-2003 | 3.6% | 1.4% | 1.9% |
| Dec-2003 | 3.8% | 1.5% | 1.9% |
| Jan-2004 | 3.7% | 1.5% | 1.9% |
| Feb-2004 | 3.6% | 1.4% | 1.9% |
| Mar-2004 | 3.9% | 1.4% | 2.0% |
| Apr-2004 | 3.9% | 1.5% | 2.0% |
| May-2004 | 3.8% | 1.4% | 1.9% |
| Jun-2004 | 3.8% | 1.4% | 2.0% |
| Jul-2004 | 3.7% | 1.4% | 2.0% |
| Aug-2004 | 3.9% | 1.5% | 2.0% |
| Sep-2004 | 3.8% | 1.4% | 2.0% |
| Oct-2004 | 3.9% | 1.4% | 2.0% |
| Nov-2004 | 3.9% | 1.5% | 2.1% |
| Dec-2004 | 4.0% | 1.5% | 2.1% |
| Jan-2005 | 3.9% | 1.4% | 2.1% |
| Feb-2005 | 3.9% | 1.4% | 2.0% |
| Mar-2005 | 3.9% | 1.5% | 2.1% |
| Apr-2005 | 4.0% | 1.4% | 2.1% |
| May-2005 | 3.9% | 1.4% | 2.1% |
| Jun-2005 | 3.9% | 1.5% | 2.1% |
| Jul-2005 | 3.9% | 1.4% | 2.0% |
| Aug-2005 | 4.0% | 1.4% | 2.2% |
| Sep-2005 | 4.0% | 1.4% | 2.3% |
| Oct-2005 | 3.8% | 1.3% | 2.2% |
| Nov-2005 | 3.9% | 1.2% | 2.2% |
| Dec-2005 | 3.7% | 1.3% | 2.1% |
| Jan-2006 | 3.9% | 1.3% | 2.1% |
| Feb-2006 | 3.9% | 1.3% | 2.2% |
| Mar-2006 | 3.9% | 1.2% | 2.2% |
| Apr-2006 | 3.8% | 1.3% | 2.1% |
| May-2006 | 4.0% | 1.4% | 2.2% |
| Jun-2006 | 3.9% | 1.2% | 2.2% |
| Jul-2006 | 3.9% | 1.3% | 2.2% |
| Aug-2006 | 3.8% | 1.2% | 2.2% |
| Sep-2006 | 3.8% | 1.3% | 2.1% |
| Oct-2006 | 3.8% | 1.3% | 2.1% |
| Nov-2006 | 4.0% | 1.3% | 2.3% |
| Dec-2006 | 3.8% | 1.3% | 2.2% |
| Jan-2007 | 3.8% | 1.2% | 2.2% |
| Feb-2007 | 3.8% | 1.3% | 2.2% |
| Mar-2007 | 3.8% | 1.3% | 2.2% |
| Apr-2007 | 3.7% | 1.3% | 2.1% |
| May-2007 | 3.8% | 1.3% | 2.2% |
| Jun-2007 | 3.8% | 1.3% | 2.0% |
| Jul-2007 | 3.7% | 1.3% | 2.1% |
| Aug-2007 | 3.7% | 1.3% | 2.1% |
| Sep-2007 | 3.7% | 1.5% | 1.9% |
| Oct-2007 | 3.8% | 1.4% | 2.1% |
| Nov-2007 | 3.7% | 1.4% | 2.0% |
| Dec-2007 | 3.6% | 1.3% | 2.0% |
| Jan-2008 | 3.5% | 1.3% | 2.0% |
| Feb-2008 | 3.5% | 1.4% | 2.0% |
| Mar-2008 | 3.4% | 1.3% | 1.9% |
| Apr-2008 | 3.5% | 1.3% | 2.1% |
| May-2008 | 3.3% | 1.3% | 1.9% |
| Jun-2008 | 3.5% | 1.5% | 1.9% |
| Jul-2008 | 3.3% | 1.4% | 1.8% |
| Aug-2008 | 3.3% | 1.6% | 1.7% |
| Sep-2008 | 3.1% | 1.4% | 1.8% |
| Oct-2008 | 3.3% | 1.6% | 1.8% |
| Nov-2008 | 2.9% | 1.6% | 1.5% |
| Dec-2008 | 3.2% | 1.8% | 1.6% |
| Jan-2009 | 3.1% | 1.9% | 1.5% |
| Feb-2009 | 3.0% | 1.9% | 1.5% |
| Mar-2009 | 2.8% | 1.8% | 1.4% |
| Apr-2009 | 2.9% | 2.0% | 1.3% |
| May-2009 | 2.8% | 1.6% | 1.3% |
| Jun-2009 | 2.8% | 1.6% | 1.3% |
| Jul-2009 | 2.9% | 1.7% | 1.3% |
| Aug-2009 | 2.9% | 1.6% | 1.3% |
| Sep-2009 | 3.0% | 1.6% | 1.3% |
| Oct-2009 | 2.9% | 1.5% | 1.3% |
| Nov-2009 | 3.1% | 1.4% | 1.4% |
| Dec-2009 | 2.9% | 1.5% | 1.3% |
| Jan-2010 | 3.0% | 1.4% | 1.3% |
| Feb-2010 | 2.9% | 1.4% | 1.3% |
| Mar-2010 | 3.2% | 1.4% | 1.4% |
| Apr-2010 | 3.1% | 1.3% | 1.5% |
| May-2010 | 3.3% | 1.3% | 1.4% |
| Jun-2010 | 3.1% | 1.5% | 1.5% |
| Jul-2010 | 3.2% | 1.6% | 1.4% |
| Aug-2010 | 3.0% | 1.4% | 1.4% |
| Sep-2010 | 3.1% | 1.4% | 1.5% |
| Oct-2010 | 3.1% | 1.3% | 1.4% |
| Nov-2010 | 3.1% | 1.4% | 1.4% |
| Dec-2010 | 3.2% | 1.4% | 1.5% |
| Jan-2011 | 3.0% | 1.3% | 1.4% |
| Feb-2011 | 3.1% | 1.3% | 1.4% |
| Mar-2011 | 3.3% | 1.3% | 1.5% |
| Apr-2011 | 3.2% | 1.3% | 1.5% |
| May-2011 | 3.1% | 1.3% | 1.5% |
| Jun-2011 | 3.3% | 1.4% | 1.5% |
| Jul-2011 | 3.2% | 1.3% | 1.5% |
| Aug-2011 | 3.2% | 1.3% | 1.5% |
| Sep-2011 | 3.3% | 1.3% | 1.5% |
| Oct-2011 | 3.2% | 1.3% | 1.5% |
| Nov-2011 | 3.2% | 1.3% | 1.5% |
| Dec-2011 | 3.2% | 1.3% | 1.5% |
| Jan-2012 | 3.2% | 1.3% | 1.5% |
| Feb-2012 | 3.3% | 1.3% | 1.6% |
| Mar-2012 | 3.3% | 1.3% | 1.6% |
| Apr-2012 | 3.2% | 1.4% | 1.6% |
| May-2012 | 3.3% | 1.4% | 1.6% |
| Jun-2012 | 3.2% | 1.3% | 1.6% |
| Jul-2012 | 3.2% | 1.2% | 1.6% |
| Aug-2012 | 3.3% | 1.4% | 1.6% |
| Sep-2012 | 3.1% | 1.3% | 1.4% |
| Oct-2012 | 3.2% | 1.3% | 1.5% |
| Nov-2012 | 3.3% | 1.3% | 1.6% |
| Dec-2012 | 3.2% | 1.1% | 1.6% |
| Jan-2013 | 3.3% | 1.2% | 1.7% |
| Feb-2013 | 3.4% | 1.2% | 1.7% |
| Mar-2013 | 3.2% | 1.3% | 1.5% |
| Apr-2013 | 3.3% | 1.3% | 1.7% |
| May-2013 | 3.3% | 1.3% | 1.6% |
| Jun-2013 | 3.2% | 1.2% | 1.6% |
| Jul-2013 | 3.3% | 1.2% | 1.7% |
| Aug-2013 | 3.4% | 1.2% | 1.7% |
| Sep-2013 | 3.4% | 1.3% | 1.7% |
| Oct-2013 | 3.3% | 1.1% | 1.8% |
| Nov-2013 | 3.4% | 1.1% | 1.8% |
| Dec-2013 | 3.3% | 1.2% | 1.7% |
| Jan-2014 | 3.3% | 1.3% | 1.7% |
| Feb-2014 | 3.4% | 1.2% | 1.8% |
| Mar-2014 | 3.4% | 1.2% | 1.8% |
| Apr-2014 | 3.5% | 1.2% | 1.7% |
| May-2014 | 3.5% | 1.2% | 1.8% |
| Jun-2014 | 3.5% | 1.2% | 1.8% |
| Jul-2014 | 3.6% | 1.3% | 1.8% |
| Aug-2014 | 3.4% | 1.2% | 1.8% |
| Sep-2014 | 3.6% | 1.2% | 2.0% |
| Oct-2014 | 3.7% | 1.2% | 2.0% |
| Nov-2014 | 3.6% | 1.1% | 1.9% |
| Dec-2014 | 3.7% | 1.2% | 1.9% |
| Jan-2015 | 3.5% | 1.2% | 2.0% |
| Feb-2015 | 3.5% | 1.1% | 1.9% |
Note: Shaded areas denote recessions. The hires rate is the number of hires during the entire month as a percent of total employment. The layoff rate is the number of layoffs and discharges during the entire month as a percent of total employment. The quits rate is the number of quits during the entire month as a percent of total employment.
Source: EPI analysis of Bureau of Labor Statistics Job Openings and Labor Turnover Survey
Another Month, Same Story: Job Openings Data Little Changed in February
The employment situation for March showed downward revisions to payroll employment in both January and February and a considerably slower growth in jobs in March. This morning’s Job Openings and Labor Turnover Survey (JOLTS) report generally corroborates that story—the recovery hasn’t stalled, but it isn’t doing much better than simply chugging along.
The total number of job openings reached 5.1 million in February; the number of unemployed workers fell to 8.7 million. Taken together, the result was a slight drop in the job-seekers-to-job-openings ratio. In February, there were 1.7 times as many job seekers as job openings. This ratio has been declining steadily from its high of 6.8-to-1 in July 2009, as shown in the figure below.
The job-seekers ratio, December 2000–February 2015
| Month | Unemployed job seekers per job opening |
|---|---|
| Dec-2000 | 1.1 |
| Jan-2001 | 1.1 |
| Feb-2001 | 1.3 |
| Mar-2001 | 1.3 |
| Apr-2001 | 1.3 |
| May-2001 | 1.4 |
| Jun-2001 | 1.5 |
| Jul-2001 | 1.5 |
| Aug-2001 | 1.7 |
| Sep-2001 | 1.8 |
| Oct-2001 | 2.1 |
| Nov-2001 | 2.3 |
| Dec-2001 | 2.3 |
| Jan-2002 | 2.3 |
| Feb-2002 | 2.4 |
| Mar-2002 | 2.3 |
| Apr-2002 | 2.6 |
| May-2002 | 2.4 |
| Jun-2002 | 2.5 |
| Jul-2002 | 2.5 |
| Aug-2002 | 2.4 |
| Sep-2002 | 2.5 |
| Oct-2002 | 2.4 |
| Nov-2002 | 2.4 |
| Dec-2002 | 2.8 |
| Jan-2003 | 2.3 |
| Feb-2003 | 2.5 |
| Mar-2003 | 2.8 |
| Apr-2003 | 2.8 |
| May-2003 | 2.8 |
| Jun-2003 | 2.8 |
| Jul-2003 | 2.8 |
| Aug-2003 | 2.7 |
| Sep-2003 | 2.9 |
| Oct-2003 | 2.7 |
| Nov-2003 | 2.6 |
| Dec-2003 | 2.5 |
| Jan-2004 | 2.5 |
| Feb-2004 | 2.4 |
| Mar-2004 | 2.5 |
| Apr-2004 | 2.4 |
| May-2004 | 2.2 |
| Jun-2004 | 2.4 |
| Jul-2004 | 2.1 |
| Aug-2004 | 2.2 |
| Sep-2004 | 2.1 |
| Oct-2004 | 2.1 |
| Nov-2004 | 2.3 |
| Dec-2004 | 2.1 |
| Jan-2005 | 2.2 |
| Feb-2005 | 2.1 |
| Mar-2005 | 2.0 |
| Apr-2005 | 1.9 |
| May-2005 | 2.0 |
| Jun-2005 | 1.9 |
| Jul-2005 | 1.8 |
| Aug-2005 | 1.8 |
| Sep-2005 | 1.8 |
| Oct-2005 | 1.8 |
| Nov-2005 | 1.7 |
| Dec-2005 | 1.7 |
| Jan-2006 | 1.7 |
| Feb-2006 | 1.7 |
| Mar-2006 | 1.6 |
| Apr-2006 | 1.6 |
| May-2006 | 1.6 |
| Jun-2006 | 1.6 |
| Jul-2006 | 1.8 |
| Aug-2006 | 1.6 |
| Sep-2006 | 1.5 |
| Oct-2006 | 1.5 |
| Nov-2006 | 1.5 |
| Dec-2006 | 1.5 |
| Jan-2007 | 1.6 |
| Feb-2007 | 1.5 |
| Mar-2007 | 1.4 |
| Apr-2007 | 1.5 |
| May-2007 | 1.5 |
| Jun-2007 | 1.5 |
| Jul-2007 | 1.6 |
| Aug-2007 | 1.6 |
| Sep-2007 | 1.6 |
| Oct-2007 | 1.7 |
| Nov-2007 | 1.7 |
| Dec-2007 | 1.8 |
| Jan-2008 | 1.8 |
| Feb-2008 | 1.9 |
| Mar-2008 | 1.9 |
| Apr-2008 | 2.0 |
| May-2008 | 2.1 |
| Jun-2008 | 2.3 |
| Jul-2008 | 2.4 |
| Aug-2008 | 2.6 |
| Sep-2008 | 3.0 |
| Oct-2008 | 3.1 |
| Nov-2008 | 3.4 |
| Dec-2008 | 3.7 |
| Jan-2009 | 4.4 |
| Feb-2009 | 4.6 |
| Mar-2009 | 5.4 |
| Apr-2009 | 6.1 |
| May-2009 | 6.0 |
| Jun-2009 | 6.2 |
| Jul-2009 | 6.8 |
| Aug-2009 | 6.5 |
| Sep-2009 | 6.2 |
| Oct-2009 | 6.5 |
| Nov-2009 | 6.3 |
| Dec-2009 | 6.1 |
| Jan-2010 | 5.6 |
| Feb-2010 | 5.9 |
| Mar-2010 | 5.7 |
| Apr-2010 | 4.9 |
| May-2010 | 5.1 |
| Jun-2010 | 5.3 |
| Jul-2010 | 5.0 |
| Aug-2010 | 5.1 |
| Sep-2010 | 5.2 |
| Oct-2010 | 4.8 |
| Nov-2010 | 4.9 |
| Dec-2010 | 4.9 |
| Jan-2011 | 4.8 |
| Feb-2011 | 4.5 |
| Mar-2011 | 4.4 |
| Apr-2011 | 4.5 |
| May-2011 | 4.6 |
| Jun-2011 | 4.4 |
| Jul-2011 | 4.0 |
| Aug-2011 | 4.4 |
| Sep-2011 | 3.9 |
| Oct-2011 | 4.0 |
| Nov-2011 | 4.1 |
| Dec-2011 | 3.7 |
| Jan-2012 | 3.5 |
| Feb-2012 | 3.6 |
| Mar-2012 | 3.3 |
| Apr-2012 | 3.5 |
| May-2012 | 3.4 |
| Jun-2012 | 3.4 |
| Jul-2012 | 3.5 |
| Aug-2012 | 3.4 |
| Sep-2012 | 3.3 |
| Oct-2012 | 3.3 |
| Nov-2012 | 3.2 |
| Dec-2012 | 3.4 |
| Jan-2013 | 3.3 |
| Feb-2013 | 3.0 |
| Mar-2013 | 3.0 |
| Apr-2013 | 3.1 |
| May-2013 | 3.0 |
| Jun-2013 | 3.0 |
| Jul-2013 | 3.0 |
| Aug-2013 | 2.9 |
| Sep-2013 | 2.8 |
| Oct-2013 | 2.7 |
| Nov-2013 | 2.7 |
| Dec-2013 | 2.6 |
| Jan-2014 | 2.6 |
| Feb-2014 | 2.5 |
| Mar-2014 | 2.5 |
| Apr-2014 | 2.2 |
| May-2014 | 2.1 |
| Jun-2014 | 2.0 |
| Jul-2014 | 2.0 |
| Aug-2014 | 1.9 |
| Sep-2014 | 2.0 |
| Oct-2014 | 1.9 |
| Nov-2014 | 1.9 |
| Dec-2014 | 1.8 |
| Jan-2015 | 1.8 |
| Feb-2015 | 1.7 |
Note: Shaded areas denote recessions.
Source: EPI analysis of Bureau of Labor Statistics Job Openings and Labor Turnover Survey and Current Population Survey
What’s notably missing from the story are the millions of workers who have been sidelined because of weak job opportunities. When the number of unemployed workers fell in February, the numbers of missing workers ticked up. While it’s important not to put too much weight into any one month’s number, it’s unlikely that a continued fall in the job-seekers-to-job-openings ratio is sustainable in the near term as more workers enter or re-enter the labor force when job opportunities grow.
Millions of potential workers sidelined: Missing workers,* January 2006–March 2015
| Date | Missing workers |
|---|---|
| 2006-01-01 | 610,000 |
| 2006-02-01 | 160,000 |
| 2006-03-01 | 190,000 |
| 2006-04-01 | 300,000 |
| 2006-05-01 | 170,000 |
| 2006-06-01 | 110,000 |
| 2006-07-01 | 60,000 |
| 2006-08-01 | -140,000 |
| 2006-09-01 | 90,000 |
| 2006-10-01 | -130,000 |
| 2006-11-01 | -380,000 |
| 2006-12-01 | -650,000 |
| 2007-01-01 | -670,000 |
| 2007-02-01 | -480,000 |
| 2007-03-01 | -420,000 |
| 2007-04-01 | 340,000 |
| 2007-05-01 | 200,000 |
| 2007-06-01 | 80,000 |
| 2007-07-01 | 90,000 |
| 2007-08-01 | 560,000 |
| 2007-09-01 | 150,000 |
| 2007-10-01 | 480,000 |
| 2007-11-01 | -140,000 |
| 2007-12-01 | -250,000 |
| 2008-01-01 | -790,000 |
| 2008-02-01 | -330,000 |
| 2008-03-01 | -480,000 |
| 2008-04-01 | -260,000 |
| 2008-05-01 | -730,000 |
| 2008-06-01 | -610,000 |
| 2008-07-01 | -640,000 |
| 2008-08-01 | -650,000 |
| 2008-09-01 | -350,000 |
| 2008-10-01 | -550,000 |
| 2008-11-01 | -300,000 |
| 2008-12-01 | -300,000 |
| 2009-01-01 | -100,000 |
| 2009-02-01 | -230,000 |
| 2009-03-01 | 210,000 |
| 2009-04-01 | -130,000 |
| 2009-05-01 | -200,000 |
| 2009-06-01 | -260,000 |
| 2009-07-01 | 120,000 |
| 2009-08-01 | 410,000 |
| 2009-09-01 | 1,220,000 |
| 2009-10-01 | 1,350,000 |
| 2009-11-01 | 1,400,000 |
| 2009-12-01 | 2,100,000 |
| 2010-01-01 | 1,660,000 |
| 2010-02-01 | 1,540,000 |
| 2010-03-01 | 1,320,000 |
| 2010-04-01 | 770,000 |
| 2010-05-01 | 1,330,000 |
| 2010-06-01 | 1,710,000 |
| 2010-07-01 | 1,880,000 |
| 2010-08-01 | 1,490,000 |
| 2010-09-01 | 1,850,000 |
| 2010-10-01 | 2,320,000 |
| 2010-11-01 | 1,960,000 |
| 2010-12-01 | 2,390,000 |
| 2011-01-01 | 2,460,000 |
| 2011-02-01 | 2,630,000 |
| 2011-03-01 | 2,430,000 |
| 2011-04-01 | 2,500,000 |
| 2011-05-01 | 2,590,000 |
| 2011-06-01 | 2,670,000 |
| 2011-07-01 | 3,110,000 |
| 2011-08-01 | 2,520,000 |
| 2011-09-01 | 2,510,000 |
| 2011-10-01 | 2,540,000 |
| 2011-11-01 | 2,510,000 |
| 2011-12-01 | 2,470,000 |
| 2012-01-01 | 2,780,000 |
| 2012-02-01 | 2,540,000 |
| 2012-03-01 | 2,530,000 |
| 2012-04-01 | 2,890,000 |
| 2012-05-01 | 2,480,000 |
| 2012-06-01 | 2,240,000 |
| 2012-07-01 | 2,770,000 |
| 2012-08-01 | 2,830,000 |
| 2012-09-01 | 2,690,000 |
| 2012-10-01 | 2,130,000 |
| 2012-11-01 | 2,480,000 |
| 2012-12-01 | 2,060,000 |
| 2013-01-01 | 2,340,000 |
| 2013-02-01 | 2,690,000 |
| 2013-03-01 | 3,130,000 |
| 2013-04-01 | 2,880,000 |
| 2013-05-01 | 2,740,000 |
| 2013-06-01 | 2,580,000 |
| 2013-07-01 | 2,860,000 |
| 2013-08-01 | 3,010,000 |
| 2013-09-01 | 3,130,000 |
| 2013-10-01 | 3,810,000 |
| 2013-11-01 | 3,360,000 |
| 2013-12-01 | 3,550,000 |
| 2014-01-01 | 3,420,000 |
| 2014-02-01 | 3,200,000 |
| 2014-03-01 | 2,840,000 |
| 2014-04-01 | 3,670,000 |
| 2014-05-01 | 3,410,000 |
| 2014-06-01 | 3,320,000 |
| 2014-07-01 | 3,170,000 |
| 2014-08-01 | 3,260,000 |
| 2014-09-01 | 3,580,000 |
| 2014-10-01 | 3,060,000 |
| 2014-11-01 | 3,030,000 |
| 2014-12-01 | 3,230,000 |
| 2015-01-01 | 2,860,000 |
| 2015-02-01 | 3,110,000 |
| 2015-03-01 | 3,330,000 |
* Potential workers who, due to weak job opportunities, are neither employed nor actively seeking work
Note: Volatility in the number of missing workers in 2006–2008, including cases of negative numbers of missing workers, is simply the result of month-to-month variability in the sample. The Great Recession–induced pool of missing workers began to form and grow starting in late 2008.
Source: EPI analysis of Current Population Survey public data series
H-1B Proponents Hide Abuses Behind Phony Claims
This piece originally appeared in The Hill.
The April Fool is anyone who reads Alex Nowrasteh’s column about H-1B guest-workers and believes his bunk. If he had actually read the paper he cites about the effect of H-1B workers on American productivity he’d know that his claims are ludicrous. The paper doesn’t find that H-1B workers “have increased American productivity by 10 to 25 percent from 1990 to 2010”; it makes that estimate for the entire foreign STEM workforce, which includes one hundred thousand foreign students in the Optional Practical Training program who graduated with STEM degrees from U.S. schools, L-1 visa holders, and 300,000…