Sluggish Wage Growth Over the Last Year Is Not Due to the Mix of Jobs Being Created
Over the last year, and, in fact, over the last five years, nominal wage growth has been slow—slow by historic standards and slow relative to wage growth that would be consistent with the Fed’s 2 percent overall price inflation target. Hourly wage growth has run at about 2 percent a year and, as we’ve discussed in great length, 2 percent hourly wage growth is far below the 3.5-4 percent target growth that is consistent with the Fed’s target of 2 percent price inflation and a 1.5 to 2.0 percent trend in productivity growth.
Wage growth that exceeds this 3.5 to 4 percent target for a period of time is not an economic problem to be solved. Rather, it is a normal pattern of the labor share of corporate sector income finally recovering its pre Great Recession levels. If last month’s weak job growth is just a blip and healthy job growth continues in the next year, this should eventually lead to a labor market tight enough to finally provide workers with the bargaining power necessary to bid up their wages.
There has been some discussion that the sluggish wage growth we’ve seen since the recovery began in 2009 is driven in large part by the mix of jobs being created, as if we have lower wages simply because the economy is adding more low-wage jobs. Earlier in the recovery there was likely some truth to this, as lower-wage sectors saw the first pickup in job growth. However, over the last year jobs have been created throughout the economy in high-, low-, and middle- wage sectors. The evidence suggests that the economy has been adding jobs in proportion to the rate that those jobs already exist in the economy.
Nominal wage growth has been far below target in the recovery: Year-over-year change in private-sector nominal average hourly earnings, 2007–2015
| All nonfarm employees | Production/nonsupervisory workers | |
|---|---|---|
| Mar-2007 | 3.5910224% | 4.1112455% |
| Apr-2007 | 3.2738095% | 3.8461538% |
| May-2007 | 3.7257824% | 4.1441441% |
| Jun-2007 | 3.8062284% | 4.1267943% |
| Jul-2007 | 3.4482759% | 4.0524434% |
| Aug-2007 | 3.4940945% | 4.0404040% |
| Sep-2007 | 3.2827046% | 4.1493776% |
| Oct-2007 | 3.2778865% | 3.7780401% |
| Nov-2007 | 3.2714844% | 3.8869258% |
| Dec-2007 | 3.1599417% | 3.8123167% |
| Jan-2008 | 3.1067961% | 3.8619075% |
| Feb-2008 | 3.0947776% | 3.7296037% |
| Mar-2008 | 3.0813674% | 3.7746806% |
| Apr-2008 | 2.8818444% | 3.7037037% |
| May-2008 | 3.0172414% | 3.6908881% |
| Jun-2008 | 2.6666667% | 3.6186100% |
| Jul-2008 | 3.0000000% | 3.7227950% |
| Aug-2008 | 3.3285782% | 3.8263849% |
| Sep-2008 | 3.2258065% | 3.6425726% |
| Oct-2008 | 3.3159640% | 3.9249147% |
| Nov-2008 | 3.6406619% | 3.8548753% |
| Dec-2008 | 3.5815269% | 3.8418079% |
| Jan-2009 | 3.5781544% | 3.7183099% |
| Feb-2009 | 3.2363977% | 3.6516854% |
| Mar-2009 | 3.1293788% | 3.5254617% |
| Apr-2009 | 3.2212885% | 3.2924107% |
| May-2009 | 2.8358903% | 3.0589544% |
| Jun-2009 | 2.7829314% | 2.9379157% |
| Jul-2009 | 2.5889968% | 2.7056875% |
| Aug-2009 | 2.3930051% | 2.6402640% |
| Sep-2009 | 2.3437500% | 2.7457441% |
| Oct-2009 | 2.3383769% | 2.6272578% |
| Nov-2009 | 2.0529197% | 2.6746725% |
| Dec-2009 | 1.8198362% | 2.5027203% |
| Jan-2010 | 1.9545455% | 2.6072787% |
| Feb-2010 | 1.9990913% | 2.4932249% |
| Mar-2010 | 1.7663043% | 2.2702703% |
| Apr-2010 | 1.8091361% | 2.4311183% |
| May-2010 | 1.9439421% | 2.5903940% |
| Jun-2010 | 1.7148014% | 2.5309639% |
| Jul-2010 | 1.8476791% | 2.4731183% |
| Aug-2010 | 1.7528090% | 2.4115756% |
| Sep-2010 | 1.8410418% | 2.2982362% |
| Oct-2010 | 1.8817204% | 2.5066667% |
| Nov-2010 | 1.6540009% | 2.2328549% |
| Dec-2010 | 1.7426273% | 2.0700637% |
| Jan-2011 | 1.9170753% | 2.1704606% |
| Feb-2011 | 1.8708241% | 2.1152829% |
| Mar-2011 | 1.8691589% | 2.0613108% |
| Apr-2011 | 1.9102621% | 2.1097046% |
| May-2011 | 1.9955654% | 2.1567596% |
| Jun-2011 | 2.1295475% | 1.9957983% |
| Jul-2011 | 2.2566372% | 2.3084995% |
| Aug-2011 | 1.8992933% | 1.9884877% |
| Sep-2011 | 1.9400353% | 1.9331243% |
| Oct-2011 | 2.1108179% | 1.7689906% |
| Nov-2011 | 2.0228672% | 1.7680707% |
| Dec-2011 | 1.9762846% | 1.7680707% |
| Jan-2012 | 1.7497813% | 1.3989637% |
| Feb-2012 | 1.8801924% | 1.4500259% |
| Mar-2012 | 2.0969856% | 1.7607457% |
| Apr-2012 | 2.0052310% | 1.7561983% |
| May-2012 | 1.8260870% | 1.3903193% |
| Jun-2012 | 1.9548219% | 1.5447992% |
| Jul-2012 | 1.7741238% | 1.3333333% |
| Aug-2012 | 1.8205462% | 1.3340174% |
| Sep-2012 | 1.9896194% | 1.4351615% |
| Oct-2012 | 1.5073213% | 1.2781186% |
| Nov-2012 | 1.8965517% | 1.4307614% |
| Dec-2012 | 2.1963824% | 1.7373531% |
| Jan-2013 | 2.1496131% | 1.8906490% |
| Feb-2013 | 2.1030043% | 2.0418581% |
| Mar-2013 | 1.9255456% | 1.8829517% |
| Apr-2013 | 2.0085470% | 1.7258883% |
| May-2013 | 2.0068318% | 1.8791265% |
| Jun-2013 | 2.1303792% | 2.0283976% |
| Jul-2013 | 1.9132653% | 1.9230769% |
| Aug-2013 | 2.2562793% | 2.1772152% |
| Sep-2013 | 2.0356234% | 2.1728146% |
| Oct-2013 | 2.2486211% | 2.2715800% |
| Nov-2013 | 2.2419628% | 2.3173804% |
| Dec-2013 | 1.8963338% | 2.1597187% |
| Jan-2014 | 1.9360269% | 2.3069208% |
| Feb-2014 | 2.1437579% | 2.4512256% |
| Mar-2014 | 2.1830395% | 2.3976024% |
| Apr-2014 | 1.9689987% | 2.3952096% |
| May-2014 | 2.1347844% | 2.4426720% |
| Jun-2014 | 2.0442219% | 2.3359841% |
| Jul-2014 | 2.0859408% | 2.4329692% |
| Aug-2014 | 2.2064946% | 2.4777007% |
| Sep-2014 | 2.0365752% | 2.2749753% |
| Oct-2014 | 2.0331950% | 2.2704837% |
| Nov-2014 | 2.1100538% | 2.2648941% |
| Dec-2014 | 1.8196857% | 1.8682399% |
| Jan-2015 | 2.2295623% | 2.0098039% |
| Feb-2015 | 1.975309% | 1.6601563% |
| Mar-2015 | 2.054232% | 1.8536585% |
| Apr-2015 | 2.177486% | 1.8518519% |
* Nominal wage growth consistent with the Federal Reserve Board's 2 percent inflation target, 1.5 percent productivity growth, and a stable labor share of income.
Source: EPI analysis of Bureau of Labor Statistics Current Employment Statistics public data series
Let’s look at this by industrial sector. If we identify sectors as low-, middle-, and high-wage, there are several ways to cut the data. Here’s one way:
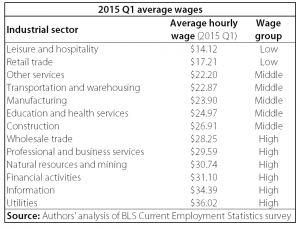
The economy-wide average hourly wage in the first quarter of 2015 was $24.80. There are several industries with wages right around the average, and a couple obviously lower and a few obviously higher.
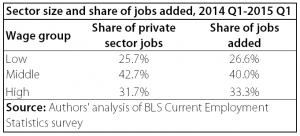
So, now, let’s look at job creation. In the first quarter of 2014, low-wage jobs were 25.7 percent of the private sector economy. Over the last year, 26.6 percent of low-wage jobs added were in low-wage sectors. That looks relatively proportional. It’s a similar story at the middle and high ends of the wage-sector spectrum. Jobs are being added relatively in proportion to their share; therefore, it doesn’t appear that low-wage job growth is leading to sluggish wage growth.
Another way to look at this is how much the combination of each sector’s wages and sector share of the economy contribute to average wages. If overall wages are failing to grow simply because the jobs our economy has been recently adding are disproportionately low wage, we would expect low-wage sectors’ contribution to average wages to increase. For example, leisure and hospitality’s contribution to average wages is 7.4 percent, a contribution that has increased 0.1 percent since 2014, arguably a small amount. At the same time, we see higher-wage sectors’ contribution to average wages increasing, albeit slightly as well. Professional and business service wages contribute 20.2 percent to overall average wages in the first quarter of 2015, a contribution which has increased 0.2 percent since 2014.
In truth, over the past year we are adding both high wage and low wage jobs in numbers roughly proportionate to those sectors’ share of the overall economy. Overall wages are failing to grow over this period not because of the job composition of the economy, but because there is a lack of broad-based demand for workers and workers in nearly all sectors are having great trouble wresting raises from their employers.
Enjoyed this post?
Sign up for EPI's newsletter so you never miss our research and insights on ways to make the economy work better for everyone.