Panel on tax fairness and reform helps address common misperceptions
I had the opportunity to participate in an Americans for Democratic Action panel discussion yesterday on tax fairness. The panel, called “Tax Equity: Paying Fair,” was moderated by John Nichols of The Nation and included panelists Bob McIntyre of Citizens for Tax Justice, Mike Lapham of United for a Fair Economy, Dean Baker of the Center for Economic and Policy Research, Elspeth Gilmore of Resource Generation, and Chuck Marr of the Center on Budget and Policy Priorities. It was an honor to participate alongside them.
The panel covered a number of topics, including the Buffett Rule, the Paul Ryan budget, the George W. Bush-era tax cuts, the equalization of tax rates for capital and labor income, corporate tax dodging, and a financial transactions tax. But beyond the wonkier side of tax policy, Baker raised an important point that merits highlighting. He talked about people’s misperceptions regarding how much federal income tax they actually pay—in other words, confusion of marginal tax rates for (lower) effective rates. For example, the second highest tax bracket (33 percent) is assessed for single filers on taxable income between $174,400 and $379,150 (for the tax year 2011 returns due April 17). If you are a single filer with $180,000 in annual taxable income, you do not pay 33 percent on all of your income—as is widely misperceived. You would pay 33 percent only on your total income (less the personal exemption, deductions, and exclusions) exceeding $174,400. In this case, only $5,600 of your total income would be subject to the 33 percent rate.
I was really glad to see Dean Baker bring up the point of marginal versus effective tax rate confusion, because I think widespread misperception unduly adds to public fears of returning to Clinton-era tax rates. Raising the top tax bracket from 35 percent to 39.6 percent will only very marginally impact what high earners pay. Most Americans simply do not make enough to be subject to top income tax rates; President Obama’s proposal to extend the Bush tax cuts for households with less than $200,000 ($250,000 for joint filers) in adjusted gross income—letting only the top two rates expire—would result in a tax increase for only 2.1 percent of households. I was hoping to make a similar point to Baker’s, had there been more time for that in our conversation. I was recently struck by a portrayal of tax rate perceptions and reality in Bruce Bartlett’s new book on tax reform, The Benefit and the Burden. Bartlett draws from a CBS News/New York Times poll from April 14, 2010, that asks the following:
On average, about what percentage of their household incomes would you guess most Americans pay in federal income taxes each year: less than 10 percent, between 10 and 20 percent, between 20 and 30 percent, between 30 and 40 percent, between 40 and 50 percent, or more than 50 percent, or don’t you know enough to say?
The results are depicted below. The respondents indicated they believed 5 percent of Americans pay less than 10 percent of their income in federal income taxes. The reality is 86.5 percent of Americans actually did, in 2010. Additionally, respondents indicated they believed 38 percent of Americans pay over 20 percent of their income in federal income taxes. The reality: Only 0.6 percent of Americans pay over 20 percent of their income in federal income taxes.
| Tax percentage/income | Perception | Reality |
| Less than 10% |
5% |
86.5% |
| 10-20% |
26% |
12.9% |
| 20-30% |
25% |
0.6% |
| 30-40% |
10% |
|
| 40-50% |
2% |
|
| More than 50% |
1% |
|
| Don’t know |
31% |
n/a |
Source: The Benefit and the Burden, 2012
Thank God for trial lawyers
For many years, Corporate America has been waging a campaign to vilify the lawyers who bring suits against them. After decades of knowingly exposing workers and consumers to potentially fatal asbestos, the companies that had profited tried to kill asbestos litigation when lawsuits began to bankrupt them. When tort suits helped workers get real compensation for disabling injuries from unsafe machinery, the corporations moved to bar the suits. When class-action lawsuits proved to be an effective way to bring claims against giant corporate wrongdoers, Congress passed new laws to make such suits more difficult. And when doctors and hospitals began to pay heavily for medical malpractice, they started campaigns in every state and in Congress to limit the damages that could be awarded against them.
All of the harm that corporations and other actors have done to the public—the subjects of so much litigation—could have been better controlled by regulation with real teeth and effective enforcement. Asbestos could have been banned decades ago, as it was in most of Europe. Machines could have been required to have better lock-out mechanisms and better guarding as they were manufactured, to ensure that employees would never be maimed or killed. Drug tests could have been required to be conducted with more independence and transparency, with conflicts of interest prevented. And hospitals could be regulated to prevent unnecessary infections, misadministration of medicines, and surgery on the wrong patient or wrong limb.
But our political culture resists regulation, and even when we have regulation, the government does not always enforce it energetically. Thus, we do have a law and regulations that forbid for-profit employers from employing workers without paying them the minimum wage. And those regulations forbid the employment of students or anyone else as interns (except in very limited circumstances) without paying the minimum wage. The Department of Labor, however, does almost nothing to enforce the law in this area. Moreover, the token penalties in this and most areas of labor law lead companies to treat them as a cost of doing business.
So I was delighted to see the trial bar take this issue on, with a highly respected New York law firm suing Fox Searchlight and Hearst Corporation for failing to pay various employees the corporations called “interns,” including college graduates and even a CPA.
The effect of these suits has been salutary! Already, the media report that other employers have taken notice and law firms are now advising clients not to break the law. One USA Today headline read, “Fewer Unpaid Internships to Be Offered.”
I hope the headline is accurate, and if it is, it will be due to the efforts of Outen and Golden, LLP. The New York law firm is doing the work our government ought to be doing.
Thank God for trial lawyers.
Robert Lawrence misleads the New York Times on manufacturing
Last week, Eduardo Porter wrote in the New York Times’ Economix blog about a response he received on his recent piece on manufacturing from Robert Lawrence of the Kennedy School. Porter should have dug into the topic further because what Lawrence wrote was rather misleading. Here are Porter’s words:
“Prof. Robert Lawrence from Harvard makes an interesting point in response to my Wednesday column about our misplaced hopes in manufacturing as a source of new jobs: even if every single thing we bought was “made in America” — if we stopped multinationals from outsourcing production to China and closed our doors to imports — even then, manufacturing employment would lag.
The reason is simple: we are spending less and less on goods and more and more on services. In 1969, American consumers were allocating half of all their spending on consumption to goods. By 2010, that share had fallen to one-third.”
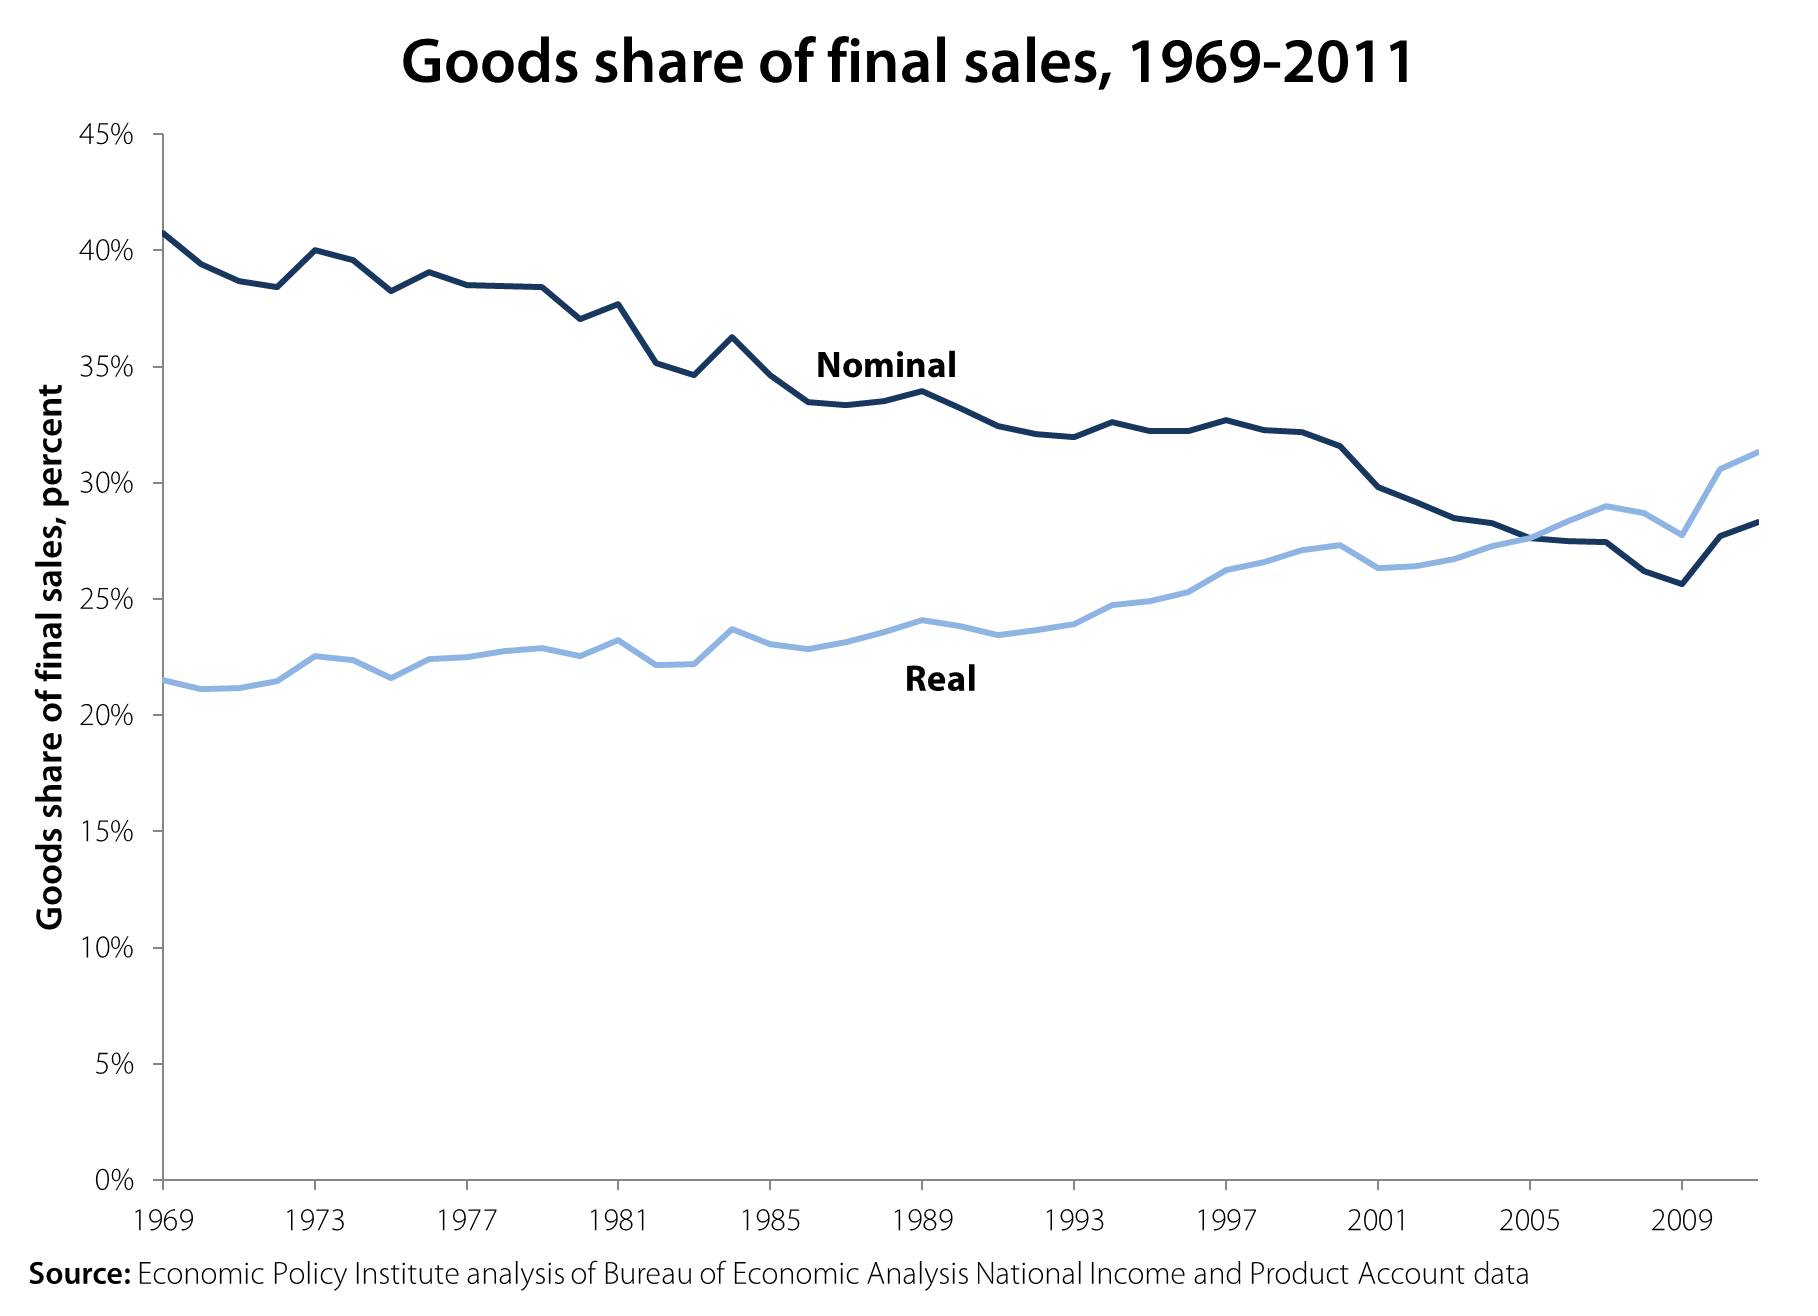
Lawrence clearly wants people to believe that manufacturing jobs are declining because “we” just don’t buy much manufactured stuff anymore, or, in economic terms that there’s less demand for goods now than in the past. But that’s wrong, for a couple of reasons. First, goods are not only produced for household consumption, they are also produced for business and public investment, and for export. Second, and more importantly, the prices of goods have fallen relative to other types of products, so the goods share of total nominal (not inflation-adjusted) spending might fall, but the share in real (inflation-adjusted) spending might not follow. Or, to put it simply, people might have more TVs in their homes than ever before even while the share of their total income they spend on TVs has fallen. But, nobody would describe this state as a declining demand for TVs.
The following graph shows the share of goods in final sales of domestic products (the Bureau of Economic Analysis provides data on major types of products, dividing final sales into goods, services and structures. See NIPA Tables 1.2.5 and 1.2.6). The goods share of final sales in nominal terms did fall from 40.8 percent in 1969 to 28.3 percent in 2011, a roughly 30 percent decline in relative spending. However, the share of goods in real final sales actually rose 50 percent from 21.5 percent in 1969 to 31.3 percent in 2011. This means that the economy was even more goods-intensive in 2011 than in 1969 and that it was not a relative decline in the demand for goods that caused the shrinkage of manufacturing employment.
In the end, manufacturing employment is a horse race between demand for manufactured goods (which boosts jobs) and productivity (which, all else equal, means fewer jobs are needed in the sector). One thing that this analysis should remind us of is that even faster productivity has its upside: As prices fall because productivity rises in this sector, people demand more manufactured goods.
It should be noted, however, that neither Porter nor Lawrence denies that lowering the trade deficit would boost jobs. Rather, Porter says that even without any imports, manufacturing employment would lag. Lawrence, meanwhile, says that even without a trade deficit, goods employment would fall. In reality, closing the trade deficit would provide millions of jobs and boost the economy. For instance, my colleague Robert Scott has shown that growing trade deficits with China eliminated 2.8 million U.S. jobs between 2001 and 2010 alone, including 1.9 million jobs displaced from manufacturing. Similarly, correcting the currency imbalances with China, Hong Kong, Taiwan, Singapore, and Malaysia could add up to $285.7 billion (1.9 percent) to U.S. GDP, create up to 2.25 million jobs over the next 18 to 24 months (most in manufacturing), and reduce U.S. budget deficits by up to $71.4 billion per year.
Moreover, as Scott’s recent blog post notes, the recent recession was especially hard on manufacturing (we lost 2.3 million jobs between 2007 and Jan. 2010) and we can get those jobs back in a robust recovery.
So, sure, manufacturing employment will not return to 25 percent of employment. Nevertheless, we can gain a lot of manufacturing jobs by strengthening the recovery and through appropriate trade and currency policy. This would provide millions of good jobs, aid many communities, and be good for the nation. No head-fakes about household consumption shares should distract us from these facts.
Latinos versus the Census Bureau: When racial categorizations clash
People create races, not nature. Different societies tend to have different systems of racial categorization. Even within the same society, there can be significant changes in racial categorization over time. We can get a sense of this from the fact that U.S. Census Bureau has made changes to the rules for racial classification system in nearly every census.
The guidelines for the 1940 Census (the full data of which was recently released to the public) instructed enumerators that “any mixtures of white and nonwhite blood” should be classified as nonwhite. Additionally, people of “mixed Negro and Indian blood should be reported as Negro” while “other mixtures of nonwhite parentage should be reported according to the race of the father.” These rules only make sense when embedded in the specific U.S. political economy of slavery and Jim Crow.
Today, in post-Civil-Rights-era America, individuals define their own race, not the Census enumerators. Also, in response to lobbying for multiracial categorization, since 2000 the Census Bureau has allowed individuals to select more than one race. In 1940, multiracial categorization in Census data was not possible.
Over the past few decades, the United States has seen a significant increase in the Latino population. Many of these Latinos are immigrants from other countries with other systems of identity and racial classification. These systems of classification may be in conflict with the official directives of the Census Bureau.
According to the Census Bureau, being Hispanic or Latino is an ethnic classification, not a racial classification. For perhaps as much as half of the Latino population, however, Latino is a racial category. A new survey from the Pew Hispanic Center illustrates this fact. When asked “Which of the following describes your race?”, 25 percent of Latinos answered “Hispanic or Latino.” Another 26 percent chose “Some other race”–rejecting the Census-Bureau-recognized racial categories of “white,” “black,” and “Asian.” While some of these “Some other races” may have been looking for “American Indian,” it is doubtful that all or even a majority of them were. They were looking for some racial category that the Census Bureau does not offer.
For many Latinos, “Latino” is understood as a racial category or as something other than an ethnic category in the sense that the Census Bureau intends. The idea of a cultural racial category is not an uncommon one. Nazi Germany, notoriously, institutionalized the category of a Jewish race. In Japan, there is the idea of a Japanese race which would distinguish them not only from non-Asian groups, but from other Asians as well. Groups that are conceptualized as cultural in the United States can be conceptualized as racial elsewhere.
Recently, NPR described George Zimmerman as a “white Latino,” but many of their listeners were confused by the term. This is interesting since according to data from the 2010 census 53 percent of Latinos are white.
The Pew Hispanic Center survey shows us that many Latinos see their group as something akin to a racial group. But the survey does not tell us how non-Latinos perceive and classify Latinos. Do non-Latinos perceive Latinos to be a separate race, an ethnic group, or something else? Latinos’ future in the United States depends not only on how they perceive themselves, but also on how others perceive, classify, and ultimately treat them. One hopes that a future Pew Hispanic Center survey will ask these questions.
Memo to the Times: Hold the funeral march for U.S. manufacturing
A recent commentary by Eduardo Porter in the New York Times claims that a “revolution in manufacturing employment seems far-fetched,” despite the recent recovery of manufacturing employment. Porter then proceeds to pound nails in manufacturing’s supposed coffin, claiming that “most of the factory jobs lost over the last three decades in this country are gone for good. In truth, they are not even very good jobs.” Perhaps not for a physicist like Porter, but manufacturing does provide excellent wages and benefits for many working Americans. And, with 11.9 million jobs today, U.S. manufacturing is very much alive and kicking.
Laura D’Andrea Tyson got the wage issue right in Why Manufacturing Still Matters, a post she wrote for the Times’ Economix blog in February. She notes that manufacturing jobs are “high-productivity, high value-added jobs with good pay and benefits.” According to Tyson, in 2009, “the average manufacturing worker earned $74, 447 in annual pay and benefits, compared with $63,122 for the average non-manufacturing worker.”1 Manufacturing wages and benefits are particularly attractive for workers without a college degree, for whom the alternative is often a job at low pay with no benefits.
Porter is also wrong to suggest that manufacturing employment has been on a downward trend for three decades (see graph below). In fact, manufacturing employment was relatively stable between 1969 and 2000, generally ranging between 16.7 million and 19.6 million workers. During this period, employment in big-ticket, durable goods industries such as autos and aerospace was more volatile than employment in non-durable goods. Starting from a peak in early 1998, U.S. manufacturing declined rapidly after the Asian financial crisis (which caused widespread devaluations in Asia), and total employment in both durable and non-durable goods began a sharp drop. This decline was associated with the rapid growth of the U.S. trade deficit, especially with China. Growing trade deficits with China eliminated 2.8 million U.S. jobs between 2001 and 2010 alone, including 1.9 million jobs displaced from manufacturing. Thus, U.S. job losses in manufacturing are really just a phenomenon of the past decade.2
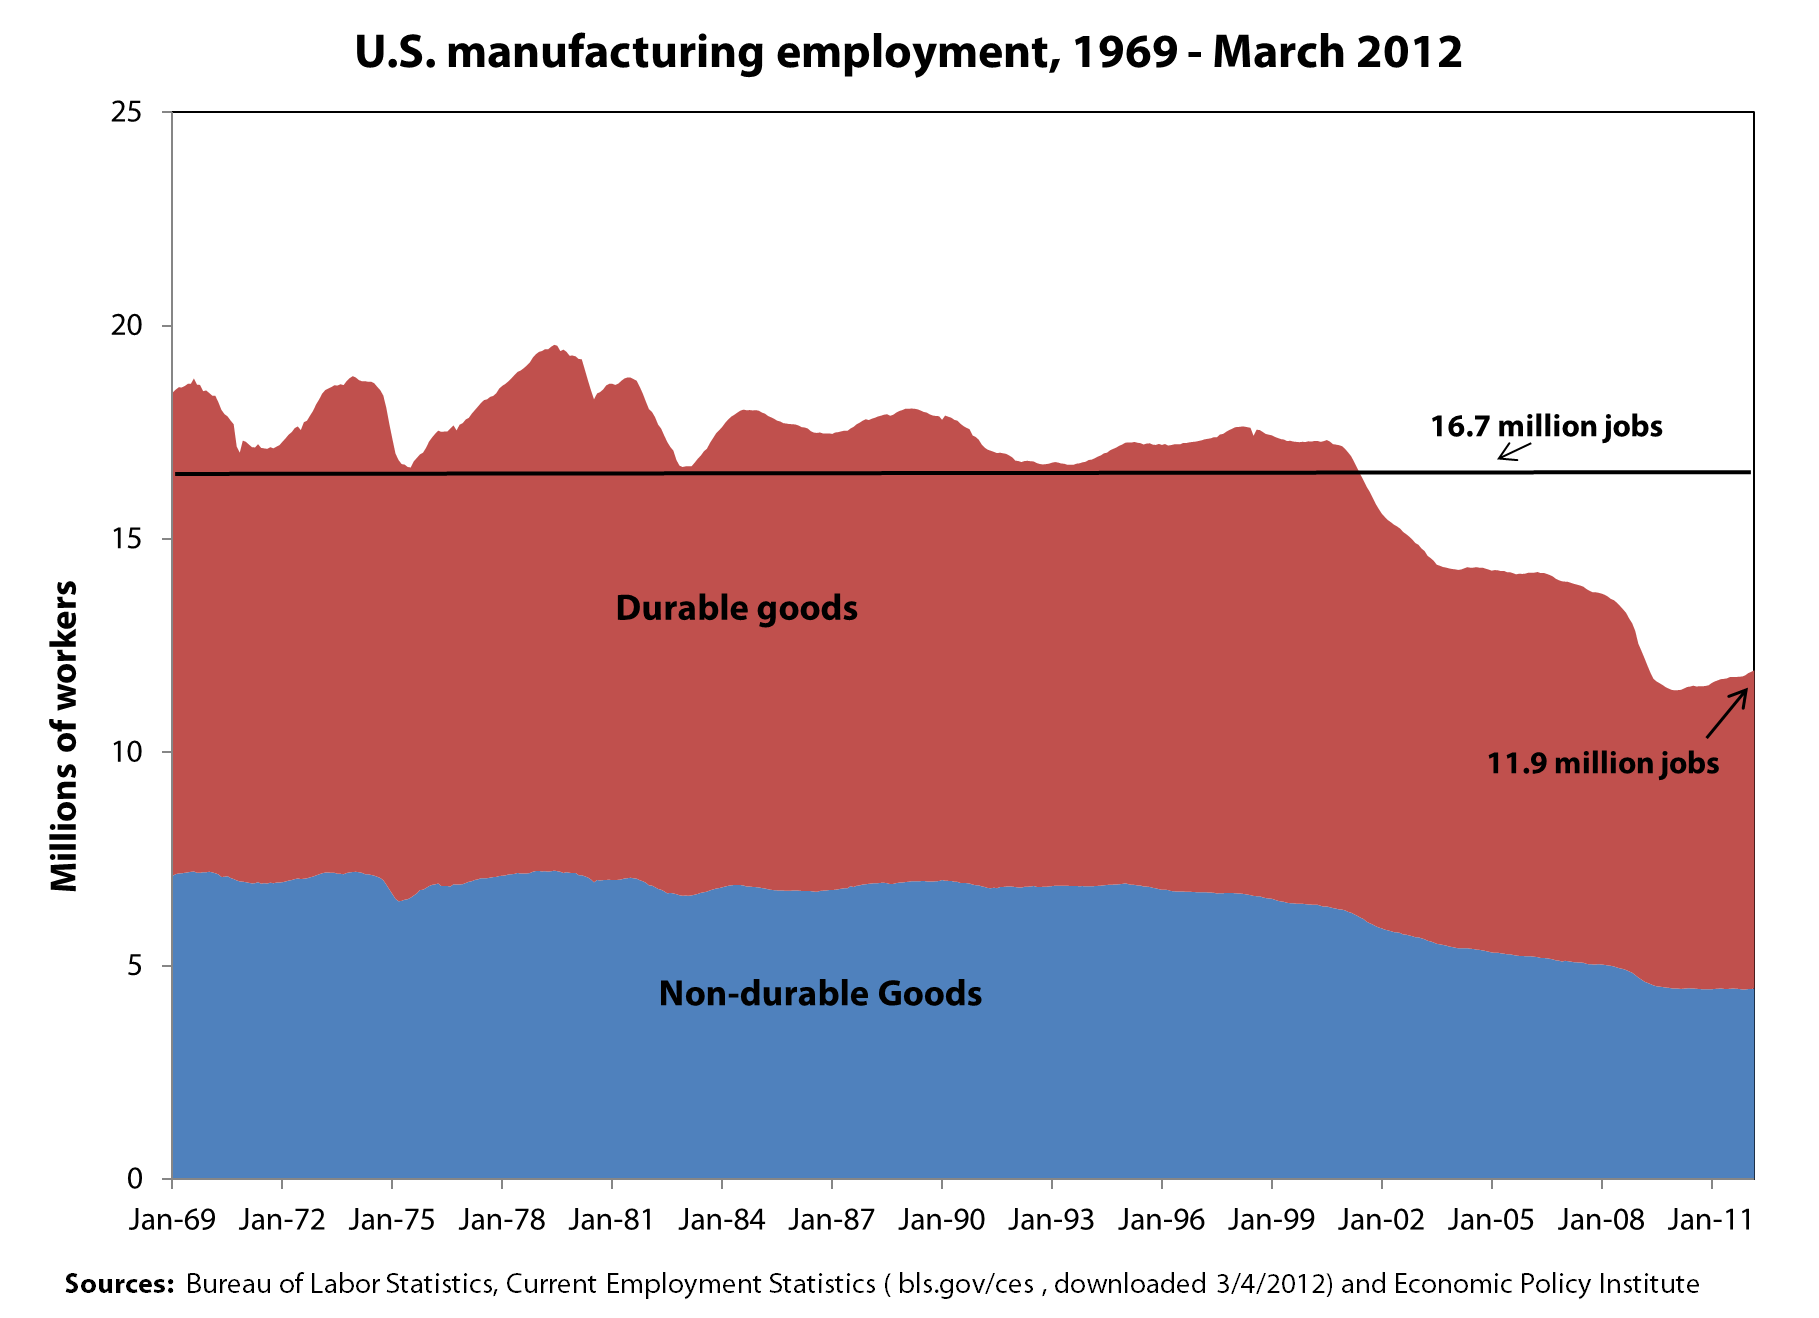
Manufacturing has been hit with two distinct waves of job losses since 2000. Between 2000 and 2007, growing trade deficits were largely responsible for the loss of 3.9 million manufacturing jobs. In this period, employment declined in both non-durables (-20.3 percent) and durables (-19.8 percent) at similar rates. The great recession eliminated another 2.3 million jobs between 2007 and Jan. 2010 as the demand for cars and other manufactured goods collapsed. Employment in durable goods was hit especially hard by the recession, falling an additional 19.7 percent, while employment in durables fell 11.3 percent. However, since the end of the recession, employment in the two sectors has behaved in very different ways, as shown in the graph. Non-durable employment has remained essentially flat, adding only 5,000 jobs (0.1 percent) over the past 26 months, while durable goods industries have added 454,000 jobs (6.7 percent).
It does seem unlikely that the U.S. will recover many jobs in apparel or footwear. However, the non-durables sector also includes chemicals, pharmaceuticals, and petroleum refining. The U.S. exports large amounts of those commodities, and they certainly support the kind of high value-added, high-wage jobs Tyson described.
Durable goods industries such as aerospace products, machine tools, electronics, and motor vehicles and parts also support lots of exports, and those industries could grow with support of appropriate trade and industrial policies. Countries such as Japan and Germany have managed to support large and growing trade surpluses, especially in those sectors, because the vast majority of their exports are manufactured products. And, contrary to Porter’s assertions, they have lost a much smaller share of their manufacturing jobs than the United States. According to OECD statistics, between 2000 and 2009 (from peak to the trough of the recession), Germany lost fewer than 700,000 manufacturing jobs (an 8.3 percent decline). Japan lost 2.1 million (-17.4 percent), and the United States lost 5.7 million (-30.2 percent). The U.S. suffered nearly twice as much manufacturing job loss as Japan, and nearly four times as much as Germany.
Manufacturing employment in each of these countries has been hurt by the recession (although Germany, for example, did much more to prevent manufacturing job loss during the downturn), but the big difference is trade. In the German “Kurzarbeit,” or short work program, firms cut workers’ hours rather than make big layoffs, and the government helps make up the difference in workers’ paychecks (rather than paying unemployment compensation), thus limiting mass unemployment and stabilizing the economy. Growing trade deficits eliminated millions of manufacturing jobs in the United States, while growing trade surpluses helped support manufacturing jobs in Japan and Germany. It didn’t have to be that way, and we can recover lost manufacturing jobs in the future, especially in high-wage, durable goods industries. Read more
Social Security privatizer Pozen attacks public employee pensions
I don’t have any argument with the investment advice Robert Pozen and Theresa Hamacher gave readers of the Washington Post this past Wednesday. Diversification and investment in high-quality funds seems like common sense.
But the highly politicized trashing of public employee pension plans they indulge in along the way is based less on common sense than ideology. Pozen was an investment banker when George W. Bush appointed him to the President’s Commission to Strengthen Social Security. The commission launched Bush’s plan to privatize Social Security, which would have replaced the security of a guaranteed, regular monthly benefit check by making a large portion of their benefit contingent upon the returns from risky investments in the market. Why? Pozen and his fellow commissioners argued that the stock market historically yields much better returns on investment than the average worker gets from their contributions to Social Security:
“It is relatively straightforward to show that, for a given level of funding, a personal account system can offer higher total expected benefits than the current system.”
To illustrate, the commission helpfully provided a chart showing the average real returns (i.e., returns over and above inflation) of stocks from 1802 to 1997. For 20-year and 30-year holding periods, the real return was 7 percent, a nominal rate of about 10 percent. The implication was, of course, that these returns (having persisted for almost 200 years) would go on forever.
Shortly after the commission issued its report, the stock market crashed (a good lesson for a public that had been seduced by years of skyrocketing market values), and it crashed again, even harder, in 2008. Dean Baker points out that when Pozen was trying to cut public funding for Social Security and reduce benefits, he touted the potential returns of the market even though the price-to-earnings ratio was at historic highs (meaning that stocks were historically expensive to buy and unlikely to provide high returns going forward from that point).
Now, when price-to-earnings ratios are relatively low and stocks might be expected to do well for a few years, Pozen considers the market too risky for public pension plans. This seems contradictory (not to mention economically innumerate), but if one’s real goal is not to improve retirement security but to instead simply reduce benefits in public pension plans, there is no inconsistency.
Pozen argues that public employee pension plans are in crisis, or at least that a crisis is “looming.” He says we know this because even though plan liabilities are only about 4 percent of annual GDP according to standard accounting measures, those measures “rely on the existing, deficient rules for pension accounting” and understate the problem. They depend on the plans getting strong returns on their investments – generally about 8 percent in nominal terms and about 5 or 6 percent in real, inflation-adjusted terms. That of course, is less than the stock market returns Pozen and his fellow commissioners cited as the historic average for all 20 and 30-year periods. Pozen says a rate near 8 percent “seems unrealistic based on recent investment returns. Over the past 10 years, the Standard & Poor’s 500-stock index has achieved only a 1.9 percent annualized return.” Remember, Pozen was arguing the exact opposite about the expected returns from stocks when it was (a) convenient to push his policy preferences, and (b) clearly wrong, as P/E ratios meant that stocks were more expensive (and hence had lower expected returns) back then.
Pozen wants public employee plans to use a discount rate of 4 to 5 percent, lowballing their expected investment returns and magnifying their potential underfunding. He joins Andrew Biggs at the American Enterprise Institute and a host of anti-government, anti-public employee conservative commentators whose twin goals are to reduce compensation for public employees and discredit government.
Whatever one thinks of Pozen’s investment advice, his advice on public policy has a dismal track record and deserves skepticism.
The worst recession in 70 years, not the worst recovery
In the Wall Street Journal last week, Edward Lazear penned a column titled The Worst Economic Recovery in History. Let’s take this claim to the data. The figure below directly compares job growth in the recovery from the Great Recession (labeled “2007 recession”) to job growth in the recoveries from the three prior recessions:

It’s clear from the figure that jobs fell much further and faster during the Great Recession than in previous recessions. But looking to the right of the dotted line, we see that job growth in the current recovery is actually stronger than job growth in the recovery following the recession of 2001, and not that much weaker than the recovery following the recession of 1990. The recovery following the 1981 recession outpaces all three by far, but that should not be a shock. The 1990, 2001, and 2007 recessions were all associated with financial crises (savings and loan crisis, dot-com bubble, and housing bust, respectively) and it’s obvious by now that recoveries from such recessions require much stronger medicine. The 1981 recession, by contrast, was largely caused by the Federal Reserve Board raising interest rates to curb inflation. This gave the Fed lots of room to lower rates to provide a boost from interest-sensitive goods, (namely housing and durable goods,) leading to strong job growth. With interest rates currently near zero, that lever has not been available in the Great Recession and its aftermath. (As an aside, it’s worth mentioning the extraordinarily fast growth of government spending that buoyed the 1981 recovery.)
The above figure underscores that the key difference between the job situation at this point in the economic recovery, compared with the same point in the last two recoveries, is the length and severity of the recession that preceded them. In other words, it’s not that job growth in the current recovery is uniquely terrible—it is pretty much in line with the weak recoveries following the last two recessions—it is the Great Recession (and in particular the job loss from Sept. 2008–June 2009) that was uniquely terrible.
Of course, this in no way lets today’s policymakers off the hook; the nation’s labor market remains incredibly weak and the current pace of job growth will needlessly condemn millions of Americans to joblessness for years to come. The key problem in the current economy is depressed demand for goods and services, which (since workers provide goods and services) translates into depressed demand for workers. Effective responses, however, have been hamstrung by destructive orthodoxy. I strongly agree with Lazear that we must “move to a set of economic policies that are aimed at growing the economy.” But his list of policies are either irrelevant (regulatory burden) or actually destructive (cutting government spending) to prospects for a rapid recovery.
Were some of ARRA’s jobs eaten by rising hours?
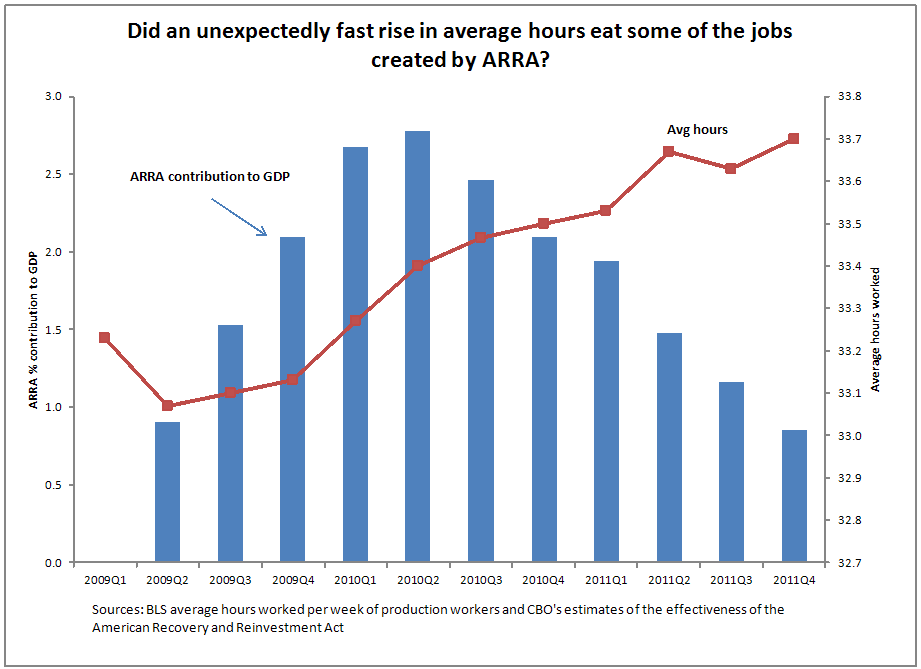
Speaking of rising hours, it’s also interesting to note that the atypically large rise in average hours since the recession’s trough happened to coincide with the period during which the American Recovery and Reinvestment Act (ARRA) was providing its peak boost to economic activity (see the figure below).
Between the first half of 2009 and first half of 2011, ARRA boosted GDP by roughly 1.3 percent. All else equal, this should have been associated with employment in the first quarter of 2011 that was roughly 1.5 million higher and unemployment that was a full percentage point lower by the first quarter of 2011 than would’ve happened without ARRA.*
But, over this same period, average hours worked rose by 1.4 percent. All else equal this implies that about 1.5 million new workers were not needed to absorb rising demand for labor.
To be clear, everybody who tries to translate additional economic activity spurred by ARRA (or anything else) into an increase in employment makes an adjustment for average hours increasing as the economy exits a recession and begins growing again – it’s a pretty typical pattern. But, as pointed out before, the rise in hours in the recovery following the Great Recession was atypically large and the GDP-to-employment translations may have been off because of it.
Of course, the most common criticism levied against ARRA by its critics was some version of the argument that “you guys saying it’s boosting the economy, but job-growth is really slow and unemployment is rising.”
So does the fact that rising hours may have crowded out potential new hires while ARRA was creating new demand then mean that the critics are right about the Recovery Act’s ineffectiveness?
Nope. ARRA created new demand for labor by boosting economic activity. Period. American workers as a group worked more and earned more money because of ARRA.
But it does tell us that we might not be so sure about how this new labor demand was allocated – and in fact it seems like more of it went to increasing the hours of incumbent workers and less went to increasing new hires than we may have thought.
One metric does not change, however: the estimate of full-time equivalent jobs created by ARRA. This measure holds hours constant by design. In short, this seems like the safest bet for having a solid assessment of what ARRA did. And for the record, at its peak during the last half of 2010, full-time employment was between 1 to 6 million higher because of ARRA, regardless of what was happening to hours.
The possibility that lots of the new employment opportunities created by ARRA were filled by increasing hours of incumbent workers rather than new hires may, of course, have meant that that ARRA was less effective from a political perspective. Had more of its boost to economic activity shown up in top-line labor market indicators like new hires and lower unemployment, its proponents (like me) might have had an easier job demonstrating just how important it was.
*All numbers on ARRA’s effectiveness in this post come from the CBO
Washington Post misdiagnoses causes of retirement insecurity
The Washington Post published a story earlier this week by Jia Lynn Yang that had all the information needed to conclude that the 401(k) isn’t working out. She reports that the 401(k) has caused serious stress for working Americans and cites some scary financial data from the Center for Retirement Research. Since Congress created the 401(k) about 30 years ago, financial unpreparedness has gotten much worse: In 1983, researchers found that 31 percent of working age households were “at risk” of losing their standard of living when they retired; by 2009, it was 51 percent. The average worker who retires should have more than $300,000 in their 401(k) account, but in 2007 – even before the markets crashed and wiped out trillions in savings – the average person about to retire had only $78,000. The story didn’t mention that the cumulative underfunding of retirement accounts is nearly $7 trillion.
But instead of fingering the 401(k) as the cause of the stress and retirement insecurity most of us are facing, or even blaming Congress or the employers replacing pensions with a cheaper, badly designed personal account, Yang and her editors conclude that the fault lies with the many employees who are just too “clueless,” as Ms. Lang puts it, to deal with financial responsibility.
This lets the real villians off way too easily. Essentially, the big retirement-policy experiment of the past three decades has been replacing guaranteed pensions with … a tax cut, called 401(k)s. Since the 401(k) is failing so badly to achieve the most important goal our retirement system should have – the achievement of retirement security for most Americans – it should be replaced with something better, and we can put the money gained by closing the 401(k) tax expenditure to better uses. I also disagree with Yang’s statement that “even the program’s biggest critics concede that the system … is here to stay.” Not necessarily. The 401(k) is essentially a tax loophole that over-rewards the well-off for saving money they would have saved anyway. More than 70 percent of the tax deductions are taken by people in the top 20 percent by income. Every member of Congress claims we need to close tax loopholes and non-performing subsidies, and if tax reform ever happens, the 401(k) should be a fat target.
The article suggests that the 401(k)’s failures are really our own: ignorance, irresponsibility, making mistakes. It never mentions the effect on these accounts of the fees charged by plan administrators, investment advisors, and mutual funds, which can shave 25 percent off an account over a lifetime of work and investing. Yang never mentions that employers tend to put far less money into 401(k) plans than they do into pensions, that employers often reduce their contributions or freeze them altogether when times get tough, and that some employers make their contributions in company stock – often a poor choice and one that can lead to insufficiently diversified investments.
Yang does mention that it isn’t easy for individuals “to manage your investments intelligently through stock market highs and lows.” But I’m not sure she understands just how difficult it is, even for a former Assistant Secretary of the Treasury like Alicia Munnell, whom Yang quotes as saying “managing your own money is just horrible.” Market risk is out of one’s control, to a certain extent. To illustrate, Gary Burtless of the Brookings Institution estimated that a 401(k) participant retiring in 1974 would have a retirement income 64 percent lower than that of a worker who retired in 1999 if both workers contributed the same amounts over 40 years to a portfolio split equally between long-term government bonds and stocks (Burtless 2008). In short, two workers pursuing the exact same (and generally sensible) strategy achieve wildly different retirement income possibilities simply because of good or bad timing.
The tens of billions of dollars taxpayers are wasting to subsidize 401(k) savings each year would be much better spent on the more egalitarian, safer, and more nearly universal Social Security retirement system.
Business groups lobby to relax rules on much-abused guest worker program
The L-1 visa, a guest worker category relatively unknown to the general public, has received a lot of attention in the past couple of weeks from businesses that use it, news outlets that cover the technology sector, and now, from organized labor. U.S. Citizenship and Immigration Services (USCIS) is currently developing new interpretive guidance which has the potential to make this dysfunctional temporary work visa category dramatically better or dramatically worse.
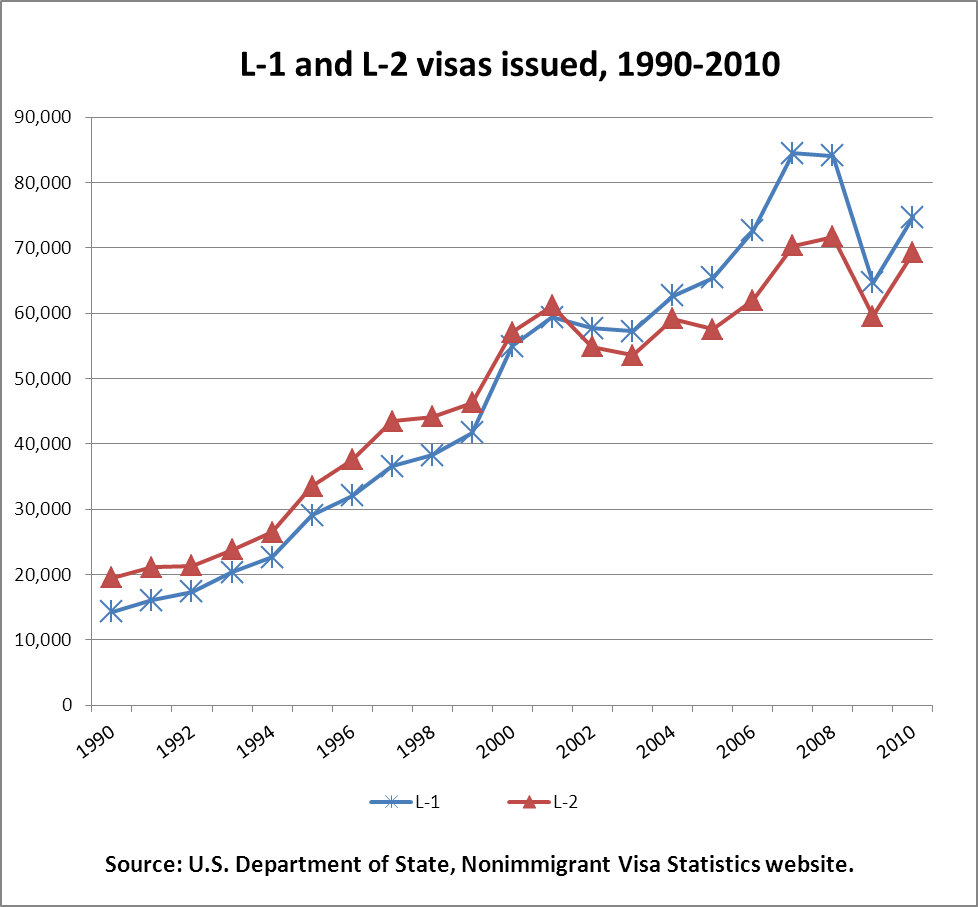
The L-1 allows a multinational company to transfer personnel stationed abroad into the United States if it has a parent, subsidiary, or affiliate company located on U.S. soil. Such a company can petition to hire either a manager or an executive at its U.S. office (known as the L-1A subcategory), or a worker with “specialized knowledge” (L-1B). In 2010, nearly 75,000 L-1 visas were approved, and although they are available to companies in all industries, according to the Department of Homeland Security’s (DHS) Office of Inspector General, “the positions L-1 applicants are filling are most often related to computers and IT.”
But there are a number of serious and systemic problems that have been identified with this visa category.
For example, the L-1 visa has no prevailing or minimum wage requirement, and no requirement that companies first check to see if there is an unemployed U.S. worker available for the job the L-1 worker will fill. There have also been documented cases of companies hiring an L-1 worker, forcing a U.S. worker to train the L-1 worker on how to do their job, and then firing and replacing the U.S. worker with the L-1 temporary worker. The fired worker is then prohibited from speaking a word of this to anyone as a condition of receiving a severance package. The employer is even allowed to pay home country wages to the foreign L-1 worker, which is likely to be tens of thousands of dollars less than what is paid to a similarly skilled U.S. worker. L-1 workers are also unlikely to complain about these low wages or any employer abuse that may occur, because if they speak up and get fired as a result, they are not allowed to take a job with another employer and become instantly deportable. This gives employers access to a lower-paid foreign workforce that has no bargaining power in the workplace.
The huge financial savings and unequal power relationship that employers enjoy when hiring L-1 workers – but especially L-1B workers who are not in executive or managerial positions – is the reason that the U.S. Chamber of Commerce and dozens of multinational companies are lobbying USCIS heavily, urging the agency to make it easier to hire L-1B workers. But that’s also exactly why Professor Ron Hira and I have harshly criticized the negative impact the visa has on the wages and employment opportunities of U.S. workers, and asked USCIS director Alejandro Mayorkas to refrain from expanding the L-1B category at the expense of decent-paying high-tech jobs in the United States.
On Tuesday, as reported in Computerworld, 20 unions that represent workers in high-tech occupations sent a letter to President Obama urging him to do the same. In addition, the IEEE-USA, the largest engineering professional society in the world (representing 210,000 engineers in the U.S.), sent a letter to Mayorkas expressing their concern about how the “L-1 visa program continues to be used in ways that exploit L-1B workers and adversely affect employment opportunities, wages and working conditions for U.S. citizen and permanent resident workers.” The IEEE-USA letter also reminds Mayorkas that the program should “exclude … outsourcing companies whose business models are based on workers acquiring skills, knowledge and contacts in the United States for the purpose of moving American jobs overseas.” Unfortunately, the data reveal that it does not.
The crux of what USCIS is considering has to do with better defining what constitutes a potential employee’s “specialized knowledge” – the legal requirement for the L-1B category. This definition has been problematic for a number of years. Multiple interpretations and guidance from the executive branch and judicial decisions have muddled and expanded the meaning, making it so broad “that adjudicators believe they have little choice but to approve almost all petitions.” This broadening of the legal standard makes it difficult for government officials to reject applications even when they believe them to be fraudulent.
No one disputes that multinational companies should have the right to bring in their brightest, best, most essential and talented personnel to help manage and run their offices in the U.S. But first, they have to show that the workers they bring to the U.S. are indeed highly skilled, and the government must implement basic protections that would prevent adverse effects on the wages and employment of U.S. workers. Since these requirements and protections are not yet part of the L-1 visa program, the L-1B category should not be allowed to grow or expand until they are in place. Instead, it should be curtailed drastically. The new USCIS guidance on L-1B specialized knowledge could help keep good jobs from being sent abroad and protect skilled high-tech workers in the United States – but only if Mayorkas and the Obama administration side with workers instead of the Chamber of Commerce and the high-tech offshoring industry.