Unemployment rising too fast, then falling too fast … going forward, it should (unfortunately) be just right
Has the unemployment rate fallen “too fast” given underlying output growth over the past 18 months? Applying a simple Okun-type relationship between changes in unemployment and the difference between growth rates of actual and potential GDP (or, changes in the output gap) would indicate so. Between the fourth quarter of 2009 and fourth quarter of 2011, the output gap shrank by less than 0.8 percent per year – which historically would only have been associated with a 0.4 percentage-point decline in the unemployment rate. Instead, the unemployment rate fell by 1.2 percentage points – or three times as much as our Okun regression might suggest should’ve happened.
Federal Reserve Chairman Ben Bernanke noted this “too low” unemployment last week (so have Tim Duy and others). While there’s definitely some interesting stuff to examine here, we should first point out the one thing that nobody disagrees about. Going forward from now, the best estimate for what another 24 months of 0.8 percent average output gap reduction will buy us is the one provided by the classic Okun-style relationship: A very slight fall – about 0.4 percentage points – in the unemployment rate.
This cautionary tale about what to expect going forward is sometimes lost as people point out that the too rapid fall in unemployment recently is the mirror image of the too-rapid rise in unemployment in late 2009 and 2010. The graph below shows the actual unemployment rate and the one predicted by regressing two-year changes in unemployment on the two-year change in the output gap, as well the square of the change in the output gap (included to capture a non-linear effect pointed out by Zach Pandl at Goldman-Sachs; no link available, I’m afraid).

The graph clearly shows the too-rapid rise and fall of unemployment relative to predictions over the past couple of years. While interesting, this doesn’t change the most important thing that such an analysis tell us: If we want the unemployment rate to continue falling at the same rate that characterized the past year-and-a-half, we better see much faster GDP growth. As Bernanke said:
“However, to the extent that the decline in the unemployment rate since last summer has brought unemployment back more into line with the level of aggregate demand [note: i.e., recent too-rapid declines “making up for” earlier too-rapid gains], then further significant improvements in unemployment will likely require faster economic growth than we experienced during the past year.”
To be concrete, the Congressional Budget Office is projecting growth in potential GDP of 1.8 and 1.9 percent in 2012 and 2013, respectively. Mark Zandi of Moody’s Analytics is projecting actual GDP growth of 2.5 and 2.9 percent in those years, respectively. This means the two-year change from 2011 is right back at that 0.8 percent difference between actual and potential GDP growth that has characterized the last two years, which means we should expect unemployment to fall by only 0.4 percentage points over that time. This is what people should really know about unemployment changes going forward: absent serious measures to boost growth, they will be excruciatingly slow.
Lastly, it’s worth examining if there’s any odd economic development that might explain the too-rapid rise in actual unemployment between the second quarter of 2009 and the last quarter of 2010 – the time period that saw predicted unemployment begin lagging actual unemployment by more and more.
One pretty clear suspect is fingered in the graph below, which shows the rise in average hours across economic recoveries. For the most recent recovery, the index begins in the second quarter of 2009 (the official trough of the recession).
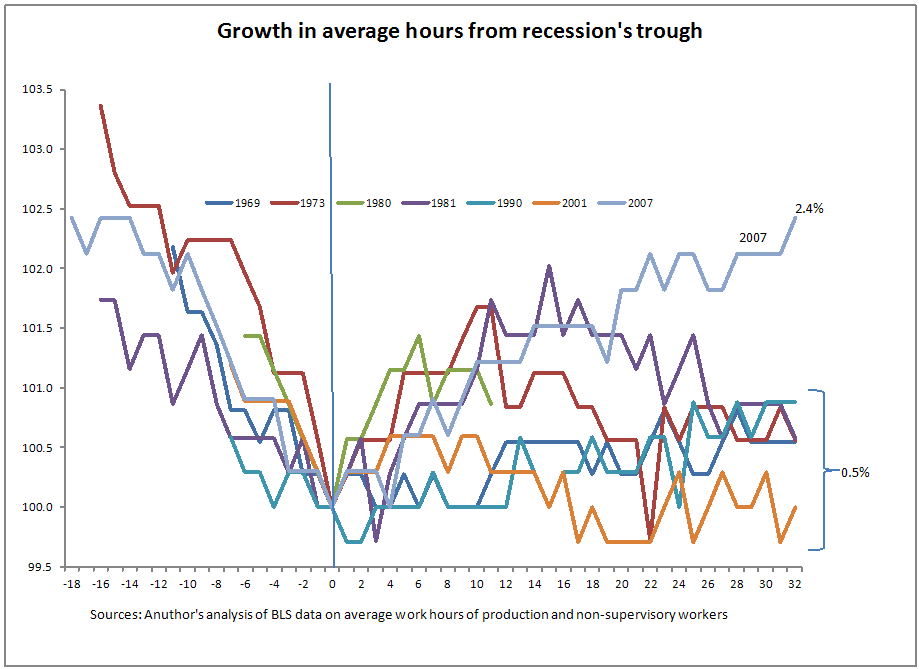
One can see clearly that the rise in average hours worked was atypically fast in the current recovery. In fact, compared to previous averages, the length of the work-week rose by about 2 percent. This is a big deal, representing about 2.3 million workers that did not have to be hired because rising demand was absorbed by rising hours of incumbents instead.
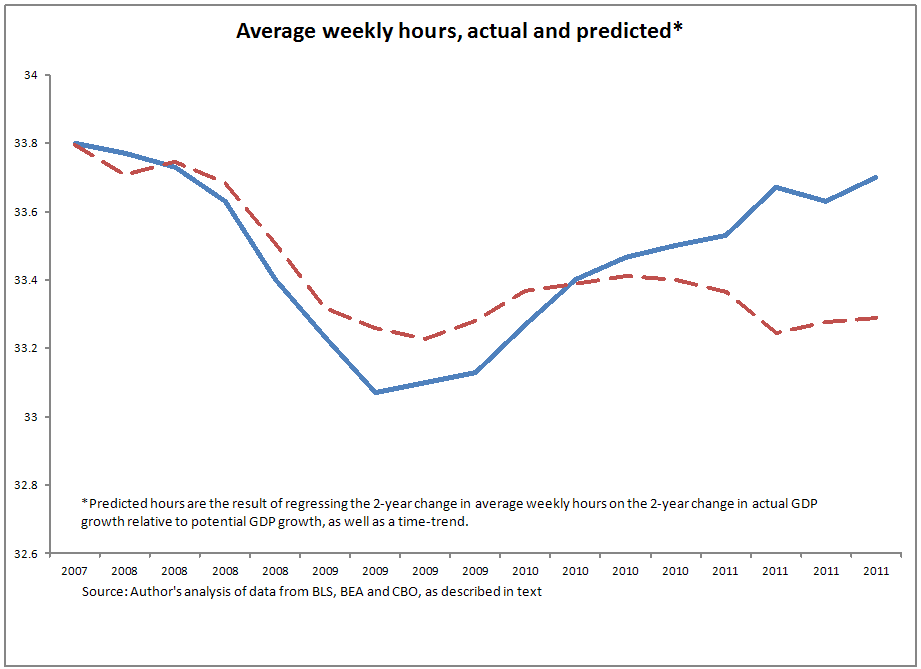
But shouldn’t this change in hours be soaked up in our Okun regressions by the output gap variable (since hours always tend to be procyclical)? Not this time. A regression of the change in hours on the change in the output gap (and a time trend) under-predicts the rise in hours between the second quarter of 2009 and second quarter of 2011 by nearly 2 percent. Between the second quarter of 2011 and the fourth quarter of 2011, the predicted rise is actually slightly greater than the actual rise.
So, what to make of all this?
First, going forward, the best predictor of what will happen to unemployment remains the Okun-based estimates based on GDP growth. Given that most estimates of GDP growth in the next couple of years do not see it beating growth in potential output by much, there is little reason to expect that the recent rapid declines in unemployment rates will continue.
Second, rising average hours might explain a lot of the too-rapid rise in unemployment in 2009 and 2010.
Lastly, given this large rise in hours, an aggressive program to promote work-sharing instituted during the recession could have been a big help in not allowing rising hours to soak up so much of the extra labor demand, and would’ve allowed the economic activity spurred by the American Recovery and Reinvestment Act to translate more directly into higher head counts and lower unemployment. The Center for Economic and Policy Research’s Dean Baker had a good real-time proposal that would have been a real help. It’s not totally too late either – work-sharing pilot programs were included in the recent extension of payroll tax cuts.
Apple’s employees in China don’t work 70 hours a week because they want to
The most annoying responses to the revelations about Apple’s inhumane and exploitative factory pay and working conditions in China are the variations on the theme that the Chinese workers are grateful (or ought to be) to have the work and even the grueling overtime hours. “Sure, it looks like exploitation to Westerners, but really, Apple is lifting their living standards.” No. Apple is exploiting these young Chinese workers, grinding them down, forcing them to work for pay so low they can’t survive on it without working far beyond anything fair or reasonable – or even legal under Chinese labor law. And the workers don’t have a choice; they either work the overtime or they’re fired.
The Fair Labor Association, Apple’s hand-picked auditor, found that Apple’s most important supplier, Foxconn, works employees far beyond the hours permitted by Apple’s code of conduct (a maximum of 60 hours per week), let alone Chinese law, which limits work hours to 49 per week. The FLA reports that “in November and December 2011, 34% and 46% of the workforce respectively worked up to 70 hours per week.” Students and Scholars Against Corporate Misbehaviour (SACOM), a Hong Kong-based labor rights organization, has documented Foxconn employees working 140 hours of overtime a month.
Keith Bradsher’s recent “news analysis” in the New York Times, “Two Sides to Labor in China,” blamed the workers for these sweatshop hours and tried to portray them in a positive light. Bradsher wrote: “But one reason that workweeks of 60 hours or more have been possible at factories run by Foxconn and others is that at least some laborers already on the payroll have wanted the extra hours.”
Bradsher believes the employees have a choice about working 60-70 hours a week. He writes that “the added expense of hiring additional workers can make it cheaper to ask employees for extra overtime…” Ask? When Foxconn employees were throwing themselves out of dormitory windows, committing suicide in reaction to the harsh conditions at Foxconn, the company reduced work hours to 60 a week, but it didn’t give workers a choice about working them. As an Oct. 2010 SACOM report revealed, “Despite fatigue, workers cannot reject overtime work, because Foxconn requires workers to sign a Voluntary Overtime Pledge.”
Bradsher cites the FLA’s survey of Foxconn employees, 34 percent of whom reported they “actually wanted even more hours.” How can workers want more than 60 hours a week? Bradsher says they’re young and bored, have nothing better to do, “and were eager to make as much money as possible so as to return to their home villages.” He never suggests that their pay is so low they can’t survive working the legal maximum number of hours. But that is exactly what SACOM found in 2010 when it compared the cost of living in Foxconn’s factory cities with Foxconn’s pay. Without overtime, the average Foxconn production employee earned about 60 percent of what was required to meet basic needs. Today, after wage increases that have been offset by higher food prices and what Bradsher admits are “soaring rents,” 72 percent of Foxconn employees at Chengdu told the FLA their salaries did not cover basic needs.
So when Apple apologists tell you that “the Chinese are different, they want to work long hours,” don’t buy it. The richest corporation in the world is grinding its workers to the bone because it can get away with it, not because the workers want to live that way.
What to do about the eurozone?
Is the eurozone in recession? Eight consecutive months of rising unemployment indicate that the region could indeed be facing another economic downturn.
According to Eurostat, the European Union’s version of the Bureau of Labor Statistics, the unemployment rate in the 17 countries that use the euro climbed to 10.8 percent in February, its highest level since the currency’s introduction in 1999. Seven eurozone countries have unemployment rates of more than 10 percent; in comparison, the United States’ unemployment rate is 8.3 percent. Past historical periods have also seen lower unemployment rates in the United States than in most of Europe, but the difference over the last couple of years is that joblessness in the eurozone is obvious collateral damage stemming from the embrace of fiscal and monetary austerity.
“Europe’s leaders just haven’t been nearly as committed [as U.S. leaders] to boosting demand with expansionary macroeconomic policies, either fiscal or monetary,” says EPI macroeconomist Josh Bivens.
“To be clear, the United States hasn’t provided adequate support to its economy and job market—but Europe has been even worse,” he continued.
In Spain, nearly a quarter of the labor force is unemployed, including more than half of workers under age 25. Spain’s plan to combat its troubles? A $36 billion austerity package passed by its new conservative government. As EPI has argued before, austerity measures are inappropriate solutions to unemployment crises. This is clearly the case in Greece, Ireland, and Portugal, all of which had to enact austerity measures as a condition of receiving bailouts. In these countries, austerity has compounded economic troubles and failed to improve staggeringly high unemployment rates.

The aftermath of clashes between protesters and police in Barcelona on March 29 by workers participating in a general strike against the Spanish government's economic reforms. (From Flickr Creative Commons by Sergio Uceda)
So how can the eurozone avert another crisis? Bivens thinks there are two separate questions that need to be answered. First, how are countries like Greece (and if we’re unlucky, Ireland, Italy, Portugal, and Spain) going to pay their debts (and how much of their debts will be written off by creditors)? Second, how are these same countries going to see growth in the next decade sufficient to ward off disastrous unemployment levels?
Bivens believes the second question gets much less attention—but is far more important.
“A key barrier to a country like Greece achieving growth in the coming decade is the lack of an independent monetary and exchange-rate policy,” says Bivens. “Greece absolutely needs to gain competitiveness in global markets as part of its medium-term macroeconomic strategy.”
He continued, “There are two paths there, exchange-rate adjustment or ‘internal devaluation’ [i.e., having Greek wages and salaries grow painfully slow for years]. The latter course is much more damaging; just look at Latvia, which fully embraced that strategy. The real lesson of the euro crisis is that all the tools of macroeconomic management need to be taken much more seriously than they have been.”
Nothing screams fiscal charlatan like a $4.5 trillion tax cut financed by gimmicks
Note: Since this blog post was first published, the Tax Policy Center has updated its revenue scoring of the tax provisions in the Ryan budget. Numbers and figures have been revised to reflect the more recent score.
House Budget Committee Chairman Paul Ryan’s (R-Wis.) budget, which passed the House of Representatives on a party-line vote last week, continues to receive deserved criticism for its thoroughly dishonest treatment of the sweeping tax cuts it proposes. In a scathing critique, Paul Krugman honed in on its “fraudulent” nature: “The Ryan budget purports to reduce the deficit — but the alleged deficit reduction depends on the completely unsupported assertion that trillions of dollars in revenue can be found by closing tax loopholes.” William Gale of the Brookings Institution similarly concluded that “Ryan is gaming the system in creating budget estimates. … This is smoke and mirrors.
The contours of the Ryan budget’s tax cuts, as scored by the nonpartisan Tax Policy Center (TPC), are as follows:
Tax cuts:
- Cut and consolidate individual income tax rates to 25 percent and 10 percent brackets: $2.5 trillion
- Repeal the alternative minimum tax (AMT): $670 billion
- Repeal the surcharges included in the Affordable Care Act: $351 billion
- Cut the corporate rate to 25 percent and end taxation of multinationals’ foreign income: $1.1 trillion
Offsets:
- Allow Recovery Act expansion of refundable tax credits to expire: $210
- ???
= $4.5 trillion in revenue loss
Ryan’s budget blueprint describes these offsets this way: “Broaden the tax base to maintain revenue growth at a level consistent with current tax policy and at a share of the economy consistent with historical norms of 18 to 19 percent in the following decades.” And the budget totals in the Ryan budget reflect revenue averaging 18.3 percent of GDP over FY2013-22; similarly, the Congressional Budget Office’s long-term analysis of Ryan’s budget is predicated on the false assumption—provided by Ryan’s staff—that revenue will somehow total 19 percent of GDP over the long run (FY2025 and beyond).
This is simply dishonest. TPC’s analysis of the Ryan budget shows revenue averaging only 15.5 percent of GDP over FY2013-22, short of unspecified offsets.1 Yet Ryan wanted nearly $5 trillion in tax cuts and wanted revenue levels above 18 percent of GDP. Honest budgeting would force Ryan to choose between these two preferences (trade-offs being the whole point of budgeting). So Ryan chose dishonest budgeting, instead of changing the policy, he just changed the numbers.
We do know one thing about Ryan’s magic asterisk: it wouldn’t come anywhere close to raising revenue equivalent to roughly 3 percentage points of GDP over the decade (or roughly $6 trillion). For starters, he’s ruled out eliminating the preferential tax treatment of capital gains—the tax loophole most skewed toward the very top of the income distribution and estimated to cost $533 billion over the next decade, according to Citizens for Tax Justice. Furthermore, a new analysis by Jane Gravelle and Thomas Hungerford of the Congressional Research Service concluded that, “given the barriers to eliminating or reducing most tax expenditures, it may prove difficult to gain more than $100 billion to $150 billion in additional tax revenues through base broadening.” Adjusting for this range of feasible base broadening, the Ryan tax cuts would still require somewhere between $2.6 trillion and $3.2 trillion of deficit-financed tax cuts.2 Look at what happens to Ryan’s fiscal trajectory based on three alternative scenarios adjusting for: 1) no base broadening; 2) the low-end of feasible base broadening; and 3) the high-end of feasible base broadening.3

By 2022, public debt under the Ryan budget would be between $3.0 trillion (+19.6 percent) and $5.3 trillion (+34.2 percent) higher without the magic asterisk—a significant margin of dishonesty. This is not meant to breed fiscal alarmism or validate Ryan’s purported debt target; big budget deficits are inevitable in the aftermath of the Great Recession and premature fiscal retrenchment would jeopardize economic recovery. This is merely to prove that Ryan’s entire claim to fiscal responsibility rests on his tax gimmick.
With these tax cuts blowing the lid off of Ryan’s deficit reduction, his proposed evisceration of Medicaid, the social safety net, and public investments is exposed for what it really is: An attempt to gut the federal government and refund the tax bill to the highest-income households, not reduce the deficit. Some $5.3 trillion in non-defense spending cuts—nearly two-thirds of which come from programs for lower-income households—would roughly finance the $5.4 trillion cost of maintaining the Bush-era tax cuts, reduced estate and gift taxes, and the AMT patch. Ryan’s additional $4.5 trillion in tax cuts—two-thirds of which would go to households earning over $200,000—would be financed with a combination of increasing deficits and reducing tax expenditures other than preferential rates on unearned income, thereby shifting the distribution of the tax burden toward the middle class. Nothing screams fiscal charlatan like trillions of dollars worth of tax cuts skewed toward the affluent but financed by gimmicks and abdication of longstanding commitments to seniors, children, and the disabled.
1. TPC’s analysis is based on CBO’s Jan. 2012 baseline, whereas the Ryan budget is modeled from the March 2012 baseline. Adjusting TPC’s estimate of the Ryan plan for legislative and technical changes since the January baseline, the Ryan plan would see revenue average 15.6 percent of GDP over FY2013-22.
2. The $100 billion low-end and $150 billion high-end for base broadening are both set in FY2013 and held constant as a share of GDP thereafter.
3. The baseline for revenue comes from table S-1 of the Path for Prosperity (rather than TPC’s lower revenue baseline) and has been adjusted for lines 2-6 of TPC’s revenue estimate of the Ryan budget (T12-0123). Baseline outlays and debt held by the public are also taken from S-1, and debt service has been revised accordingly.
Fair Labor Association report leaves big questions about change at Apple/Foxconn
The Fair Labor Association (FLA), Apple’s auditor for its labor rights problems in China, issued a report last week that received widespread praise, including in the New York Times, whose reporting about workplace deaths, employee suicides and grueling overtime forced Apple to conduct the audit in the first place. This is not the first time Apple has commissioned such an audit, and it’s not the first time the auditor found serious problems.
In 2006, after British newspapers wrote about labor standards violations at Apple’s suppliers, Apple said an audit of a Foxconn facility revealed that more than a third of its employees worked more than the 60 hours-per-week limit imposed by Apple’s code of conduct. According to CorpWatch, Apple admitted that about 25 percent of the time, employees worked more than six days straight without a day off.
Apple vowed to clean up the violations it found and hired an outside consultant, Verite, to conduct ongoing audits of all of the factories where Apple’s products are assembled.
Fast forward to 2012, and Apple is once again telling the public it intends to improve, in precisely the same areas. But why should anyone think Apple’s commitment is any greater today than it was in 2006? Two important signs make me skeptical.
The first sign of trouble is the fact that the FLA’s “Remediation Plan” focuses exclusively on Foxconn and its scheduling, compensation, health and safety and industrial relations practices. Nothing in the plan makes Apple responsible for changing Apple’s own key behavior, the price it pays for Foxconn’s production. If Apple’s pricing is so tight that Foxconn can’t meet its profit targets without exploiting its employees, who’s responsible for their exploitation? If, as Apple claims, it truly wants to reduce the overtime hours Foxconn’s employees work to legal norms, without reducing the pay the workers receive, Apple can make that happen by paying more for each unit of production – enabling Foxconn to pay more more for each hour worked. But Apple hasn’t pledged that and the FLA doesn’t even mention the economics of Apple’s contracts with Foxconn. Apple’s public attitude is akin to saying: “We’re as pure as the driven snow, and our only taint comes from Foxconn’s sins.” But Apple has tolerated or compelled these practices for six years.
The second sign of trouble is that Apple and Foxconn have agreed to keep violating the law for the next 15 months, with the FLA’s blessing. Chinese labor law limits overtime per month to 36 hours, yet Apple and Foxconn have agreed to wait until July 1, 2013 to live within the law (page 12 in FLA’s report). As outrageous as this is, it seems to have gone unnoticed in all of the reporting on the FLA report. Perhaps the companies are right to think that Chinese law is a joke that can be ignored. But why doesn’t the FLA require the companies to comply with the law today, rather than next year? The FLA hours of work standard permits employees to work 60 hours per week — 80 hours of overtime a month, 44 hours longer than the law permits. How is this different or more acceptable than a standard that permits paying 25 percent less than the legal minimum wage?
Finally, I recommend that any of Apple’s customers who care about the well-being of the people who make their iPads take a few minutes to read the FLA report before taking comfort in Apple’s new commitment to decent labor standards. Almost three-quarters of Foxconn’s workers in Chengdu “said their salaries did not cover their basic needs (report page 9).” It’s no wonder so many are willing to work 80 hours a week; they can’t afford not to. Yet the FLA does not call on Apple and Foxconn to raise wages. Rather, “Given the concerns expressed by workers about whether wages cover their basic needs, the FLA recommends a follow-up study to document spending patterns and the actual costs of the components of a basic needs wage (report page 12).”
Now that’s a tough audit!
Who’s guarding Apple’s Foxconn chicken coop?
Last week, the Fair Labor Association released a report on its “independent investigation” of Apple supplier Foxconn, which employs 1.2 million workers and is China’s largest private employer and single exporter. I discussed the FLA report, and labor rights in the U.S. and China, trade, jobs and currency with C. Fred Bergsten, Director of the Peterson Institute for International Economics, and Judy Gearhart, Executive Director of the International Labor Rights Forum, on NPR’s Diane Rehm Show this morning.
There are serious questions about the “independence” of the FLA report, which was commissioned by Apple to conduct the investigation; Apple is a major contributor to FLA’s activities. Furthermore, although the report raised important issues such as excessive and unpaid overtime and health and safety concerns, it failed to address others, such as Foxconn’s harsh management practices and public humiliation of employees (well documented by groups such as the Hong Kong based Students and Scholars Against Corporate Misbehavior), Foxconn’s systematic abuse of forced interns, and China’s refusal to permit free, fair and independent trade union elections (although the report does acknowledge that company officials dominate local unions in Foxconn plants and it calls for open, democratic elections of union officials, it fails to address the fact that all unions in China must belong to the All China Confederation of Trade Unions, which is controlled by the government). Without the protections afforded by free, independent trade unions, it is unlikely that Apple or Foxconn will ever make good on the promised improvements in wages and working conditions in these factories.
Problems with excessive overtime, widespread safety problems and the absence of worker safety and health programs have been well known at Foxconn since 2006. Apple publicly promised at that time that it would correct these problems. The new FLA reports promise that excessive overtime will be eliminated by July 2013, 15 months from now. Apple could end this problem in a matter of weeks, not months or years, simply by raising the prices it pays for Foxconn’s products and then directing Foxconn to raise wages and hire more workers. The solutions are obvious. Engrained behaviors, however, are hard to change.
–The author thanks Ross Eisenbrey and Scott Nova for helpful comments.
One million workers stand to benefit from NY’s proposed minimum wage hike
A report released today by New York State Sen. Jeff Klein discusses the economic benefits of raising the New York state minimum wage to $8.50 per hour, and indexing it to inflation thereafter. This would put New York in line with 19 other states with minimum wages above the federal minimum, and 10 other states that have some form of minimum-wage indexing.
As we have done for other proposals to raise state minimum wages, we calculated the number of people who would be affected by the New York State proposal, and the increase in economic activity that would result from this pay raise for low-wage workers. The table below outlines the results.
Roughly 609,000 minimum-wage workers in New York would directly get a raise, while another 473,000 who currently have wages just above the proposed new minimum would also see a wage increase due to “spillover” effects as employers adjust overall pay structures to reflect the new minimum. On average, affected workers in New York would receive an additional $880 over the course of a year.
That may not seem like a lot, but it translates into an estimated $600 million in additional economic activity, and that increased economic activity means more jobs. In the table, the final two rows model what we might expect in increased employment as a result of this boost to regional economic activity, after controlling for any decrease in corporate profits. New York stands to gain about 4,700 payroll jobs, or about 5,200 full-time equivalent jobs (essentially accounting for the additional hours that some currently employed workers will receive). Obviously, these job numbers will not be a silver bullet for solving any state’s employment problems, but an additional several thousand jobs—at no added cost to state budgets—certainly would help.
The country as a whole has seen flat wage growth over the past four years as high unemployment levels have put tremendous downward pressure on wages. This lagging wage growth, combined with the fact that the federal minimum wage is now only 79 percent of what it was in 1968, means that low-wage workers nationwide could desperately use an increase in the wage floor. Given that Congress is unlikely to enact proposals to raise the federal minimum anytime soon, it’s encouraging to see states like New York taking steps to help low-wage workers on their own.
Effects of proposed New York minimum wage increase
| New York: Single increase to $8.50, modeled for July 2012 | |
|---|---|
| Size of increase | $1.25 |
| Total Estimated Workers1 | 7,900,000 |
| Directly affected2 | 609,000 |
| Indirectly affected3 | 473,000 |
| Total Affected | 1,082,000 |
| Total Affected as % of Workers | 13.7% |
| Increased wages for directly & indirectly affected4 | $950,612,000 |
| Average Individual Increase in Annual Income | $880 |
| GDP Impact5 | $601,738,000 |
| Jobs Impact – Full-time employment growth6 | 5,230 |
| Jobs Impact – Payroll Jobs growth | 4,740 |

Notes: Annual Population growth: NY: 0.71%, (state projected average annual rate from 2000 to 2020, according to Census). No assumed wage growth from 2011 wage values.
1 Total estimated workers is estimated from the CPS respondents for whom either a valid hourly wage is reported or one can be imputed from weekly earnings and average weekly hours. Consequently, this estimate tends to understate the size of the full state workforce.
2 Directly Affected workers will see their wages rise as the new minimum wage rate will exceed their current hourly pay.
3 Indirectly affected workers currently have a wage rate just above the new minimum wage (between the new minimum wage and the new minimum wage plus the dollar amount of the increase in the 2012 minimum wage). They will receive a raise as employer pay scales are adjusted upward to reflect the new minimum wage.
4 Increased wages: Annual amount of increased wages for directly and indirectly affected workers, assuming they work 52 weeks a year.
5 GDP and job stimulus figures utilize a national model to estimate the GDP impact of workers' increased earnings. Thus the total state stimulus may be lower than this amount because workers in each state will not necessarily spend all of their increased earnings in-state. However, we can assume that most of the increased earnings will be spent in-state, and thus most of the jobs created will be in-state. Jobs numbers assume full-time employment requires $115,000 in additional GDP and payroll employment requires an additional $127,000 in GDP.
6 The increased economic activity from these additional wages adds not just jobs but also hours for people who already have jobs (work hours for people with jobs also dropped in the downturn). Full-time employment takes that into account, by essentially taking the number of total hours added (including both hours from new jobs and more hours for people who already have jobs) and dividing by 40, to get full-time-equivalent jobs added. Simply counting new payroll jobs misses all the added hours for people with jobs.
Job impact estimation methods can be found in: Bivens, Josh L. 2011. Method memo on estimating the jobs impact of various policy changes. Washington, D.C.: Economic Policy Institute.
Source: EPI Analysis of 2011 Current Population Survey, Outgoing Rotation Group
Infrastructure is win-win-win-win
Yesterday, I participated in a National Journal panel discussing budget issues with Steve Bell from the Bipartisan Policy Center and Laura Peterson from Taxpayers for Common Sense. One of the exchanges got to the topic of tradeoffs, with Bell arguing that, “if you take a look at the American public, they want what they want and they don’t want to pay for it.” [1:33:00 in the video below]
My response, which I’d like to flesh out a bit more here, is that just because budgeting is all about tradeoffs doesn’t mean that win-win policies aren’t out there. One notable example is infrastructure investment, which both creates jobs in the short run and raises long-run economic growth. In fact, the situation today is especially ripe for infrastructure for a number of reasons:
Low financing costs: The cost of borrowing is at historically-low levels, with interest rates on five-, seven-, and 10-year inflation-protected securities (TIPS) actually negative. This means the markets are paying the government to borrow money. But this is a temporary situation—as the economy picks up again, private returns will increase and the government will be forced to offer more generous borrowing terms to remain competitive.
Great deals: As state and local governments remain stuck in fiscal straitjackets, private commercial construction contractors are desperate for work, and their asking prices for projects has gone down. In fact, the Department of Transportation estimates that more than 2,000 additional transportation projects were funded due to competitively low bids or projects completed under budget. In other words, we’re getting much more bang for our buck than we usually do.
Fixing infrastructure costs less than rebuilding: Neglecting our infrastructure needs only makes the cost of inevitable repair compound over time. It’s a lot cheaper to repair a bridge than to rebuild one from scratch. For every $1 spent on preventative pavement maintenance, between $4 and $10 is saved on rehabilitation.
Right now we’ve got an amazing opportunity to do something that we need to do anyway at record-low costs, we’re practically being given the money, and if we delay investments, their eventual cost will be much higher. Oh, and it will create jobs. This isn’t win-win, this is win-win-win-win.
Harkin bill would revive the American Dream
Iowa Sen. Tom Harkin, the Chairman of the Senate Committee on Health, Education, Labor and Pensions, has introduced a bill that shows the way to a better economic future for most Americans. The Rebuild America Act tackles many of the biggest problems that hold back the American economy and shut off opportunity for working families.
It’s an omnibus bill that will increase employment by making big infrastructure investments, developing renewable energy systems, addressing unfair foreign trade practices, providing assistance to state and local governments to retain police, firefighters and teachers, ending tax breaks that encourage companies to move jobs offshore, and promoting manufacturing in the United States.
It will help workers get a decent return on their education and their work by strengthening the minimum wage and overtime laws, better protecting the right to join a union and bargain collectively, enhancing retirement security, and guaranteeing paid sick leave.
It improves education by helping states improve teacher effectiveness and by investing in school modernization.
And it both reduces the federal deficit and increases tax fairness by closing loopholes that favor the rich, taxing Wall Street speculation, better balancing taxation of earned and unearned income, and instituting the Buffet Rule’s minimum 30 percent income tax on million-dollar-a-year incomes.
The bill would add millions of jobs to the economy, raise the typical family’s income and enhance its retirement security. The tax changes would shift the burden of hundreds of billions of dollars of federal taxation from working- and middle-class families to those who can afford to pay – the rich and ultra-rich.
We want to particularly applaud Sen. Harkin for his courage in swimming against the tide in two critical areas: Social Security and labor policy. The Rebuild America Act rejects the notion that Social Security is too expensive and that we can’t afford to meet the promises we made to America’s workers: That if they worked hard for a lifetime, they could retire with guaranteed benefits and inflation protection. Too many other politicians are ready, if not eager, to cut Social Security’s cost of living protection and to reduce benefits by raising the retirement age, no matter that such changes have the biggest impact on the retirement security of women and blue-collar and low-income workers, many of whom have seen little or no increase in life expectancy. By contrast, Sen. Harkin knows workers need more help, not less; that fewer and fewer workers have pensions; that 401(k) accounts are insufficient and undependable sources of retirement income; that Social Security is steadily replacing less and less of pre-retirement income; and that the Social Security COLA is not too generous, but rather too skimpy to keep up with the cost of health care inflation that drives the spending of older workers.
The Rebuild America Act therefore replaces the Social Security COLA formula with one that better accounts for cost inflation in the products and services that older workers pay for. It raises benefits across the board. And it pays for these improvements and addresses the program’s long-term revenue shortfall by “scrapping the cap” – eliminating the loophole that shelters incomes above $110,100 from Social security taxes.
In the area of labor law, the Rebuild America Act would make the most significant change in the minimum wage in our history by indexing it to inflation after raising it to a more adequate $9.80 an hour over a period of three years. The bill will also correct the gross injustice of freezing the minimum wage for tipped workers at $2.13 an hour, a problem that Congress ignored in both of the last increases it made to the minimum wage. Many states have acted on their own to address this problem, and Sen. Harkin is right to end this disgrace.
The Act will also address the continuing erosion of overtime protection, which is both the legal underpinning of the weekend and the best defense workers have against abusive schedules and worsening work-family conflicts. As long as employers have to pay 150 percent of regular pay for each hour worked beyond 40 in a week, they will be reluctant to force excessive overtime. But the Department of Labor has let the coverage of the overtime law erode steadily over the years, to the point that workers earning near-poverty salaries can be treated as exempt executives or administrators. The Rebuild America Act raises the income threshold for exemption back to historic levels and would guarantee overtime coverage for millions of workers who are unprotected today.
Congressional Progressive Caucus budget would boost employment by millions—unlike the Ryan budget
The values and policies embodied by the Budget for All, the budget of the Congressional Progressive Caucus (CPC) for fiscal year 2013, offer a stark contrast with those of the budget put forth by House Budget Committee Chairman Paul Ryan (R-Wis.). First, the Budget for All protects Medicare, Medicaid, the Affordable Care Act, and other elements of the social safety net. Second, it boosts public investments in education, infrastructure, and research and development. But the Budget for All and the Ryan budget are perhaps most diametrically opposed in their approach to economic stewardship over the weak recovery.
As my colleague Rebecca Thiess highlights, the Budget for All would finance a direct jobs program, infrastructure investments, targeted tax credits, and increased nondefense discretionary spending to ameliorate the ongoing crisis in the U.S. labor market. The Budget for All proposes increasing spending by $786 billion for job creation measures and public investments over the next two-and-a-half years (FY2012-14), relative to current law. This is critical: Expansionary fiscal policy remains the single best lever to fill the gap in aggregate demand and put Americans back to work. The Budget for All would accelerate economic recovery by increasing near-term budget deficits even while reducing longer-term deficits and sustaining primary balance over the second half of the budget window.
The Budget for All would increase mandatory and discretionary spending (excluding overseas military operations) by $259 billion in FY2013 and $261 billion in FY2014, boosting GDP by 2.3 percent and 2.2 percent, respectively, relative to current policy (the relevant baseline for aggregate demand). Net of the much smaller fiscal drag exerted by progressive tax reforms being gradually phased in, we estimate that the fiscal expansion proposed by the Budget for All would increase GDP by $280 billion (+1.8 percent) and $167 billion (+1.0 percent), respectively, in FY2013 and FY2014. By substantially boosting near-term aggregate demand, we estimate that the Budget for All would increase non-farm payroll employment by 2.1 million jobs in FY2013 and 1.2 million jobs in FY2014.
Conversely, the Ryan budget would accelerate the looming economic drag from contractionary fiscal policy with deep, aggressive spending cuts—failing the “first, do no harm” principle and sharply impeding job creation. My colleague Ethan Pollack recently estimated that the Ryan budget would reduce employment by 1.3 million jobs in FY2013 and 2.8 million jobs in 2014.*

On net, non-farm payroll employment would be roughly 3.4 million jobs higher by the end of FY2013 and 4.0 million jobs higher by the end of FY2014 if Congress adopted the Budget for All instead of the Ryan budget. To put this in perspective, the economy has gained 2.0 million jobs over the last 12 months but needs more than 10 million jobs to restore pre-recession unemployment and labor force participation rates. Going forward, the CPC budget would markedly accelerate the rate of rehiring, while the Ryan budget would drastically slow—or entirely wipe out—new hiring.
Immediately slashing government spending, as Ryan has proposed, is not a game or a joke—it’s economically irresponsible budget policy that has backfired across much of Europe and would seriously aggravate un- and underemployment. And as proven by the Budget for All, racing down the austerity path isn’t required for a fiscally responsible budget. The CPC budget would reach the same debt level as the Ryan budget without jeopardizing the economic recovery.
Fiscal responsibility demands sound economic stewardship, which means addressing the jobs crisis and closing the gap between potential output and actual GDP (the economy is currently running $883 billion—or 5.4 percent—below potential). While a large output gap persists, government spending cuts will have a particularly adverse impact on aggregate demand and fiscal sustainability will remain elusive. (Again, just look to Europe.)
The Congressional Progressive Caucus has proposed a credible budget that would prioritize jobs first and phase in deficit reduction as the economy strengthens (with emphasis on policies that will have relatively little deleterious impact on aggregate demand). Ryan has produced a budget that would choke off economic recovery in an attempt to gut government and refund the tax bill. The CPC budget is credible and economically viable; the Ryan budget is not. And literally millions of jobs hang in the balance between these two competing visions for the United States of America.
*The employment impact of the Budget for All is meant as an apples-to-apples comparison with these estimates for the Ryan budget, which were also calculated relative to current policy excluding spending on overseas military operations (which has a relatively small impact on domestic output).