U.S. sends the right message with WTO complaint on China’s illegal restrictions on rare earth exports
The Obama administration filed a complaint on Tuesday at the World Trade Organization challenging China’s restraints on its exports of rare earth minerals. This much-needed action will be good for both consumers and workers in the United States and other countries. China reacted immediately, promising to defend its actions and threatening that it could trigger further trade disputes. China’s export restraints are a clear violation of its WTO obligations, and it doesn’t have a leg to stand on in this dispute. Ending those restraints will lower prices for a wide range of high-tech products such as solar cells and hybrid and electric vehicles, and it will stimulate job creation in the United States.
The administration’s trade complaint covers tungsten and molybdenum (minerals used in steel production) in addition to rare earths, and includes over 100 specific products. Under the terms of its accession to the WTO, China was allowed to retain export duties at specified rates on 84 commodities. However, it maintains tariffs as well as quotas and other illegal restrictions on exports on rare earths and other metals. China controls 95 percent of the world’s production of rare earths minerals, which are critical ingredients in high-tech manufacturing of products ranging from smartphones to hybrid cars to missiles. None of the items covered in the administration’s WTO complaint are included in the list of 84 items that China is entitled to restrict with export duties.
Production of rare earths can be damaging to the environment. In 2009, China stopped issuing new licenses for rare earth mines, closed some illegal mines and set domestic production caps. If applied with equal effect to domestic and export sales, such restrictions would be legitimate under the WTO. Higher prices for rare earths will eventually encourage production in other countries that have large deposits, such as Australia, Brazil, Canada, Greenland, South Africa and the United States, but new mines will take five or more years to develop.
By restricting and taxing rare earth exports, China reduces the costs of these critical materials for their own domestic producers and raises the costs for producers in the rest of the world. Japan and the EU jointly filed the WTO case with the United States. Recent industry data show that the export price of a basket of rare earths from China was more than 120 percent higher than China’s domestic price for the same basket of minerals. Thus, China’s rare earth restrictions unfairly tilt the playing field in favor of its own domestic producers and raise the cost of high-tech products to consumers in the U.S. and other countries. Three U.S. manufacturers of photovoltaic cells, including Solyndra and Everygreen Solar, have recently declared bankruptcy in the face of cut-throat, subsidized competition from Chinese manufacturers who benefit from plentiful access to cheap rare earths.
China’s illegal policy of restricting rare earth exports is just one of many examples of its unfair trade practices. Massive subsidies to key industries such as auto parts, glass and paper are also hurting domestic industries, and currency manipulation by China and other Asian countries has cost the United States millions of jobs. We applaud strong action by the administration in these cases and look forward to continued strong enforcement of all U.S. fair trade laws by the administration’s planned Interagency Trade Enforcement Center.
–The author thanks Monique Morrissey for comments
The myth of the rich, hungry Chinese consumer
The lead article in Monday’s business section of the Washington Post on the reported “boom” in U.S. exports to China painted an inaccurate and distorted view of U.S.-China trade. Headlined by a photo of Chinese Vice President Xi Ping visiting an Iowa family farm in February, the article claimed that a “richer China” has a “growing appetite for … American soybeans, cars, airplanes and medicine.” While the article does acknowledge the soaring U.S. trade deficit with China, it claims that such exports are a “bright spot.” In fact, those exports are swamped by soaring imports and trade deficits with China, which displaced 2.8 million U.S. jobs between 2001 and 2010 alone.
Review of actual trends in U.S. exports to China paints a very different picture than the one described in the Post article. Waste and scrap were the fastest growing U.S. exports to China, increasing $3.0 billion in 2011 (25.8 percent). The growth in agricultural products ranked a distant fifth on this list, increasing $0.9 billion (6.0 percent). Of the 10 fastest growing exports to China, seven were unprocessed commodities (as indicated by the black bars), including paper products, because 61.0 percent of U.S. paper exports to China in 2011 were unprocessed wood pulp. The vast majority of such exports are used as inputs for making paper and other products for export, not for Chinese domestic consumption. Overall, although total U.S. exports to China increased $11.2 billion in 2011, imports increased by $34.4 billion and the trade deficit increased $23.3 billion. U.S. export of raw materials so that China, not the United States, can make higher value-added industrial products is an ongoing recipe for the decline of American manufacturing and for North American economic failure.
The Post cites unnamed experts who claimed that the main reason for the increased exports “is a booming China where wealthier tastes include an increased appetite for meat—and hence for soybeans used as livestock feed.” The growth in demand for grains pales in comparison to China’s voracious appetite for waste, paper and metal scrap, chemicals, minerals and ores and raw wood—commodities China turns into job-displacing exports. The rapid growth of Chinese exports to the U.S. and the world are the source of China’s growing wealth, and such wealth has not resulted in exports to China growing “exponentially” (e.g., faster and faster each year), another flawed claim from this report. Exports in 2011 increased at the third-slowest rate since China joined the World Trade Organization in 2001. Export growth was slower only in the recession years of 2008 and 2009. Sadly, our exports to China are more closely tied to China’s demand for U.S. raw materials for its own production and exports than to Chinese consumers’ appetites for our products.
This story would be a good candidate for review by the Post‘s Fact Checker. We give it three Pinocchios.

— The author thanks Ross Eisenbrey and Doug Hall for helpful comments and Hilary Wething for research assistance.
Charles Murray’s failure by design
It is not at all clear what problem Charles Murray is trying to solve in his New York Times piece Narrowing the New Class Divide. But it can’t possibly be the economic inequality that has been growing for the last 30 years. While it is important to equalize the opportunity to internships, no one serious about addressing economic inequality would put this as one of their top four policy recommendations. The same can be said about Murray’s other three ideas.
My colleague, Josh Bivens, presents real policies to address America’s economic inequality in his book Failure by Design. Any one of Biven’s policies listed below would have a larger impact on reducing inequality than all four of Murray’s “solutions.”
- A higher and indexed minimum wage
- Strengthening workers’ right to organize
- Guaranteed retirement and health security
- A national and more democratic response to globalization
- Restricting the excesses of the financial sector
- Managing international capital flows
- Investments in infrastructure, including educational infrastructure
- A national commitment to achieving full employment
- A national commitment to addressing racial inequality
These are the proposals of someone seriously concerned about economic inequality. Murray, on the other hand, selects policies which he admits at the outset “would not do much good.”
Murray’s last book, The Bell Curve, argued that nothing could be done about inequality because it was all genetic. That argument did not go over too well. He has repackaged his thesis, but he is still arguing that nothing can be done to address inequality. But we know better.
High-scoring, low-income students no more likely to complete college than low-scoring, rich students
In the New York Times on March 7, Charles Murray offers some solutions to the class divide, then dismisses them nearly as quickly as he mentions them on the grounds that they wouldn’t actually work or aren’t necessary. Whether his facts on the class divide are accurate is not the subject of this post, but rather a closer look at a couple of his “solutions.”
Murray makes some decent points about the problems with unpaid internships and the benefits they may afford only those who come from families wealthy enough to allow such experiences. Aside from offering children of well-off parents the ability to pad their resume with unpaid internships , my colleague Ross Eisenbrey argues further that illegal unpaid internships are a scourge on the labor market. Murray rightly states that, “Internships that pay the minimum wage are still much more feasible for affluent students than for students paying their own way through college.”
The part of his article that I take issue with are his arguments about access to higher education. Murray suggests replacing ethnic affirmative action with socioeconomic affirmative action (an argument for another day), then later dismisses it as unnecessary, because “a high proportion of academically gifted children from the working class already get scholarships to good schools.” Let’s take a look at the evidence.
The relevant issue is the quality of education accessible to children from families in different positions in the income scale. The figure below compares the family income of children in the entering classes at top-tier universities. Nearly three-quarters of those in the top-tier universities come from families with the highest incomes, while 3 percent and 6 percent of the entering class come from the lowest and second lowest income groups, respectively – or, the bottom 50 percent of families.

Still, Murray might argue that those findings represent meritocracy at work, as those from high-income families have, perhaps through their privileged positions, acquired the intellectual tools to succeed at top schools. The second figure belies this argument. This figure shows that even after controlling for academic ability, higher income children are still more likely to complete college. Each set of bars shows the probability of completing college for children based on income and their math test scores in eighth grade. For example, the first set of bars (for the students with the lowest test scores) shows that 3 percent of students with both low scores and low incomes completed college, while 30 percent of low-scoring children from high-income families managed to complete college.
The fact that college completion is higher for each successive income group among similar scoring students is evidence against a completely meritocratic system. The pattern implies that at every level of test scores, higher income led to higher completion rates. The key comparison in this figure is the fact that high-scoring students from low-income families complete college at nearly the same rate as low-scoring, high-income students (29 percent vs. 30 percent). In other words, high-scoring, low-income children are no more likely to complete college than low-scoring, rich children.

In no way do these data suggest that a high proportion of children (gifted or not) from low-income families achieve placement or completion at universities (and definitely not top schools).
Are Liberal Arts majors dragging college grads down?
James Pethokoukis responds to the Wall Street Journal coverage of my analysis of entry-level wages of recent college graduates by implying that the erosion of wages earned by new college graduates is because there are too many Liberal Arts majors. Here’s the chart the Journal published:

The remarkable thing about recent college graduates is that the wages they earn early in their careers fell over the prior business cycle, 2000-07, as well as in the recession. This is the case for both men and women. As usual with Pethokoukis, he does not really supply any data directly on point. Instead, he lists a number of random items about college enrollment and STEM (science, technology, engineering and math) degrees as reported by Alex Tabarrok in a recent Chronicle of Higher Education story. In the piece, Tabarrok asks, “If students aren’t studying science, technology, engineering, and math, what are they studying?”
Since Pethokoukis doesn’t supply it, here are data on the distribution of fields of study by young college graduates, ages 18-29, in 2001 and 2009 from the Census’ Survey of Income and Program Participation (SIPP):
| Degree field | 2001 | 2009 |
| Business | 17.9% | 19.6% |
| Engineering | 6.2% | 5.9% |
| Education | 9.5% | 8.8% |
| Math/Science/Computer/Architecture | 20.1% | 19.7% |
| Liberal Arts/Social Science/Philosophy | 12.4% | 11.4% |
| Literature/Communications/Language | 8.5% | 8.3% |
| Other | 17.9% | 19.7% |
| Misc* | 7.6% | 6.6% |
| Source: Analysis of Census SIPP data for 2001 and 2009 | ||
| *Population where highest degree is a bachelor’s degree | ||
There’s been no big change in the distribution of fields between 2001 and 2009 that could have led to the fall in wages of recent college graduates relative to those in entry-level jobs in 2001. There are somewhat fewer STEM graduates in 2009. However, wages should have been lifted by the expansion of business majors. To see how all of the changes in composition might have affected wages, I did a shift-share analysis of the field distribution in 2001 and 2009, asking, ‘How has the change in the composition of fields affected the average wage?’ If the 2009 composition (across 18 different majors) of employment across fields prevailed in 2001 at the wages of each field in 2001, then the average wage would have been … drum roll … 0.1 percent higher. That is, the impact of changes in the composition of fields over the 2001 to 2009 period was ABSOLUTELY NOTHING. The drop in entry-level wages happened within the particular fields of study, not because of the fields that students studied.
Are Liberal Arts majors dragging everyone down? The SIPP tabulations provided by Census do not have wage data by field for young workers but they do for all workers. The monthly earnings of full-time workers (using Table 4C in 2001 and 2009) with a Liberal Arts degree grew 19.8 percent in inflation-adjusted terms from 2001 to 2009. I suspect that Liberal Arts majors aren’t sabotaging America’s wages.
Oddly enough, I sort of agree with Pethokoukis’ bottom line. He says:
“And rather than pushing students to attend a four-year, brick-and-mortar college in pursuit of the BA, how about business-backed training and apprenticeship programs leading to a high-skill technical degree just like in Germany and some other northern European nations? … More education for all. But not college for all.”
As I wrote in the New York Times’ Room for Debate last week, College Is Not Always the Answer. My bottom line: “We need a nation that has and values all sorts of work and skills, which means providing decent pay and benefits for many types of jobs.”
A jobs bill in substance or acronym only?
Earlier today, the House of Representatives passed the Jumpstart Our Business Startups (JOBS) Act in overwhelming bipartisan fashion (390-23). The JOBS Act is a package of six bills, four of which had already passed the House, and all of which would lift or relax Securities and Exchange Commission rules. The bill is intended to make it easier for small businesses to go public. But as the Washington Post’s Ed O’Keefe notes, “despite its name, Republican leaders couldn’t say how many jobs the bill would help create.” Why? Because cutting red tape doesn’t address the fundamental plight of the U.S. economy: a deep and prolonged aggregate demand slump.
As of Jan. 2012, the U.S. economy had fewer jobs than in Jan. 2001. More than 11 million jobs would be needed to return the unemployment rate to its pre-recession level (5.0 percent). Full employment would not be reached until 2019 if January’s pace of hiring (243,000 jobs added) continues. And the February employment report—due out tomorrow—is projected to show a deceleration in hiring. As of the fourth quarter of 2011, actual economic output fell $883 billion (5.4 percent) below potential economic output. Mass underemployment and a gargantuan output gap can’t be chalked up to red tape—this affliction is the byproduct of the housing market imploding (dragging down with it personal consumption and real estate investment) and fiscal contraction at the state and local level.
Before the administration rolled out the American Jobs Act—which would have substantively accelerated economic recovery—EPI President Larry Mishel spelled out four criteria for evaluating jobs plans:
- Will the policy make a real difference in job creation in the next 24 months?
- Is the policy effective and efficient?
- How is the policy funded?
- Is the policy at the appropriate scale to produce a substantial number of jobs?
How does the JOBS Act stack up? Well, it won’t make a real difference in near-term hiring. There’s no cost, bang-per-buck, or funding mechanism to be evaluated, period. And rather than being of the wrong scale to produce a substantial number of jobs, the policy is on the wrong scale altogether (the supply side rather than the demand side).
In a divided Congress, bipartisanship is certainly necessary to meaningfully address the jobs crisis at hand, but bipartisan support is hardly a sufficient condition. Restoring full employment requires much more than titling an uncontroversial bill so its acronym spells ‘jobs’ – substantive job creation legislation must noticeably lower the unemployment rate. Unfortunately, the JOBS Act misses that mark altogether.
Mankiw swings and misses in defense of Romney’s carried interest
A couple days ago, Harvard economist Gregory Mankiw tried his best to defend the carried interest tax loophole by blowing smoke at the debate and hoping no one would notice. The carried interest loophole allows hedge fund and private equity managers to reclassify their compensation for management services—a hefty slice of the return on their investors’ capital—as capital gains, which are taxed at a preferential 15 percent rate instead of the top marginal income tax rate of 35 percent. Mankiw is an economic adviser to former Massachusetts Gov. Mitt Romney, who inadvertently thrust the carried interest loophole into the spotlight with his 13.9 percent effective tax rate. But no amount of smoke or sand can cover up Romney’s tax return or a tax code that throws fairness out the window for the millionaires and billionaires in high finance.
Rather than defending carried interest outright, Mankiw muddies the water by leading readers through five examples of varying business arrangements and their respective tax treatment, attempting to illustrate that the line between labor and capital income is often blurred. Fair point. The tax code is complicated and similar modes of economic activity are often taxed differently, violating the principle of horizontal equity. Indeed, the tax code grossly violates the principle of horizontal equity when compensation is reclassified as investment income, as the carried interest loophole allows. Inadvertently, Mankiw is making a strong case for again equalizing the tax treatment of income derived from wealth and income derived from labor (as was done under the Tax Reform Act of 1986). After all, why should the tax code incentivize one compensation arrangement over another?
And Mankiw brushes off the second half of the fairness question: The carried interest loophole and the preferential treatment of capital gains it confers also violate the principle of vertical equity (the basic tenet of a progressive tax code that effective tax rates should rise with income). Instead, he compares Romney to a carpenter specializing in business fixer-uppers, implying that this tax question is about fairness to the middle class. But this is about someone with a net worth between $190 million and $250 million paying less than 15 percent on $21.7 million in income and the principle of vertical equity being undermined where it is most needed (where the money is).
This flaw in the tax code spans well beyond the presidential campaign trail: Private equity firm The Carlyle Group recently disclosed that its three founders each received in 2011 a $275,000 salary, a $3.5 million bonus, and roughly a $134 million share of investment profits, much of which is carried interest. Additional returns on their personal investments in Carlyle ranged from $57 million to $78 million. With so much income taxed at a 15 percent rate, it’s hard to imagine their effective tax rates landing in a different ballpark than that of Romney. The carried interest loophole helps the wizards of high finance to undermine the basic principles of fairness in the tax code. And unless repealed, this Wall Street subsidy will cost taxpayers $13 billion to $24 billion over a decade (the range of estimates in President Obama’s four budget requests, all of which have proposed repealing the carried interest loophole to no avail).
As Alec MacGillis notes, Mankiw’s half-hearted defense of the carried interest loophole is odd because he had previously concluded that, “Deferred compensation, even risky compensation, is still compensation, and it should be taxed as such.” But that was before he became an economic adviser to Romney. One of Mankiw’s famous “10 Principles of Economics” is that people respond to incentives, as he’s aptly proving.
The carried interest tax loophole is simply indefensible, as demonstrated by Mankiw’s fickle muddy-the-water defense. There are certainly gray areas in the tax code, but no amount of smoke can shroud this particular loophole as anything but an egregious subsidy to high finance.
Montana judge’s actions provide an opportunity to confront the origins of America’s racial divide
John Conyers, ranking Democratic member of the House Judiciary Committee, has called for hearings that could lead to the impeachment of chief federal district Judge Richard Cebull of Montana. Common Cause president Bob Edgar called for Cebull’s resignation last week. A New York Times editorial has now weighed in with a similar call. Cebull acknowledges having sent an email to friends with a racist “joke” about President Obama, suggesting that the president could well have been born from the union of a drunken white woman and a dog.
Whatever the future holds for the judge himself, the best broader outcome from these events would be congressional hearings or other national discussion about the country’s historic and ongoing racial segregation. Unless we can come to a national understanding of the public policies that have produced a segregated society, there is little chance of developing consensus around policies to address it.
Montana’s experience is on point. At a time when, as we have recently reported, racial segregation persists, and may even be intensifying, such discussion is urgently needed. It is unlikely that the country can address the twin and mutually reinforcing crises of economic and racial inequality if it fails to examine how we arrived at this juncture.
Few blacks now interact with Judge Cebull and his circle in Helena, Mont., or in the state as a whole. This is not because blacks never settled in Montana but because, early in the 20th century, African Americans in Montana and its neighboring states were forcibly removed by the formal and informal actions of public officials and an organized white community.
In Helena, Montana’s capital where Judge Cebull now holds court, there was a black literary society founded in 1906 that heard presentations by local black poets, playwrights, and essayists. The society’s weekly attendance of 100 was about as large as the entire black population of Helena today.
In that same year, Helena’s chief county prosecutor told a jury, “It is time that the respectable white people of this community rise in their might and assert their rights.” Such incitement was successful in Helena, elsewhere in Montana, and throughout the nation during the first few decades of the 20th century.
As blacks were driven from towns in Montana and elsewhere, a series of federal, state, and local policies reinforced their concentration in urban ghettos. The public has largely forgotten this history of segregation that has bequeathed us, in the words of a 1968 presidential commission, “two societies, one black, one white—separate and unequal.” Unless we can come to a national understanding of the public policies that have produced a segregated society, there is little chance of developing consensus around policies to address it.
Read more on this issue in my commentary published earlier today.
Cuts to state and local governments are particularly hard on women
Paul Krugman and Jared Bernstein have written recently of the seemingly contradictory forces at work today in government policy. On the one hand are the stimulus efforts of the Obama administration and the federal government, which have had a measurable impact in reducing unemployment and aiding the recovery. On the other hand are the dramatic cuts to state and local budgets that these governments have made in the wake of the Great Recession. States have had to deal with the largest drop in state revenues ever recorded, and the resulting deficits have meant huge jobs losses among state and local workers.
I have commented on these job losses a few times before, so this time around I want to highlight the gender dynamics a bit. These cuts to state and local government workforces, while a significant drag on the economy as a whole, are particularly damaging for women. In 2011, women made up 46.6 percent of the overall labor force, but among state and local workers, about 60 percent are women. Because women are so disproportionately represented in state and local jobs, they also have taken the brunt of the job losses in state and local governments. Of the net change in total state and local employment between 2007 and 2011—a decline of roughly 765,000 jobs—70 percent of the drop is from female employees. Today, there are about 540,000 fewer women in state and local jobs than in 2007, compared with about 225,000 fewer men.
One other way to look at this is through the proportion of people from state and local jobs currently unemployed. According to the Current Population Survey, in 2011 women made up about 62 percent of those who reported that they were unemployed and that their most recent job was from the state or local government sector. This is lower than the female share of the net change in state and local jobs mentioned above, suggesting that some of the women who lost state and local jobs since the recession have either found private sector work or exited the labor force. Nevertheless, it is still larger than the overall female share of state and local employees.
It’s worth noting that since the recession began, men have faced larger job losses than women in the private sector. But as of Jan. 2012, the overall unemployment rate for both genders is the same at 8.3 percent. In fact, when you look at the gender breakdown of the employment to population ratio—the proportion of the total population currently employed—the most recent figures show improvement only for men. The ratio for men declined from 69.8 percent in 2007 to a low of 63.3 percent in Dec. 2009. It has since risen a bit, up to 64.5 percent in Jan. 2012 (still one of the lowest percentages on record.) For women, however, the employment to population ratio in 2007 was 56.6 percent and it has fallen virtually every month since then, hitting 52.9 percent in Jan. 2012. It has not been that low since 1987.

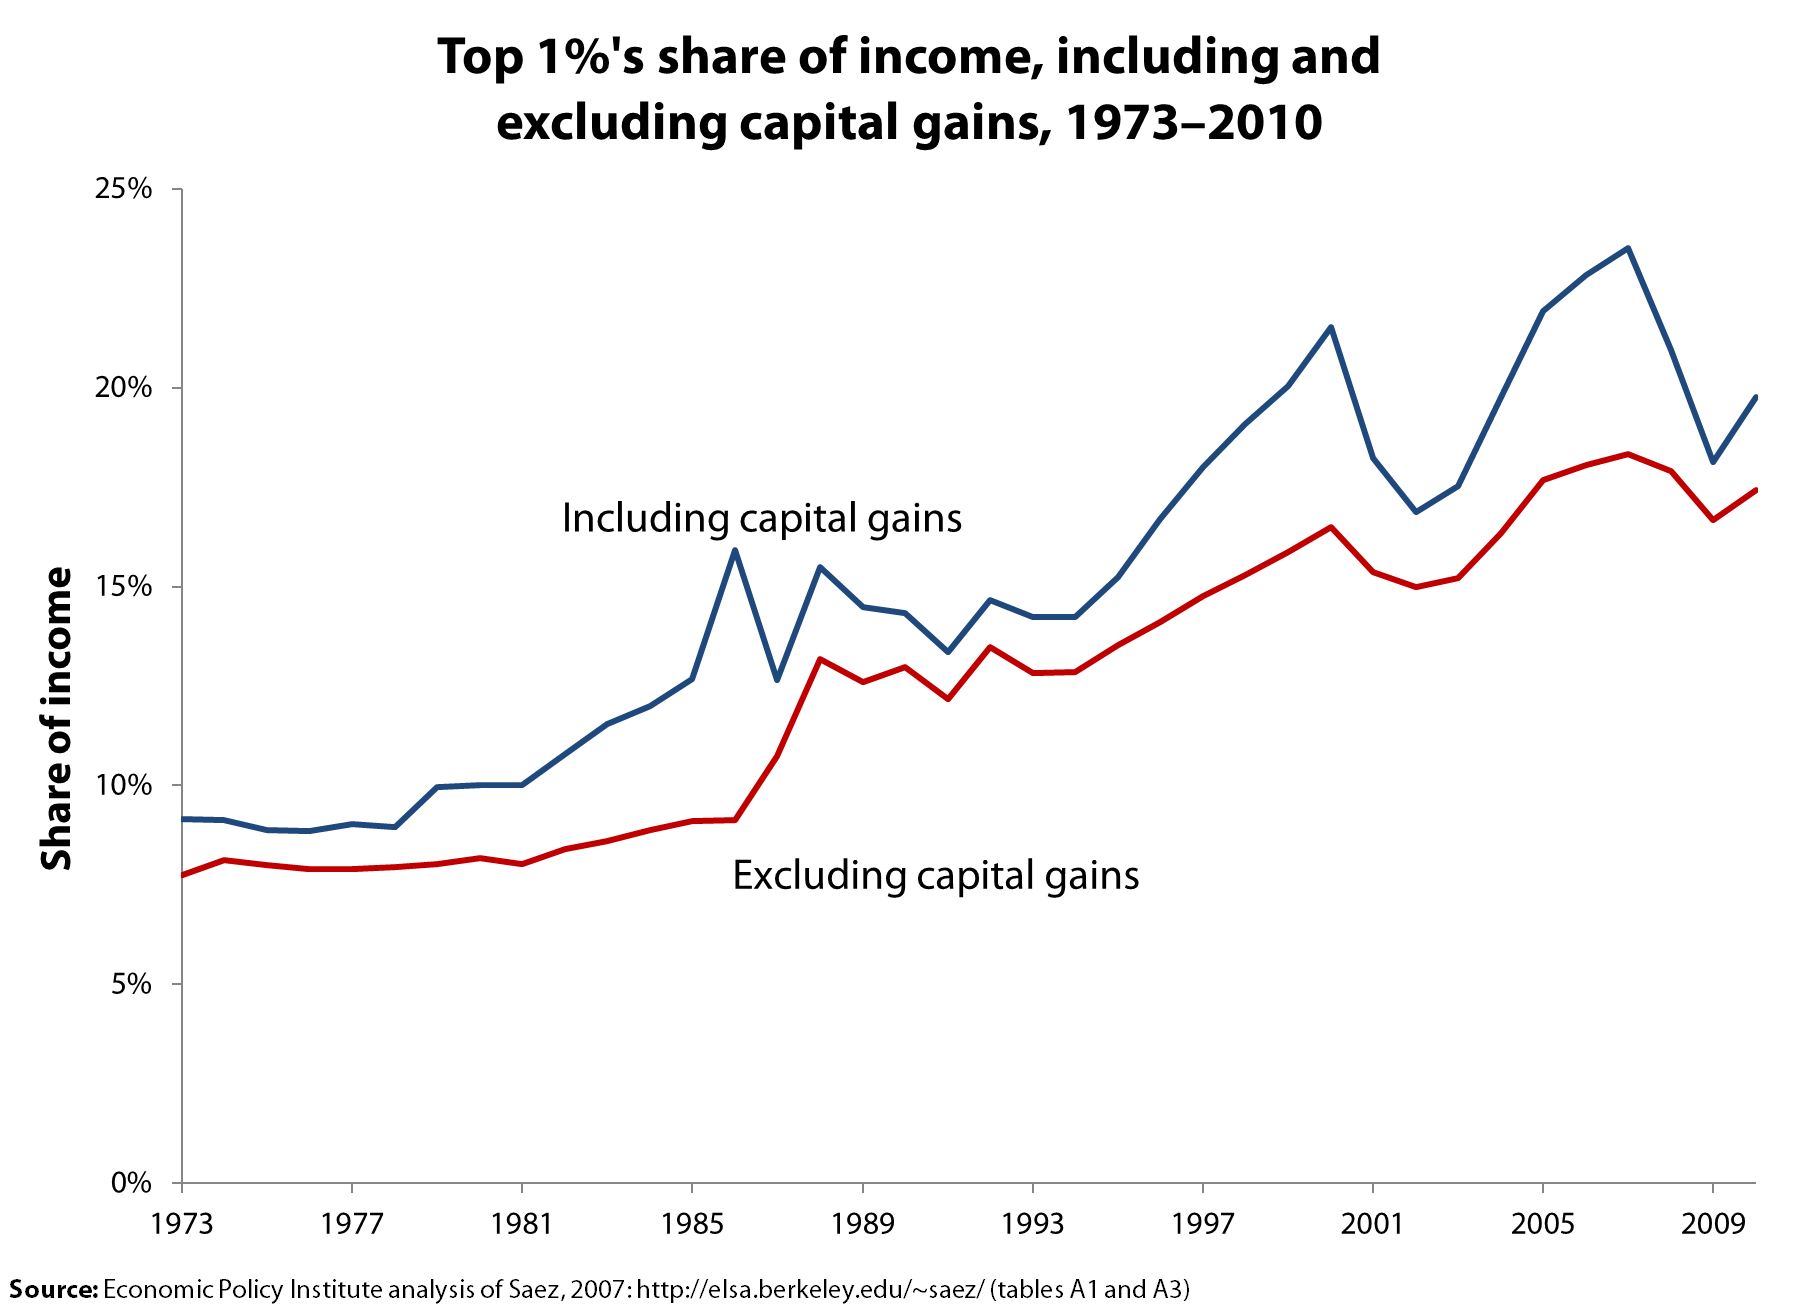
The top 1% recoups lost ground
Emmanuel Saez updated his valuable series on income trends to include 2009 and 2010 and finds, not surprisingly, that those in the top 1 percent started seeing a strong recovery in 2010 and have recouped some of the ground lost in the downturn.
I reached the same conclusion a while back based on my analysis of wage data for the top 1 percent through 2010 which showed: the recession and financial crisis crunched the wages at the top from 2007 to 2009 but the top 1 percent experienced wage gains in 2010 while the bottom 90 percent actually saw losses. (See the graph.)
The trends in capital gains is another important piece of all this. In response to the misguided claim that the financial crisis ended concerns about income inequality (“We don’t want to spend years focused on income inequality, only to learn that the financial crisis fixed it for us,” said one observer), Nicholas Finio and I showed that realized capital gains trends are volatile and correspond to the stock market. This historic pattern would have led top incomes to fall over 2007-09 and then start recovering in 2010. So, with wages of the top 1 percent recovering and the stock market growing, it makes sense that the incomes at the top fared well in 2010 as the Saez data show, regardless of whether the income measures include or exclude realized capital gains.
Paul Krugman has already commented and Mike Konczal has offered his analysis. I am going to focus on what segments of the income distribution have recovered and by how much, as the following table does, showing the income shares of the top 1 percent and the rest of the top 10 percent for the recession years and for 1979, which is a useful historic benchmark.
| Household Income Shares | |||||
|---|---|---|---|---|---|
| Top 1% | Bottom | ||||
| Year | Top 0.1% | Next 0.9% | All top 1% | 90-99 % | 0-90 |
| Income excluding capital gains | |||||
| 1979 | 2.2 | 5.9 | 8.0 | 24.3 | 67.7 |
| 2007 | 8.2 | 10.2 | 18.3 | 27.3 | 54.3 |
| 2008 | 7.8 | 10.1 | 17.9 | 28.1 | 54.0 |
| 2009 | 7.0 | 9.6 | 16.7 | 28.8 | 54.5 |
| 2010 | 7.5 | 9.9 | 17.4 | 28.8 | 53.7 |
| Change | |||||
| 2007-09 | -1.1 | -0.5 | -1.6 | 1.5 | 0.2 |
| 2009-10 | 0.5 | 0.3 | 0.7 | 0.1 | -0.8 |
| Income excluding capital gains | |||||
| 1979 | 3.4 | 6.5 | 10.0 | 24.3 | 65.8 |
| 2007 | 12.3 | 11.2 | 23.5 | 26.2 | 50.3 |
| 2008 | 10.4 | 10.5 | 20.9 | 27.3 | 51.8 |
| 2009 | 8.3 | 9.8 | 18.1 | 28.4 | 53.5 |
| 2010 | 9.5 | 10.3 | 19.8 | 28.1 | 52.1 |
| Change | |||||
| 2007-09 | -4.0 | -1.4 | -5.4 | 2.1 | 3.2 |
| 2009-10 | 1.2 | 0.4 | 1.7 | -0.3 | -1.4 |
| Source: Mishel analysis of Piketty and Saez. 2012 | |||||
The top panel shows the changes in income shares using an income measure that does not include realized capital gains. Note the income share of the top 1 percent fell 1.6 percentage points between 2007 and 2009 with the largest fall among the very top 0.1 percent. Equally interesting is that almost of the income share lost by the top 1 percent was captured by the next 9 percent, those in the 90th to 99th percentiles. That is, the great redistribution that occurred happened almost totally among the top 10 percent and did not benefit the bottom 90 percent of households. From 2009 to 2010, the top 1 percent recouped almost half the income share lost in the downturn (gaining 0.7 percentage points of the 1.6 percentage points lost) and the 90-99th percentiles gained a bit more, up 0.1 percentage points. That means, by the way, that the bottom 90 percent saw their income share fall by 0.8 percentage points from 2009 to 2010. As for inequality reversing itself, note that even at the low point following the recession, 2009, the income share of the top 1 percent was 16.7 percent, still more than double the share in 1979 of just 8.0%. Not quite a reversal.
Income losses for the top 1 percent when realized capital gains are included in the income measure (in the bottom panel) were steeper. This follows from the fact that the top 1 percent receives a huge share of all capital gains. Using this measure, the lower income shares of the top 1 percent corresponded to an increased share among both the next 9 percent and the bottom 90 percent (seen by the fact that not all of the losses of the top 1 percent were gained by the next 9 percent). With this more inclusive income measure, the top 1 percent has recouped in 2009-10 only about 30 percent of what was lost from 2007 to 2009. Even with a shrunken income share in 2009 of 18.1 percent, however, the top 1 percent still has a substantially higher income share than 1979’s 10.0 percent. Again, not quite a reversal.
The top 1 percent may not regain the extraordinary income shares obtained in 2007 or in 2000, so it may be that income inequality peaked in those earlier years. Nevertheless, we can count on a few things. One is that the top 1 percent will see its share of income expand in the current recovery. A second is that income inequality, at least as measured by the income shares at the very top, will remain very high and much greater than what prevailed at the end of the 1970s. The forces at work driving up income inequality are still in place.