The top 1% recoups lost ground
Emmanuel Saez updated his valuable series on income trends to include 2009 and 2010 and finds, not surprisingly, that those in the top 1 percent started seeing a strong recovery in 2010 and have recouped some of the ground lost in the downturn.
I reached the same conclusion a while back based on my analysis of wage data for the top 1 percent through 2010 which showed: the recession and financial crisis crunched the wages at the top from 2007 to 2009 but the top 1 percent experienced wage gains in 2010 while the bottom 90 percent actually saw losses. (See the graph.)
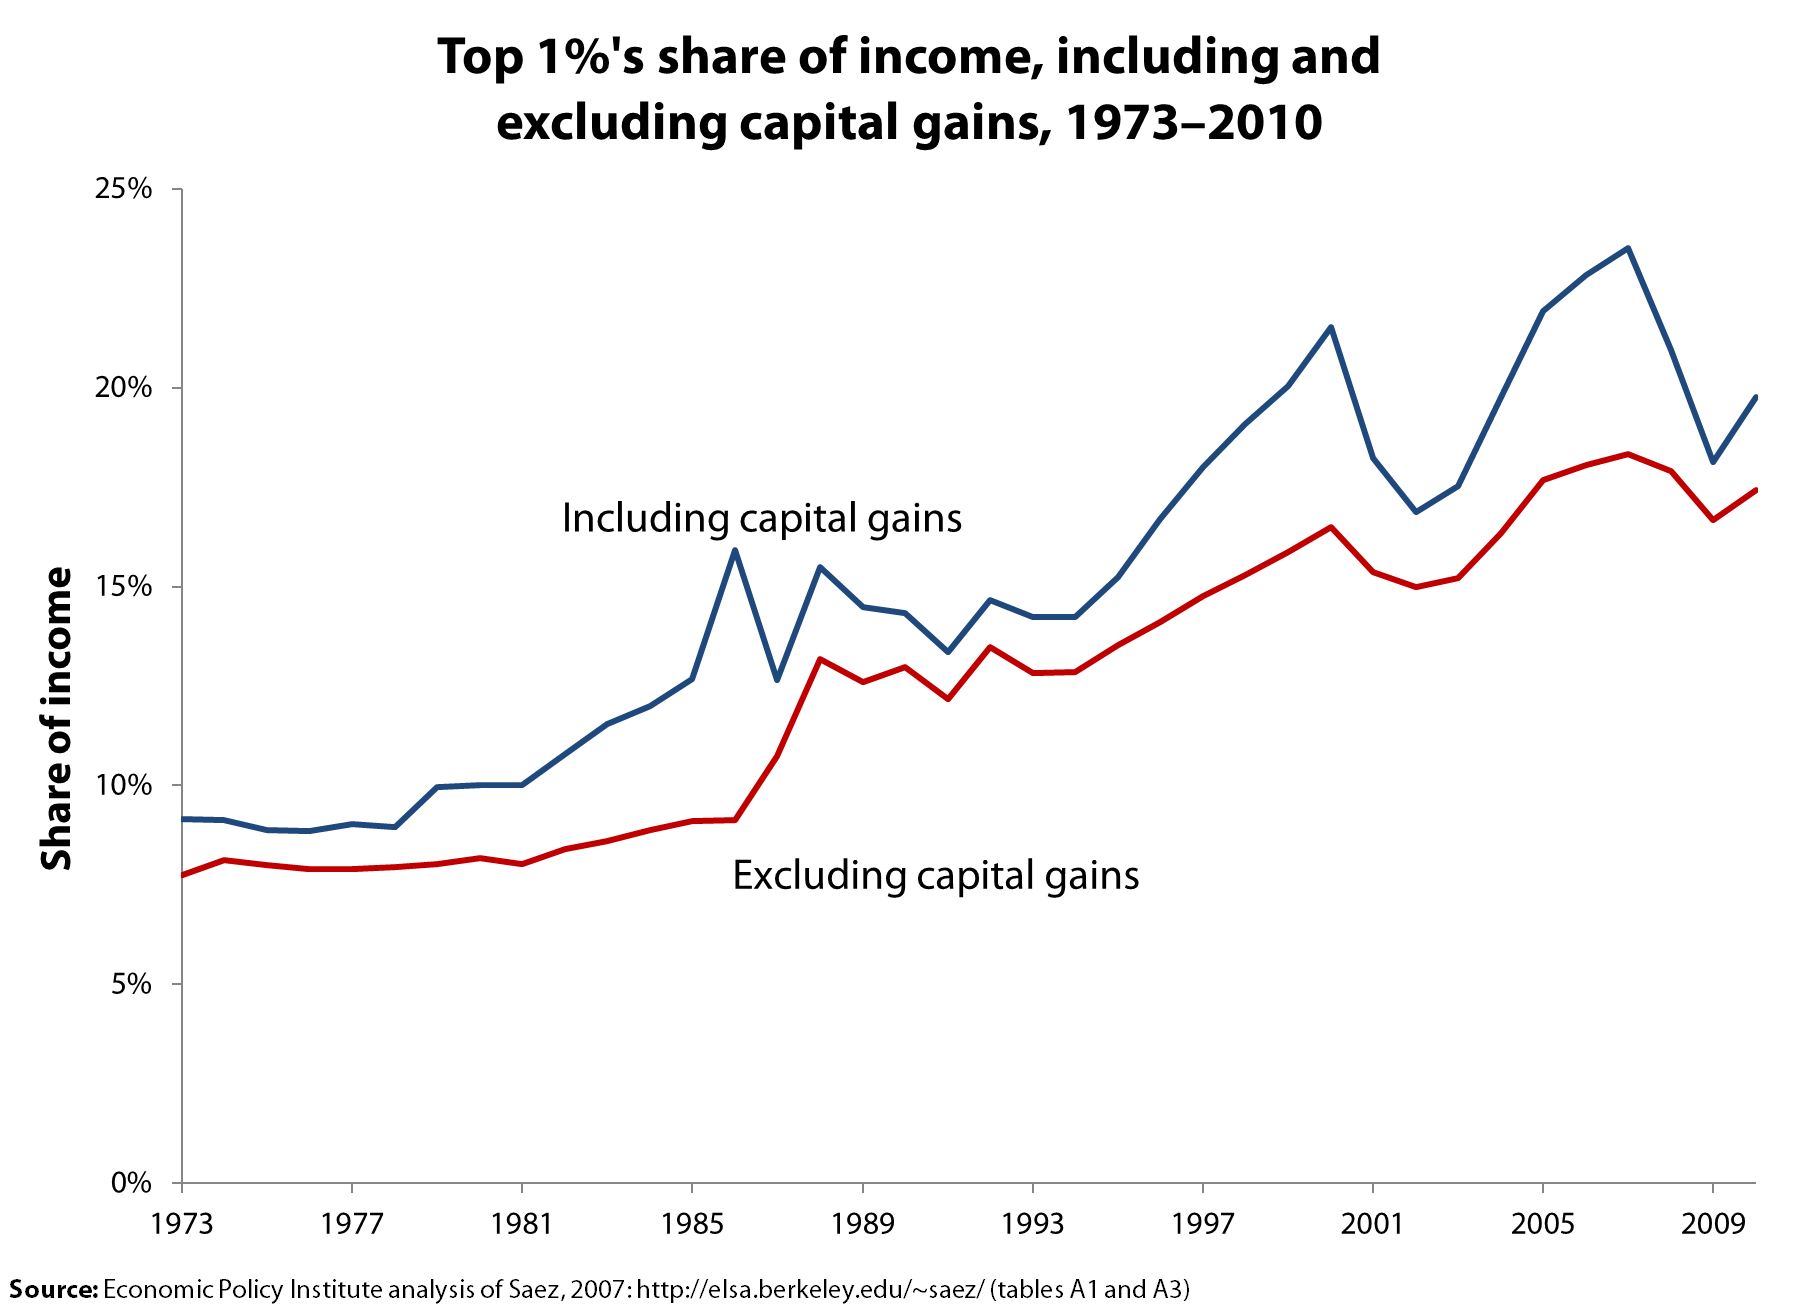
The trends in capital gains is another important piece of all this. In response to the misguided claim that the financial crisis ended concerns about income inequality (“We don’t want to spend years focused on income inequality, only to learn that the financial crisis fixed it for us,” said one observer), Nicholas Finio and I showed that realized capital gains trends are volatile and correspond to the stock market. This historic pattern would have led top incomes to fall over 2007-09 and then start recovering in 2010. So, with wages of the top 1 percent recovering and the stock market growing, it makes sense that the incomes at the top fared well in 2010 as the Saez data show, regardless of whether the income measures include or exclude realized capital gains.
Paul Krugman has already commented and Mike Konczal has offered his analysis. I am going to focus on what segments of the income distribution have recovered and by how much, as the following table does, showing the income shares of the top 1 percent and the rest of the top 10 percent for the recession years and for 1979, which is a useful historic benchmark.
| Household Income Shares | |||||
|---|---|---|---|---|---|
| Top 1% | Bottom | ||||
| Year | Top 0.1% | Next 0.9% | All top 1% | 90-99 % | 0-90 |
| Income excluding capital gains | |||||
| 1979 | 2.2 | 5.9 | 8.0 | 24.3 | 67.7 |
| 2007 | 8.2 | 10.2 | 18.3 | 27.3 | 54.3 |
| 2008 | 7.8 | 10.1 | 17.9 | 28.1 | 54.0 |
| 2009 | 7.0 | 9.6 | 16.7 | 28.8 | 54.5 |
| 2010 | 7.5 | 9.9 | 17.4 | 28.8 | 53.7 |
| Change | |||||
| 2007-09 | -1.1 | -0.5 | -1.6 | 1.5 | 0.2 |
| 2009-10 | 0.5 | 0.3 | 0.7 | 0.1 | -0.8 |
| Income excluding capital gains | |||||
| 1979 | 3.4 | 6.5 | 10.0 | 24.3 | 65.8 |
| 2007 | 12.3 | 11.2 | 23.5 | 26.2 | 50.3 |
| 2008 | 10.4 | 10.5 | 20.9 | 27.3 | 51.8 |
| 2009 | 8.3 | 9.8 | 18.1 | 28.4 | 53.5 |
| 2010 | 9.5 | 10.3 | 19.8 | 28.1 | 52.1 |
| Change | |||||
| 2007-09 | -4.0 | -1.4 | -5.4 | 2.1 | 3.2 |
| 2009-10 | 1.2 | 0.4 | 1.7 | -0.3 | -1.4 |
| Source: Mishel analysis of Piketty and Saez. 2012 | |||||
The top panel shows the changes in income shares using an income measure that does not include realized capital gains. Note the income share of the top 1 percent fell 1.6 percentage points between 2007 and 2009 with the largest fall among the very top 0.1 percent. Equally interesting is that almost of the income share lost by the top 1 percent was captured by the next 9 percent, those in the 90th to 99th percentiles. That is, the great redistribution that occurred happened almost totally among the top 10 percent and did not benefit the bottom 90 percent of households. From 2009 to 2010, the top 1 percent recouped almost half the income share lost in the downturn (gaining 0.7 percentage points of the 1.6 percentage points lost) and the 90-99th percentiles gained a bit more, up 0.1 percentage points. That means, by the way, that the bottom 90 percent saw their income share fall by 0.8 percentage points from 2009 to 2010. As for inequality reversing itself, note that even at the low point following the recession, 2009, the income share of the top 1 percent was 16.7 percent, still more than double the share in 1979 of just 8.0%. Not quite a reversal.
Income losses for the top 1 percent when realized capital gains are included in the income measure (in the bottom panel) were steeper. This follows from the fact that the top 1 percent receives a huge share of all capital gains. Using this measure, the lower income shares of the top 1 percent corresponded to an increased share among both the next 9 percent and the bottom 90 percent (seen by the fact that not all of the losses of the top 1 percent were gained by the next 9 percent). With this more inclusive income measure, the top 1 percent has recouped in 2009-10 only about 30 percent of what was lost from 2007 to 2009. Even with a shrunken income share in 2009 of 18.1 percent, however, the top 1 percent still has a substantially higher income share than 1979’s 10.0 percent. Again, not quite a reversal.
The top 1 percent may not regain the extraordinary income shares obtained in 2007 or in 2000, so it may be that income inequality peaked in those earlier years. Nevertheless, we can count on a few things. One is that the top 1 percent will see its share of income expand in the current recovery. A second is that income inequality, at least as measured by the income shares at the very top, will remain very high and much greater than what prevailed at the end of the 1970s. The forces at work driving up income inequality are still in place.
Enjoyed this post?
Sign up for EPI's newsletter so you never miss our research and insights on ways to make the economy work better for everyone.