Getting serious about the economic response to COVID-19
With the stock market plummeting and hysteria around COVID-19 (commonly known as the coronavirus) escalating, it is time to get serious about the economic policy response. Policymakers and the public will need help in distinguishing between smart responses and those that are just ideological opportunism, such as calls for cuts in taxes and regulations, for example.
Simply put, smart responses must be tailored to the type of recession the outbreak could cause if policymakers don’t act.
The three key elements of a potential COVID-19 recession are:
- If it comes, it will come fast.
- It will hit lower-wage workers first and hardest.
- It will impose even faster and larger costs on state and local governments than recessions normally do.
Each one of these should be targeted directly.
Any economic relief package should come online quickly, it should be even more targeted to help lower-wage workers than usual, and it should rapidly boost state and local government capacity on both the public health and economic fronts. Below I sketch out why these characteristics of the COVID-19 slowdown are likely, and what a tailored response to each would be.
First, if the COVID-19 outbreak slows the economy, it could happen very rapidly. This is quite different, for example, than the onset of the Great Recession. That recession was caused by the bursting of the home price bubble, which essentially began in mid-2006. From that point on the recession was near-inevitable, but it took literally years to gather steam. As the Great Recession loomed, the key characteristics policymakers should have demanded of any proposed stimulus package should have been: effective, large, and sustained. Fiscal policymakers decisively failed on the last point, and dwindling fiscal support hampered recovery for years.
A COVID-19 driven recession would be quite different in that it would hit quickly. The spread of the disease has been quite rapid in each country it has affected. Further, the public health response to maintain “social distancing” to thwart its spread tends to take effect rapidly as well. Even before the reported cases in the U.S. have reached large numbers, the news are full of cascading cancellations of business and entertainment gatherings. We are almost certainly already feeling the economic effects of the COVID-19 slowdown—it just has not appeared in economic statistics yet (since these statistics tend to appear with a small lag).Read more
Even HBO’s John Oliver didn’t provide the full context on ‘Medicare for All’ and jobs
There’s a lot of rhetoric out there right now about how providing “Medicare for All” (M4A) could destroy the economy or lead to ruinous tax increases. But one bright spot was HBO host John Oliver’s monologue on the plan that went viral last month.
Oliver took a characteristically in-depth look at the issues and was largely positive about how M4A could help a “badly broken” health care system given the millions of people who are uninsured and underinsured. Crucially, he noted that we’re going to pay for health care one way or the other, and M4A largely doesn’t add to the costs we pay (indeed, it could well reduce them significantly in the long run), instead it just changes how we pay these costs—substituting taxes for premiums.
Oliver provided a comprehensive accounting of the benefits of the health care proposal, but he also raised some possible pitfalls, including the jobs that could be lost given the elimination of the private health insurance industry. The problem is he quoted a 1.8 million job-loss figure that’s been widely circulated but is widely misleading when presented without context, as I explain in my new analysis of M4A’s impact on the labor market.
What to watch on jobs day: Expected future impact of COVID-19
As COVID-19—commonly known as the coronavirus—continues to spread throughout the world, it is likely to have a direct impact on the United States through the health and well-being of our population. It is also likely to have an impact on economic activity, as workers stop working to care for themselves or their families, and people generally reduce social spending. I’ll be watching this in tomorrow’s job report from the Bureau of Labor Statistics, and keeping an eye on it in the coming months. The first order of business, however, is to make sure that workers can follow the Centers for Disease Control and Prevention (CDC)’s recommendations to stay home and seek medical care—if they are lucky enough to have paid sick days and health insurance. While there are still very few reported cases in the United States, it is expected to spread and the effects may be far-reaching.
In terms of the economy, there has already been an impact on the manufacturing sector as inputs from China are delayed because of temporary factory closures. The Federal Reserve has cut interest rates in expectation of further economic disruptions. Many employers are making contingencies for workers to telecommute rather than risk illness. Unfortunately, this isn’t an option for millions of workers in direct service professions across the economy. Another likely side effect of the pandemic is a pull-back on social consumption. Either because people become sick themselves or are avoiding public spaces, there will likely be a drop in certain types of spending across the economy.Read more
Low-wage workers saw the biggest wage growth in states that increased their minimum wage between 2018 and 2019
Twenty-three states and the District of Columbia raised their minimum wage in 2019 through legislation, referendum, or because the minimum wage was indexed to inflation in those states. Low-wage workers in these states saw much faster wage growth than low-wage workers in states that did not increase their minimum wage between 2018 and 2019, as shown in EPI’s latest State of Working America Wages report. This blog post dives a bit deeper by dispelling some tempting explanations for what might be happening, such as stronger across-the-board wage growth in those states (didn’t happen) or employment losses (not borne out in the data).
Figure A shows in green the states with minimum wage increases that occurred through legislation or referendum in 2019, while states in blue had automatic increases resulting from indexing the minimum wage to inflation. Workers in states that increased their minimum wage between 2018 and 2019 account for about 55% of the U.S. workforce. The nominal minimum wage increases ranged from $0.05 (0.5%) in Alaska to $1.00 (9.1%−10.0%) in California, Massachusetts, and Maine.
The minimum wage increased in 23 states and the District of Columbia in 2019: States with minimum wage increases in 2019, by type of increase
| State | Abbreviation | Category |
|---|---|---|
| Alaska | AK | Indexed |
| Alabama | AL | No change |
| Arkansas | AR | Legislated or ballot measure |
| Arizona | AZ | Legislated or ballot measure |
| California | CA | Legislated or ballot measure |
| Colorado | CO | Legislated or ballot measure |
| Connecticut | CT | Legislated or ballot measure |
| District of Columbia | DC | Legislated or ballot measure |
| Delaware | DE | Legislated or ballot measure |
| Florida | FL | Indexed |
| Georgia | GA | No change |
| Hawaii | HI | No change |
| Iowa | IA | No change |
| Idaho | ID | No change |
| Illinois | IL | No change |
| Indiana | IN | No change |
| Kansas | KS | No change |
| Kentucky | KY | No change |
| Louisiana | LA | No change |
| Massachusetts | MA | Legislated or ballot measure |
| Maryland | MD | Legislated or ballot measure |
| Maine | ME | Legislated or ballot measure |
| Michigan | MI | Legislated or ballot measure |
| Minnesota | MN | Indexed |
| Missouri | MO | Legislated or ballot measure |
| Mississippi | MS | No change |
| Montana | MT | Indexed |
| North Carolina | NC | No change |
| North Dakota | ND | No change |
| Nebraska | NE | No change |
| New Hampshire | NH | No change |
| New Jersey | NJ | Legislated or ballot measure |
| New Mexico | NM | No change |
| Nevada | NV | No change |
| New York | NY | Legislated or ballot measure |
| Ohio | OH | Indexed |
| Oklahoma | OK | No change |
| Oregon | OR | Legislated or ballot measure |
| Pennsylvania | PA | No change |
| Rhode Island | RI | Legislated or ballot measure |
| South Carolina | SC | No change |
| South Dakota | SD | Indexed |
| Tennessee | TN | No change |
| Texas | TX | No change |
| Utah | UT | No change |
| Virginia | VA | No change |
| Vermont | VT | Indexed |
| Washington | WA | Legislated or ballot measure |
| Wisconsin | WI | No change |
| West Virginia | WV | No change |
| Wyoming | WY | No change |

Notes: Minimum wage increases passed through either legislation or ballot measure took effect on January 1, 2019, in Arkansas, Arizona, California, Colorado, Delaware, Maine, Massachusetts, Michigan, Missouri, New York, Rhode Island, and Washington. Alaska, Florida, Minnesota, Montana, New Jersey, Ohio, South Dakota, and Vermont increased their minimum wages in 2019 because of indexing to inflation. New Jersey, Oregon, and Washington, D.C., legislated minimum wage increases that took effect on July 1, 2019. Note that Connecticut legislated a minimum wage increase that took effect on October 1, 2019. This sample considers all changes after January 2018 and before December 2019; therefore, Maryland is included even though the legislated minimum wage increase for Maryland took effect on July 1, 2018. Note that after indexing to inflation on January 1, 2019, New Jersey legislated a minimum wage increase on July 1, 2019; therefore, New Jersey appears twice in these lists.
Source: EPI analysis of state minimum wage laws. See EPI’s minimum wage tracker for the most current state-level minimum wage information.
Figure B compares 10th-percentile wage growth in states with minimum wage increases compared with those without increases. Growth at the 10th percentile in states without minimum wage increases was much slower (0.9%) than in states with any kind of minimum wage increase (4.1%). This result holds true for both men and women. The 10th-percentile men’s wage grew 3.6% in states with minimum wage increases, compared with 0.7% growth in states without any minimum wage increases, while women’s 10th-percentile wages grew 2.8% in states with minimum wage increases and 1.4% in states without.
Wage growth at the bottom was strongest in states with minimum wage increases in 2019: 10th-percentile wage growth, by presence of 2019 state minimum wage increase and by gender, 2018–2019
| States with minimum wage increases | States without minimum wage increases | |
|---|---|---|
| Overall | 4.1% | 0.9% |
| Men | 3.6% | 0.7% |
| Women | 2.8% | 1.4% |
Notes: Minimum wage increases passed through either legislation or ballot measure took effect on January 1, 2019, in Arkansas, Arizona, California, Colorado, Delaware, Maine, Massachusetts, Michigan, Missouri, New York, Rhode Island, and Washington. Alaska, Florida, Minnesota, Montana, New Jersey, Ohio, South Dakota, and Vermont increased their minimum wages in 2019 because of indexing to inflation. New Jersey, Oregon, and Washington, D.C., legislated minimum wage increases that took effect on July 1, 2019. Note that Connecticut legislated a minimum wage increase that took effect on October 1, 2019. This sample considers all changes after January 2018 and before December 2019; therefore, Maryland is included even though the legislated minimum wage increase for Maryland took effect on July 1, 2018. Note that after indexing to inflation on January 1, 2019, New Jersey legislated a minimum wage increase on July 1, 2019; therefore, New Jersey appears twice in these lists.
Sources: Author’s analysis of EPI Current Population Survey Extracts, Version 1.0 (2020), https://microdata.epi.org, and EPI analysis of state minimum wage laws. See EPI’s minimum wage tracker for the most current state-level minimum wage information.
Economic policy and COVID-19—Mitigate harm and plan for the future: A list of considerations for policymakers
The direct cost that COVID-19 inflicts on human health is obviously its most important effect on society. But this direct cost can be worsened by flawed economic and policy structures. And the indirect damage the disease causes through economic ripple effects could be large, so policymakers should do everything they can to minimize them.
Past decisions that have weakened our economic policy infrastructure will hamper our response to COVID-19; this is already baked into the cake. But there are some short-run ameliorative actions we can take that might help, and there are long-run policy changes that will aid our response to future epidemics.
In technical economic terms, COVID-19 combines potential supply shocks with sector-specific demand shocks. Basically, supply shocks hamper our ability to produce goods and services, and demand shocks are sharp cutbacks in spending from households, businesses, or governments. Below I provide a list for policymakers of what could/should be considered to deal with some of these.
The supply shocks come from disrupted global value chains, as, for example, Chinese production of inputs used by U.S. manufacturing and construction firms are not delivered on time because Chinese factories have temporarily closed. In countries where schools are shut down for long periods of time, a shock to labor supply can occur as working parents have to stay home to care for kids.
The potential sector-specific demand shock is to businesses where consumption is largely social—done with other people around. Think bars, restaurants, grocery stores, and malls. As people avoid social contact to minimize disease transmission, this leads to less activity in these sectors.
These effects mean it will be hard indeed for policymakers to spare the economy any pain from this.
There’s very little that can be done about the supply-side shocks—particularly in the short run. Demand-side shocks are generally easier to address with policy (in theory—policymakers still often fumble the ball in this regard), but the specific nature of the demand shocks associated with COVID-19 make them slightly harder to address. Simply giving households more money won’t boost consumption much in the sectors likely to be affected—the pullback in consumption is not driven by income constraints, but due to concerns over catching the illness.
EPI President Thea Lee testifies before the House Committee on Ways and Means on U.S.–China Trade and Competition (Video)
On February 26, EPI President Thea Lee testified before the House Committee on Ways and Means on the impact of the imbalanced U.S.–China economic relationship on U.S. jobs, wages, businesses, and long-term growth.
In her testimony, Lee discussed the history of U.S. trade policy toward China, problems with Trump’s “phase one” deal with China, and fundamental flaws in the U.S.–China economic relationship. According to new EPI research, the growing U.S.–China trade deficit was responsible for the loss of 3.7 million U.S. jobs between 2001 and 2018. These job losses are spread across all 50 states and the District of Columbia—and every congressional district in America.
Watch her testimony:
Lack of paid sick days and large numbers of uninsured increase risks of spreading the coronavirus
COVID-19—commonly known as the coronavirus—is now a potential threat for the United States and we all “need to be preparing for significant disruption of our lives,” warned the Centers for Disease Control and Prevention (CDC) this week.
Unfortunately, preparing for the “significant disruption” will be economically unimaginable for one group of Americans—the millions of people in the United States who do not have access to paid sick days or have health insurance with a regular health care provider.
The CDC released very clear instructions to help prevent the spread of respiratory diseases, including staying home when you are sick. Not everyone has that option.
Overall, just under three-quarters (73%) of private-sector workers in the United States have the ability to earn paid sick time at work. And, as shown in Figure A, below, access to paid sick days is vastly unequal. The highest-wage workers are more than three times as likely to have access to paid sick leave as the lowest-paid workers. Whereas 93% of the highest-wage workers had access to paid sick days, only 30% of the lowest-paid workers are able to earn sick days. In this way, access to paid sick days increases with wages among workers, disproportionately denying workers at the bottom this important security. And low-wage workers are more likely to be found in occupations where they have contact with the public—think early care and education workers, home health aides, restaurant workers, and food processors. When workers or their family members are sick, they shouldn’t have to decide between staying home from work to care for themselves or their dependents and paying rent or putting food on the table. But that is the situation our policymakers have put workers in.
Black-white wage gaps are worse today than in 2000
This week, my colleagues hosted a discussion on the policies that the 2020 presidential candidates should focus on in order to help black workers in the economy. One of the challenges that the presidential candidates should discuss is how to reduce the black–white wage gap—which has stubbornly persisted over the last four decades. Black-white wage gaps are large and have gotten worse in the last 20 years.
The latest findings on wage growth as documented in EPI’s State of Working America Wages 2019 report indicate wages in general are slowly improving with the growing economy, but wage inequality has grown and wage gaps have persisted, and in some cases, worsened. In this post, I will highlight the worsening black-white wage gap and look at it from multiple dimensions. Since 2000, by any way it’s measured, the wage gap between black and white workers has grown significantly.
The figure below compares wages for black and white workers over the last 19 years, highlighting the gaps in wages in 2000, the last time the economy was closest to full employment, 2007, the last business cycle peak before the Great Recession, and 2019, the latest data available. Against these benchmarks, I illustrated the growth in the average gap, the gap for low-, middle-, and high-wage workers, the gap for workers with a high school diploma, a college degree, and an advanced degree, and a regression-adjusted wage gap (controlling for age, gender, education, and region).
Black–white wage gaps widen across multiple measures: Black–white wages gaps at different points in the wage distribution, by education, and regression-based, 2000, 2007, and 2019
| 2000 | 2007 | 2019 | |
|---|---|---|---|
| Average | 21.8% | 23.5% | 26.5% |
| 10th percentile | 6.2% | 8.7% | 9.0% |
| Median | 20.8% | 22.3% | 24.4% |
| 95th percentile | 28.0% | 28.3% | 34.7% |
| High school | 15.3% | 17.4% | 18.3% |
| College | 17.2% | 19.2% | 22.5% |
| Advanced degree | 12.5% | 16.7% | 17.6% |
| Regression-based | 10.2% | 12.2% | 14.9% |
Notes: Sample based on all workers ages 16 and older. The xth-percentile wage is the wage at which x% of wage earners earn less and (100-x)% earn more. Educational attainment is based on mutually exclusive categories: e.g., high school is high school only, etc. Similar results are found for those with less than high school or some college. The regression-adjusted black–white wage gap controls for education, age, gender, and region.
Source: Author’s analysis of EPI Current Population Survey Extracts, Version 1.0 (2020), https://microdata.epi.org.
The black–white wage gap is smallest at the bottom of the wage distribution, where the minimum wage serves as a wage floor. The largest black–white wage gap as well as the one with the most growth since the Great Recession, is found at the top of the wage distribution, explained in part by the pulling away of top earners generally as well as continued occupational segregation, the disproportionate likelihood for white workers to occupy positions in the highest-wage professions.
It’s clear from the figure that education is not a panacea for closing these wage gaps. Again, this should not be shocking, as increased equality of educational access—as laudable a goal as it is—has been shown to have only small effects on class-based wage inequality, and racial wealth gaps have been almost entirely unmoved by a narrowing of the black–white college attainment gap, as demonstrated by William Darity Jr. and others.
Black workers can’t simply educate their way out of the gap. Across various levels of education, a significant black–white wage gap remains. Even black workers with an advanced degree experience a significant wage gap compared with their white counterparts. And after controlling for age, gender, education, and region, black workers are paid 14.9% less than white workers.
While the wage gaps differ depending on measure, what is obvious from the trends displayed is that the gaps widened in the full business cycle 2000–2007 and continued to grow in the Great Recession and its aftermath. Even though the black unemployment rate has fallen precipitously over the last several years, wage growth has remained particularly weak for black workers.
As always, it’s important to remember the historical and social contexts for differences in black and white labor market experiences and labor market outcomes (see Razza). Workers’ ability to claim higher wages rests on a host of social, political, and institutional factors outside of their control. The systematic social deprivation and economic disadvantage is maintained and reinforced by those with economic and political power. Furthermore, occupational segregation plays a significant role in these gaps, for both black men and black women. And, black women, in particularly, can face larger wages gaps with white men than the sum of their parts, meaning the black women face a double wage penalty for their race and gender. The trends in black–white wage gaps found here are supported by other important research that shows that black-white wage gaps expanded with rising inequality from 1979 to 2015.
Given a long history of excluding black Americans from social and political institutions that boost wage growth, the stubbornness of racial wage gaps is less surprising. However, the fact that they are getting worse is troubling. The good news is that policy can make a difference.
We see in the figure that the minimum wage keeps the lowest-wage black workers from even lower wages. In states that increased in the minimum wage between 2018 and 2019, low-wage workers saw stronger wage growth than in states that had no increase in their minimum wage in that period. Raising the federal minimum wage would disproportionately benefit black workers because they are overrepresented among low-wage workers and are less likely to live in states or localities that have passed a minimum wage that is higher than the current federal minimum.
Aside from strengthening and enforcing labor standards such as the minimum wage, making it easier for workers to form unions can narrow the black–white wage gap. Black workers are more likely to be in a union than white and get a bigger wage boost to being in a union than white. Therefore, unions can help shrink the black–white wage gap. Related, research has shown that the decline of unionization led to an expansion of the black–white wage gap.
Using all fiscal and monetary policy levers to achieve and maintain high-pressure labor markets can improve relative labor market outcomes for black workers, including participation in the labor force and work hours as well as wage growth. The U.S. certainly saw this stronger across the board growth in the tight labor market of the late 1990s.
In 2019, black wages exceeded their 2000 and 2007 levels across the wage distribution for the first time in this recovery. I’m hopeful that as the economy continues to move toward genuine full employment, black workers will see their wages rise. But it will take more than a couple of years of a full-employment economy to close racial wage gaps and compensate for years of lower wages, lower incomes, and lower wealth.
The U.S. federal tax and spending system is the biggest tool to combat inequality, but it could do much more
Last week, we launched the U.S. Tax & Spending Explorer on the EPI website. It’s an interactive web feature designed to shed light on how the government (mostly the federal government) raises and spends money and how changes in taxes and spending over time either increase or decrease income inequality.
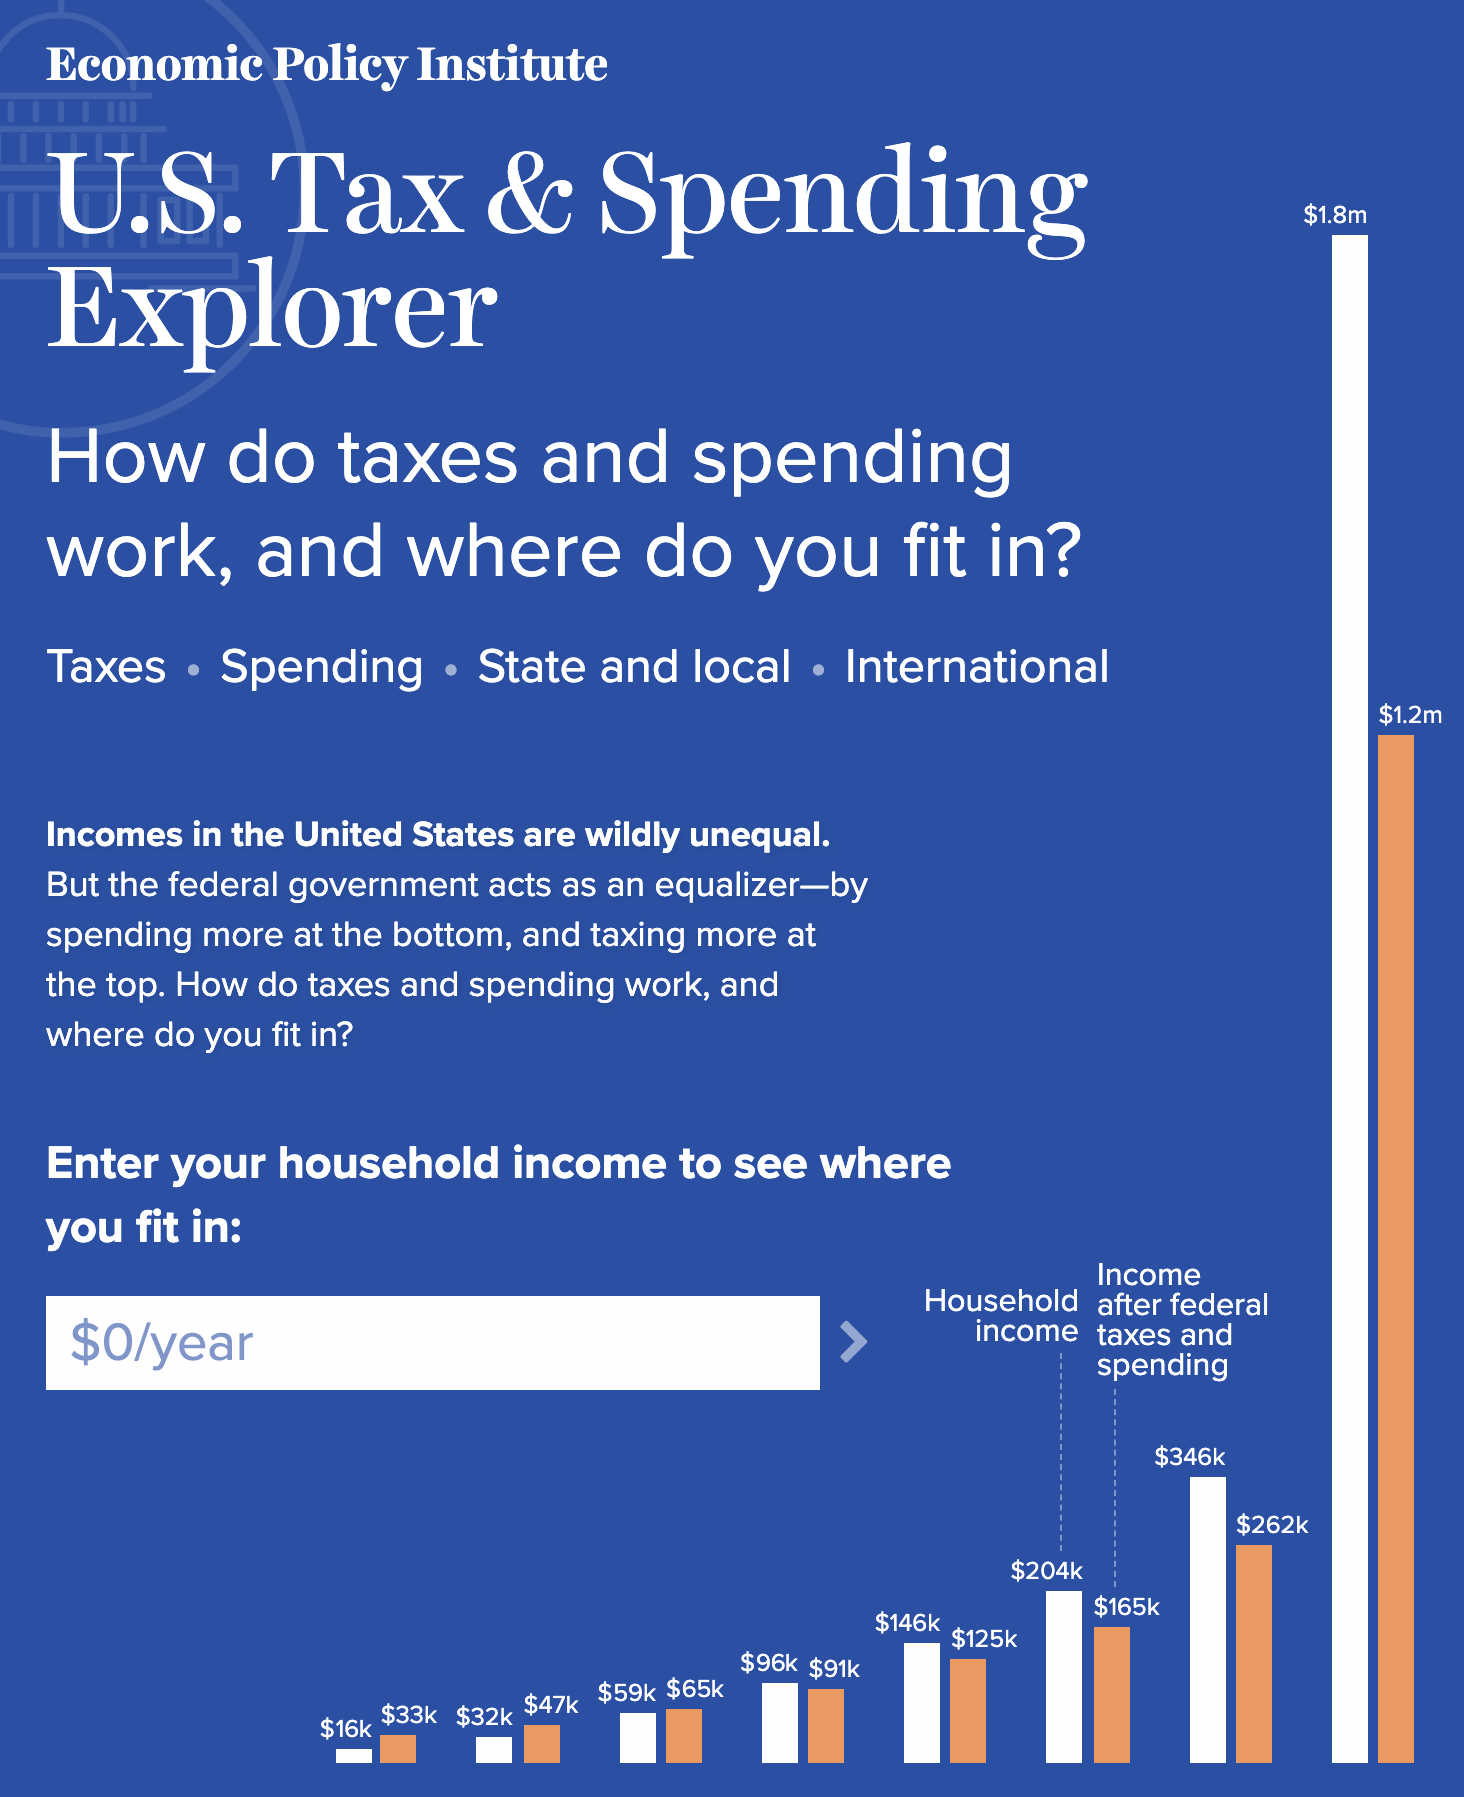
There’s enough granular detail in the feature that everybody might have different takeaways from visiting it. But here’s what strikes me looking at this data:
- Together, taxes and spending significantly reduce inequality at any given point in time relative to a world with a much smaller federal footprint. That’s the good news. The bad news is that since 1979 the inequality-reducing effect of taxes and spending hasn’t grown that much—but inequality has grown, a lot. We should use the proven inequality-fighting lever of a larger tax and spending system to combat the inequality that has risen so fast in recent decades.
Medicare4All C-Span discussion sheds light on its impact
Economic Policy Institute’s Director of Research Josh Bivens and American Enterprise Institute’s Jospeh Antos addressed the issue of Medicare for All, and the larger role health care policy is playing in Campaign 2020 on C-Span’s Washington Journal Saturday.
The United States needs movement forward on healthcare that makes it accessible and affordable, said Bivens during the discussion.
“I think there’s a real hunger out there for something for health reform,” he explained. “Health care is something that Americans worry about the most, not just their health but would means for financial security and that worry is well-placed. We have a uniquely dysfunctional health care system.
“We spend on a per capita basis about $10,000 per person, we have some great health systems in the world, number one in terms of health outcomes as France and the Netherlands who spend literally half of what we spend. One of the reasons why a single-payer plan would be expensive is because we still have 27 million uninsured people and 60 million underinsured people. So, yeah, it would be more expensive to give health care to people who need it, but that’s the virtue of a fundamental reform. Keeping costs down by keeping people excluded, seems to me as not the way to go.”
Bivens is the author of a soon-to-be released paper on the impact of fundamental health care reform, including Medicare for All, on wages and job quality.
Sign up here for EPI’s newsletter so you don’t miss the report’s release, or any other essential labor research, analysis and trends from EPI’s research team.