More of the same: JOLTS is continued evidence of a slow moving economy
Today’s Job Openings and Labor Turnover Survey (JOLTS) report shows there has been little change in the labor market for America’s workers. The rate of job openings actually decreased in August to 5.4 million. At the same time, the hires rate held steady while the quits rate remains depressed. Coupled with jobs reports so far this year, today’s report provides more evidence of a slow moving economy, with meager wage growth and employment growth that’s just keeping up with the growth in the working age population.
There is still a significant gap between the number of people looking for jobs and the number of job openings. The figure below shows the levels of unemployed workers and job openings. You can see the labor market improve over the last five years, as the number of unemployed workers falls and job openings rise. In a stronger economy (like the one shown in the initial year of data), these levels would be much closer together. Today, there are still 1.5 active job seekers for every job opening. Furthermore, on top of the 8+ million unemployed workers warming the bench, there are still four million workers sitting in the stands with little hope to even get in the game.
Job openings levels and unemployment levels, 2000-2015
| Month | Job Openings level | Unemployment level |
|---|---|---|
| Dec-2000 | 4.934 | 5.634 |
| Jan-2001 | 5.273 | 6.023 |
| Feb-2001 | 4.706 | 6.089 |
| Mar-2001 | 4.618 | 6.141 |
| Apr-2001 | 4.668 | 6.271 |
| May-2001 | 4.444 | 6.226 |
| Jun-2001 | 4.232 | 6.484 |
| Jul-2001 | 4.354 | 6.583 |
| Aug-2001 | 4.095 | 7.042 |
| Sep-2001 | 3.973 | 7.142 |
| Oct-2001 | 3.594 | 7.694 |
| Nov-2001 | 3.545 | 8.003 |
| Dec-2001 | 3.586 | 8.258 |
| Jan-2002 | 3.587 | 8.182 |
| Feb-2002 | 3.412 | 8.215 |
| Mar-2002 | 3.605 | 8.304 |
| Apr-2002 | 3.357 | 8.599 |
| May-2002 | 3.525 | 8.399 |
| Jun-2002 | 3.325 | 8.393 |
| Jul-2002 | 3.343 | 8.39 |
| Aug-2002 | 3.462 | 8.304 |
| Sep-2002 | 3.319 | 8.251 |
| Oct-2002 | 3.502 | 8.307 |
| Nov-2002 | 3.585 | 8.52 |
| Dec-2002 | 3.074 | 8.64 |
| Jan-2003 | 3.686 | 8.52 |
| Feb-2003 | 3.402 | 8.618 |
| Mar-2003 | 3.101 | 8.588 |
| Apr-2003 | 3.182 | 8.842 |
| May-2003 | 3.201 | 8.957 |
| Jun-2003 | 3.356 | 9.266 |
| Jul-2003 | 3.195 | 9.011 |
| Aug-2003 | 3.239 | 8.896 |
| Sep-2003 | 3.054 | 8.921 |
| Oct-2003 | 3.196 | 8.732 |
| Nov-2003 | 3.316 | 8.576 |
| Dec-2003 | 3.334 | 8.317 |
| Jan-2004 | 3.391 | 8.37 |
| Feb-2004 | 3.437 | 8.167 |
| Mar-2004 | 3.42 | 8.491 |
| Apr-2004 | 3.466 | 8.17 |
| May-2004 | 3.658 | 8.212 |
| Jun-2004 | 3.384 | 8.286 |
| Jul-2004 | 3.835 | 8.136 |
| Aug-2004 | 3.578 | 7.99 |
| Sep-2004 | 3.704 | 7.927 |
| Oct-2004 | 3.779 | 8.061 |
| Nov-2004 | 3.456 | 7.932 |
| Dec-2004 | 3.846 | 7.934 |
| Jan-2005 | 3.595 | 7.784 |
| Feb-2005 | 3.842 | 7.98 |
| Mar-2005 | 3.891 | 7.737 |
| Apr-2005 | 4.115 | 7.672 |
| May-2005 | 3.824 | 7.651 |
| Jun-2005 | 4.018 | 7.524 |
| Jul-2005 | 4.162 | 7.406 |
| Aug-2005 | 4.085 | 7.345 |
| Sep-2005 | 4.227 | 7.553 |
| Oct-2005 | 4.23 | 7.453 |
| Nov-2005 | 4.341 | 7.566 |
| Dec-2005 | 4.249 | 7.279 |
| Jan-2006 | 4.278 | 7.064 |
| Feb-2006 | 4.308 | 7.184 |
| Mar-2006 | 4.537 | 7.072 |
| Apr-2006 | 4.495 | 7.12 |
| May-2006 | 4.432 | 6.98 |
| Jun-2006 | 4.331 | 7.001 |
| Jul-2006 | 4.081 | 7.175 |
| Aug-2006 | 4.411 | 7.091 |
| Sep-2006 | 4.498 | 6.847 |
| Oct-2006 | 4.454 | 6.727 |
| Nov-2006 | 4.622 | 6.872 |
| Dec-2006 | 4.552 | 6.762 |
| Jan-2007 | 4.59 | 7.116 |
| Feb-2007 | 4.481 | 6.927 |
| Mar-2007 | 4.657 | 6.731 |
| Apr-2007 | 4.534 | 6.85 |
| May-2007 | 4.531 | 6.766 |
| Jun-2007 | 4.639 | 6.979 |
| Jul-2007 | 4.43 | 7.149 |
| Aug-2007 | 4.508 | 7.067 |
| Sep-2007 | 4.481 | 7.17 |
| Oct-2007 | 4.278 | 7.237 |
| Nov-2007 | 4.278 | 7.24 |
| Dec-2007 | 4.323 | 7.645 |
| Jan-2008 | 4.223 | 7.685 |
| Feb-2008 | 4.039 | 7.497 |
| Mar-2008 | 4.012 | 7.822 |
| Apr-2008 | 3.85 | 7.637 |
| May-2008 | 4 | 8.395 |
| Jun-2008 | 3.67 | 8.575 |
| Jul-2008 | 3.762 | 8.937 |
| Aug-2008 | 3.584 | 9.438 |
| Sep-2008 | 3.21 | 9.494 |
| Oct-2008 | 3.273 | 10.074 |
| Nov-2008 | 3.059 | 10.538 |
| Dec-2008 | 3.049 | 11.286 |
| Jan-2009 | 2.763 | 12.058 |
| Feb-2009 | 2.794 | 12.898 |
| Mar-2009 | 2.493 | 13.426 |
| Apr-2009 | 2.271 | 13.853 |
| May-2009 | 2.413 | 14.499 |
| Jun-2009 | 2.388 | 14.707 |
| Jul-2009 | 2.146 | 14.601 |
| Aug-2009 | 2.294 | 14.814 |
| Sep-2009 | 2.434 | 15.009 |
| Oct-2009 | 2.376 | 15.352 |
| Nov-2009 | 2.419 | 15.219 |
| Dec-2009 | 2.49 | 15.098 |
| Jan-2010 | 2.706 | 15.046 |
| Feb-2010 | 2.561 | 15.113 |
| Mar-2010 | 2.652 | 15.202 |
| Apr-2010 | 3.097 | 15.325 |
| May-2010 | 2.9 | 14.849 |
| Jun-2010 | 2.728 | 14.474 |
| Jul-2010 | 2.929 | 14.512 |
| Aug-2010 | 2.869 | 14.648 |
| Sep-2010 | 2.782 | 14.579 |
| Oct-2010 | 3.026 | 14.516 |
| Nov-2010 | 3.072 | 15.081 |
| Dec-2010 | 2.909 | 14.348 |
| Jan-2011 | 2.917 | 14.046 |
| Feb-2011 | 3.065 | 13.828 |
| Mar-2011 | 3.132 | 13.728 |
| Apr-2011 | 3.099 | 13.956 |
| May-2011 | 3.032 | 13.853 |
| Jun-2011 | 3.194 | 13.958 |
| Jul-2011 | 3.417 | 13.756 |
| Aug-2011 | 3.138 | 13.806 |
| Sep-2011 | 3.557 | 13.929 |
| Oct-2011 | 3.422 | 13.599 |
| Nov-2011 | 3.215 | 13.309 |
| Dec-2011 | 3.527 | 13.071 |
| Jan-2012 | 3.653 | 12.812 |
| Feb-2012 | 3.517 | 12.828 |
| Mar-2012 | 3.837 | 12.696 |
| Apr-2012 | 3.627 | 12.636 |
| May-2012 | 3.696 | 12.668 |
| Jun-2012 | 3.785 | 12.688 |
| Jul-2012 | 3.587 | 12.657 |
| Aug-2012 | 3.637 | 12.449 |
| Sep-2012 | 3.614 | 12.106 |
| Oct-2012 | 3.729 | 12.141 |
| Nov-2012 | 3.741 | 12.026 |
| Dec-2012 | 3.64 | 12.272 |
| Jan-2013 | 3.77 | 12.497 |
| Feb-2013 | 4.023 | 11.967 |
| Mar-2013 | 3.891 | 11.653 |
| Apr-2013 | 3.84 | 11.735 |
| May-2013 | 3.829 | 11.671 |
| Jun-2013 | 3.864 | 11.736 |
| Jul-2013 | 3.829 | 11.357 |
| Aug-2013 | 3.893 | 11.241 |
| Sep-2013 | 3.955 | 11.251 |
| Oct-2013 | 4.076 | 11.161 |
| Nov-2013 | 4.073 | 10.814 |
| Dec-2013 | 3.977 | 10.376 |
| Jan-2014 | 3.906 | 10.28 |
| Feb-2014 | 4.160 | 10.387 |
| Mar-2014 | 4.210 | 10.384 |
| Apr-2014 | 4.417 | 9.696 |
| May-2014 | 4.608 | 9.761 |
| Jun-2014 | 4.710 | 9.453 |
| Jul-2014 | 4.726 | 9.648 |
| Aug-2014 | 4.925 | 9.568 |
| Sep-2014 | 4.678 | 9.237 |
| Oct-2014 | 4.849 | 8.983 |
| Nov-2014 | 4.886 | 9.071 |
| Dec-2014 | 4.877 | 8.688 |
| Jan-2015 | 4.965 | 8.979 |
| Feb-2015 | 5.144 | 8.705 |
| Mar-2015 | 5.109 | 8.575 |
| Apr-2015 | 5.334 | 8.549 |
| May-2015 | 5.357 | 8.674 |
| Jun-2015 | 5.323 | 8.299 |
| Jul-2015 | 5.668 | 8.266 |
| Aug-2015 | 5.370 | 8.029 |

Note: Shaded areas denote recessions.
Source: EPI analysis of Bureau of Labor Statistics Job Openings and Labor Turnover Survey and Current Population Survey
Urban Outfitters gets into the holiday spirit by asking its employees to work for free
An internal memo to the staff of hipster retailer Urban Outfitters, which was leaked to Gawker, gives us a window into how the retailer’s Philadelphia-based parent company, URBN, plans to deal with the upcoming holiday rush. Their not-so-innovative idea: ask employees to work for free.
In a “call for volunteers,” URBN informs the staff that “October will be the busiest month yet for the [fulfillment] center, and we need additional helping hands to ensure the timely shipment of orders.” It goes on to explain to its employees that “as a volunteer, you will work side by side with your [fulfillment center] colleagues to help pick, pack and ship orders for our wholesale and direct customers.”
In short, URBN, whose executive staff took home a combined $12.2 million in compensation last year, is asking its employees to take time out of their weekends to commute to rural Pennsylvania and work in a warehouse—for free.
Unsurprisingly, this request is most likely illegal. According to the Fair Labor Standards Act (FLSA), it is unlawful for a for-profit employer “to suffer or permit” someone to work without compensation—consequently, asking an employee who is not “exempt” to “volunteer” for a for-profit enterprise, whether they are salaried or hourly, is explicitly prohibited by the FLSA.
Failure to stem dollar appreciation has put manufacturing recovery in reverse
This week, President Obama announced the completion of negotiations on the proposed Trans-Pacific Partnership (TPP). The TPP, which is likely to drive down middle-class wages and increase offshoring and job loss, has been widely criticized by leading members of Congress from both parties. Hillary Clinton, Bernie Saunders, and other presidential candidates have announced their opposition to the deal.
Meanwhile, U.S. jobs and the recovery are threatened by a growing trade deficit in manufactured products, which is on pace to reach $633.9 billion in 2015, as shown in Figure A, below. This deficit exceeds the previous peak of $558.5 billion in 2006 (not shown) by more than $75 billion. The increase in the manufacturing trade deficit in 2015 alone will amount to 0.5 percent of projected GDP, and will likely reduced projected growth by even more as manufacturing wages and profits are reduced.
U.S. manufacturing trade deficit, 2007–2015* (billions of dollars)
| Year | U.S. manufacturing trade deficit (billions of dollars) |
|---|---|
| 2007 | 532.222 |
| 2008 | 456.240 |
| 2009 | 319.471 |
| 2010 | 412.740 |
| 2011 | 440.602 |
| 2012 | 458.692 |
| 2013 | 449.276 |
| 2014 | 515.131 |
| 2015 | 633.915 |
* Estimated, based on year-to-date trade data through August 2015
Source: Author's analysis of U.S. International Trade Commission Trade DataWeb
The growth of the manufacturing trade deficit is starting to have an impact on manufacturing employment, which has lost 27,300 jobs since July 2015, as shown in Figure B, below. Growing exports support U.S. jobs, but increases in imports cost jobs, so even if overall exports are growing, trade deficits hurt U.S. employment—especially in manufacturing, because most traded goods are manufactured products. Although the United States had regained more than 800,000 manufacturing jobs since 2010, the low point of the manufacturing collapse after the great recession, overall manufacturing employment is still 1.4 million jobs lower than it was in December 2007.
ACA excise tax on expensive health plans is an unambiguous pay cut
The Affordable Care Act is making the U.S. health system much more efficient and fair. One provision of it, however, remains controversial, even among those strongly supportive of the overall law. This is the 40 percent excise tax on the marginal cost of expensive health plans, sometimes very misleadingly referred to as the “Cadillac Tax.” Defenders of this tax, and even many reporters, have claimed recently that the tax will “give Americans a raise” or will “raise incomes.” These claims are wrong. Instead, the excise tax— even in the best case—is an unambiguous cut in after-tax pay for workers.
Beginning in 2018, the tax will be levied on the cost of single plans in excess of $10,200 a year, and non-single plans in excess of $27,500. The point of the tax is to nudge workers into taking thinner health plans—those with lower premiums that stay under the threshold for the tax. But choosing plans with lower premiums will generally lead to higher out-of-pocket costs – higher deductibles, co-pays and/or other forms of cost sharing. This increased cost-sharing is the point of the tax, not a byproduct. By boosting the marginal cost of each new episode of obtaining health care, the theory is that health consumers will shop more wisely and cut back on unnecessary care. We have strong reservations about leaning on this dynamic as effective cost containment, but for now I’ll focus on a side claim made by defenders: that a happy consequence of accepting plans with lower premium costs is that workers will see higher wages.
The theory for this is that if employers cut back on contributions to health insurance premiums as workers choose thinner plans, more money will become available to boost non-health care compensation—wages or other fringe benefits. This presumed increase in wages actually accounts for a significant share of estimated revenue that will be raised by the tax. (I should note that if the compensating wage boost stemming from lower employer premium payments does not happen, this does not necessarily mean that the tax won’t raise money. Lower premium costs and unchanged wages paid by employers imply a rise in business income or profitability, and this higher profitability should mean higher tax payments by employers.)
Human resources group shoots at Obama overtime rule but misses
This will be the first in a series of blog posts examining some of the comments submitted to the U.S. Department of Labor (DOL) in response to its notice of proposed rulemaking (NPRM) on overtime pay for salaried employees. Approximately 300,000 comments have been acknowledged by DOL; I want to call attention to a few of the most salient comments, both pro and con.
I’ll start with the Human Resources Policy Association (HRPA), which claims to represent “the most senior human resource executives in more than 360 of the largest companies in the United States.” HRPA’s comment addresses both what DOL actually proposed as well as ideas it was merely considering. Three of HRPA’s criticisms are worth considering, though each is deeply flawed:
- The proposed salary level is too high because it “would effectively nullify the statutory exemption for a significant number of employees Congress meant to exempt.”
- The proposed rule would limit “workplace flexibility.”
- The rule should not index the salary level test.
The salary level proposed by DOL is modest and meets the congressional intent
HRPA’s argument that the salary level is too high begins with a misstatement of the role of the salary level test. It very clearly is not intended to set a “level at which the employees below it clearly would not meet any [executive, administrative, or professional (EAP)] duties test.” The salary level test would be redundant if the employees covered by it clearly would not meet any EAP duties test. In fact, DOL has long expressed the exact opposite intent. In the words of DOL’s 1949 report and recommendations, “the salary level must be high enough to include only those persons about whose exemption there is normally no question” (Weiss, 23).
Tax on expensive health insurance plans could cut care along with costs
This piece originally appeared in the Wall Street Journal’s Think Tank.
The Affordable Care Act took enormous strides toward providing access to health-care coverage to the tens of millions of uninsured Americans and reining in the skyrocketing costs of health care that heavily pressured households and public budgets, addressing what we consider the most glaring shortcomings of the U.S. health system. When it comes to cost control, however, the policy virtue of one provision of the ACA–the excise tax on high-cost employer-sponsored health insurance plans, frequently called the Cadillac tax–is often overstated.
This provision levies a 40% tax on the cost of insurance plans that exceed $10,200 for individuals in 2018 ($27,500 for non-single plans). The policy goal of this tax is to nudge workers into opting for plans that charge lower premiums. Lower premiums in turn imply higher co-pays, deductibles, and cost-sharing. To be clear, these higher out-of-pocket costs are the point of the tax, not a byproduct. The theory is that as each new episode of obtaining care becomes more expensive households will cut back on health spending and this will help contain costs.
We think this is roughly true. Evidence shows that making health care more expensive does induce people to consume less of it. But the same evidence shows that people do not cut back only on care that is ineffective or somehow luxurious; instead, they cut back across the board. Expecting sick Americans to decide on the fly in an opaque and uncompetitive marketplace what health care is cost-effective–and what is not–is an unrealistic and unfair approach to containing costs.
While overall costs may be pushed down by the excise tax, this is a good outcome only if one believes that the health care squeezed out is merely the ineffective kind. But a lot of welfare-improving care may also be a casualty, and for some patients, cutting back on medically indicated care because of the increased cost-sharing could increase their overall spending. For example: some patients who cut back on low-cost pills to contain cholesterol end up in emergency rooms.
Disappointing Jobs Numbers and Not Enough Teachers
Today’s Bureau of Labor Statistics employment situation report showed the economy added a disappointing 142,000 jobs in September, bringing average monthly job creation to 198,000 in 2015—a rate slower than 2014. Hope for upward revisions to the low August numbers were dashed as well. In fact, July and August’s numbers were revised downward by a combined 59,000 fewer jobs. Digging into the report, we see that the civilian labor force participation rate declined, the employment-to-population ratio for prime age workers has continued to stagnate, (sitting at 77.2 percent—where it was when the year started), and wage growth is stuck at 2.2 percent. Taken together, these are signs of a labor market that retains a fair amount of slack and evidence that the Federal Reserve was right not to raise interest rates in September and indeed should not raise them in 2015.
With the September data in hand, we can look at the number of teachers who are starting work or going back to school this year. The number of teachers and education staff fell dramatically during the recession, and has failed to get anywhere near its prerecession level, let alone the level that would be required to keep up with an expanding student population. Along with the dismal shortfall in public sector employment, due to the Great Recession and the ensuing austerity at all levels of government, public education jobs are still 236,000 less than they were seven years ago. The number of teachers rose by 41,700 over the last year. While this is clearly a positive sign, adding in the number of public education jobs that should have been created just to keep up with enrollment, we are currently experiencing a 410,000 job shortfall in public education. Short sighted austerity measures have a measurable impact, hitting children in today’s classrooms.
Teacher employment and the number of jobs needed to keep up with enrollment, 2003–2015
| Number of jobs | Jobs needed to keep up with student enrollment | ||
|---|---|---|---|
| 2003-01-01 | 7697400 | ||
| 2003-02-01 | 7697400 | ||
| 2003-03-01 | 7691200 | ||
| 2003-04-01 | 7698500 | ||
| 2003-05-01 | 7695000 | ||
| 2003-06-01 | 7731500 | ||
| 2003-07-01 | 7779100 | ||
| 2003-08-01 | 7725200 | ||
| 2003-09-01 | 7667500 | ||
| 2003-10-01 | 7716500 | ||
| 2003-11-01 | 7702500 | ||
| 2003-12-01 | 7703100 | ||
| 2004-01-01 | 7712000 | ||
| 2004-02-01 | 7719900 | ||
| 2004-03-01 | 7748300 | ||
| 2004-04-01 | 7753800 | ||
| 2004-05-01 | 7776700 | ||
| 2004-06-01 | 7760700 | ||
| 2004-07-01 | 7757500 | ||
| 2004-08-01 | 7766900 | ||
| 2004-09-01 | 7774300 | ||
| 2004-10-01 | 7782800 | ||
| 2004-11-01 | 7797500 | ||
| 2004-12-01 | 7803200 | ||
| 2005-01-01 | 7821900 | ||
| 2005-02-01 | 7831100 | ||
| 2005-03-01 | 7820900 | ||
| 2005-04-01 | 7829400 | ||
| 2005-05-01 | 7840200 | ||
| 2005-06-01 | 7818800 | ||
| 2005-07-01 | 7904700 | ||
| 2005-08-01 | 7907300 | ||
| 2005-09-01 | 7878700 | ||
| 2005-10-01 | 7864600 | ||
| 2005-11-01 | 7875600 | ||
| 2005-12-01 | 7883000 | ||
| 2006-01-01 | 7882200 | ||
| 2006-02-01 | 7886900 | ||
| 2006-03-01 | 7890600 | ||
| 2006-04-01 | 7896100 | ||
| 2006-05-01 | 7883900 | ||
| 2006-06-01 | 7867800 | ||
| 2006-07-01 | 7899900 | ||
| 2006-08-01 | 7935200 | ||
| 2006-09-01 | 7972600 | ||
| 2006-10-01 | 7950200 | ||
| 2006-11-01 | 7954500 | ||
| 2006-12-01 | 7956800 | ||
| 2007-01-01 | 7959800 | ||
| 2007-02-01 | 7953300 | ||
| 2007-03-01 | 7956300 | ||
| 2007-04-01 | 7965400 | ||
| 2007-05-01 | 7974300 | ||
| 2007-06-01 | 7964600 | ||
| 2007-07-01 | 7945700 | ||
| 2007-08-01 | 7991800 | ||
| 2007-09-01 | 8008600 | ||
| 2007-10-01 | 8023000 | ||
| 2007-11-01 | 8034400 | ||
| 2007-12-01 | 8054700 | ||
| 2008-01-01 | 8053500 | ||
| 2008-02-01 | 8064700 | ||
| 2008-03-01 | 8067900 | ||
| 2008-04-01 | 8062000 | ||
| 2008-05-01 | 8078100 | ||
| 2008-06-01 | 8086200 | ||
| 2008-07-01 | 8119400 | ||
| 2008-08-01 | 8091900 | ||
| 2008-09-01 | 8085300 | 8085300 | 8085300 |
| 2008-10-01 | 8089800 | 8087354 | |
| 2008-11-01 | 8082800 | 8089408 | |
| 2008-12-01 | 8083600 | 8091463 | |
| 2009-01-01 | 8084000 | 8093519 | |
| 2009-02-01 | 8096700 | 8095575 | |
| 2009-03-01 | 8093700 | 8097631 | |
| 2009-04-01 | 8091600 | 8099689 | |
| 2009-05-01 | 8088200 | 8101746 | |
| 2009-06-01 | 8108400 | 8103804 | |
| 2009-07-01 | 8066700 | 8105863 | |
| 2009-08-01 | 8061900 | 8107922 | |
| 2009-09-01 | 8012300 | 8109982 | |
| 2009-10-01 | 8073700 | 8112042 | |
| 2009-11-01 | 8099100 | 8114103 | |
| 2009-12-01 | 8071600 | 8116164 | |
| 2010-01-01 | 8068500 | 8118226 | |
| 2010-02-01 | 8057000 | 8120288 | |
| 2010-03-01 | 8058000 | 8122351 | |
| 2010-04-01 | 8056300 | 8124414 | |
| 2010-05-01 | 8062400 | 8126478 | |
| 2010-06-01 | 8048600 | 8128542 | |
| 2010-07-01 | 8026300 | 8130607 | |
| 2010-08-01 | 7997100 | 8132673 | |
| 2010-09-01 | 7919200 | 8134739 | |
| 2010-10-01 | 7963700 | 8136805 | |
| 2010-11-01 | 7961500 | 8138872 | |
| 2010-12-01 | 7953500 | 8140940 | |
| 2011-01-01 | 7948000 | 8143008 | |
| 2011-02-01 | 7930300 | 8145076 | |
| 2011-03-01 | 7927500 | 8147146 | |
| 2011-04-01 | 7939600 | 8149215 | |
| 2011-05-01 | 7897600 | 8151285 | |
| 2011-06-01 | 7925400 | 8153356 | |
| 2011-07-01 | 7866900 | 8155427 | |
| 2011-08-01 | 7845400 | 8157499 | |
| 2011-09-01 | 7793600 | 8159571 | |
| 2011-10-01 | 7829100 | 8161644 | |
| 2011-11-01 | 7815800 | 8163718 | |
| 2011-12-01 | 7807900 | 8165791 | |
| 2012-01-01 | 7801400 | 8167866 | |
| 2012-02-01 | 7805000 | 8169941 | |
| 2012-03-01 | 7796400 | 8172016 | |
| 2012-04-01 | 7773900 | 8174092 | |
| 2012-05-01 | 7772000 | 8176169 | |
| 2012-06-01 | 7740800 | 8178246 | |
| 2012-07-01 | 7774700 | 8180323 | |
| 2012-08-01 | 7794400 | 8182401 | |
| 2012-09-01 | 7764400 | 8184480 | |
| 2012-10-01 | 7757600 | 8186559 | |
| 2012-11-01 | 7751900 | 8188639 | |
| 2012-12-01 | 7774300 | 8190719 | |
| 2013-01-01 | 7775600 | 8192800 | |
| 2013-02-01 | 7776800 | 8194881 | |
| 2013-03-01 | 7773600 | 8196963 | |
| 2013-04-01 | 7758800 | 8199045 | |
| 2013-05-01 | 7773400 | 8201128 | |
| 2013-06-01 | 7737300 | 8203211 | |
| 2013-07-01 | 7763800 | 8205295 | |
| 2013-08-01 | 7801400 | 8207379 | |
| 2013-09-01 | 7777800 | 8209464 | |
| 2013-10-01 | 7776800 | 8211550 | |
| 2013-11-01 | 7779000 | 8213636 | |
| 2013-12-01 | 7763700 | 8215722 | |
| 2014-01-01 | 7765000 | 8217809 | |
| 2014-02-01 | 7765400 | 8219897 | |
| 2014-03-01 | 7769000 | 8221985 | |
| 2014-04-01 | 7781900 | 8224074 | |
| 2014-05-01 | 7774200 | 8226163 | |
| 2014-06-01 | 7786500 | 8228253 | |
| 2014-07-01 | 7799200 | 8230343 | |
| 2014-08-01 | 7804500 | 8232434 | |
| 2014-09-01 | 7807600 | 8234525 | |
| 2014-10-01 | 7799500 | 8236617 | |
| 2014-11-01 | 7797400 | 8238709 | |
| 2014-12-01 | 7796700 | 8240802 | |
| 2015-01-01 | 7797200 | 8242896 | |
| 2015-02-01 | 7791400 | 8244990 | |
| 2015-03-01 | 7790200 | 8247084 | |
| 2015-04-01 | 7784600 | 8249179 | |
| 2015-05-01 | 7789200 | 8251275 | |
| 2015-06-01 | 7810600 | 8253371 | |
| 2015-07-01 | 7829000 | 8255467 | |
| 2015-08-01 | 7849300 | 8257565 | |
| 2015-09-01 | 7849300 | 8259662 | 8085300 |
Source: EPI analysis of Current Employment Statistics public data series and U.S. Department of Education (2014)
What to Watch on Jobs Day: The Teacher Gap, Wages, and Prime-age EPOP
On Friday, the Bureau of Labor Statistics will release the September numbers on the state of the labor market. I will be watching for upward revisions to August’s employment numbers, which came in lower than expected. As usual, I’ll be paying close attention to the prime-age employment-to-population ratio (EPOP) and nominal wages, which are two of the best indicators of labor market health. Friday’s report will also give us a chance to examine the “teacher gap”— the gap between actual local public education employment and what is needed to keep up with growth in the student population
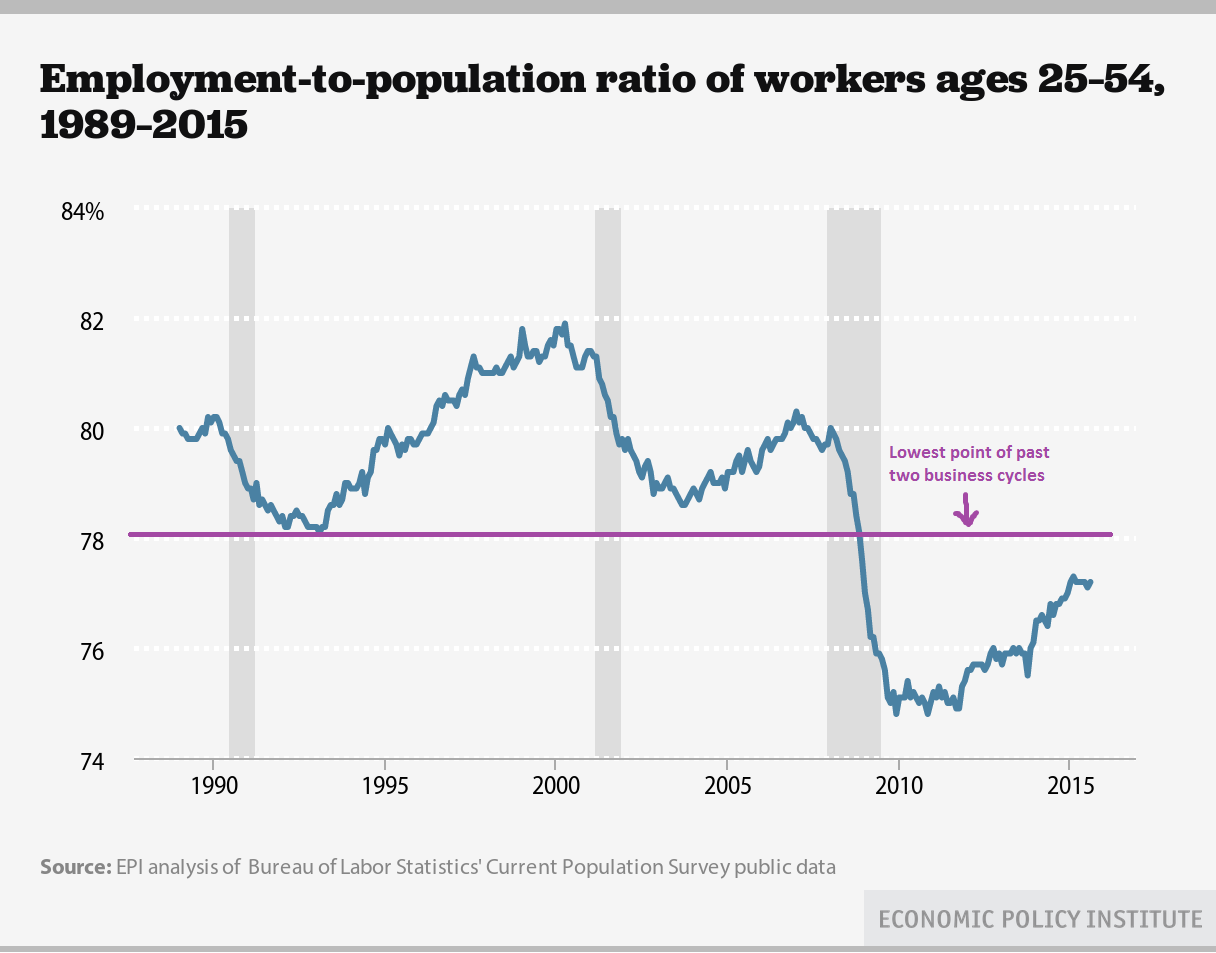
Prime-age EPOP—the share of the working age population who is actually working—fell dramatically during the Great Recession. It saw some solid increases once the recovery began to take hold, but unfortunately remains below the lowest point of the past two business cycles and has stagnated for much of this year, as job growth has only been fast enough to keep up with the growth of the working age population. Before we can say that the labor market is truly back to normal, we need to see faster job growth—to employ new labor market entrants, unemployed workers, and the 3+ million missing workers who have left or never entered the labor market because of weak job opportunities.
New Scandals Revealed by the New York Times: How the H-1B Visa is Used to Ship American Jobs Overseas
The New York Times has a front page story today about three new cases of H-1B abuse as a follow-up to the Disney scandal it reported on in June. This one, too, features household names: Toys R Us and New York Life. It also includes academic publishing powerhouse, Cengage, whose textbooks are used in college campuses across the country. Those companies have been outsourcing work to companies with track records as major H-1B abusers that use the program to ship jobs overseas: Accenture, TCS, and Cognizant.
The Times story, written by Julia Preston, outlines a process I have written quite a bit about over the years: how the H-1B program, which Congress created to help U.S. companies fill jobs here in the United States, is actually used to facilitate the shipping of American jobs overseas to low-cost countries like India. This, in fact, is the most common use of the H-1B program, which India’s Commerce Minister Kamal Nath dubbed the “outsourcing visa” in 2007.
Preston reports that Tata Consultancy Services sent Indian workers to a Toys R Us facility in New Jersey, where they shadowed U.S. accounting employees, learning their jobs and writing up manuals to train employees back in India how to do the same work and replace the U.S. employees. The result was unemployment for middle-class, middle-aged Americans and the loss of 67 jobs in New Jersey. A company spokesperson was unapologetic, telling the Times that the outsourcing “resulted in significant cost savings.”
The Case Against Raising Interest Rates Before Wage Growth Picks Up
This piece originally appeared in the Wall Street Journal’s Think Tank blog.
I’ve been arguing for the past year that until nominal wage growth picks up considerably, the Federal Reserve has little to fear about price inflation being pushed above its 2 percent target. The logic of focusing on wage growth is pretty easy to explain.
First, note that nominal (i.e., not inflation-adjusted) wage growth can rise as fast as economy-wide productivity without putting any upward pressure on prices. Say that both nominal wages and productivity rose 2 perecnt in a year. What would happen to the cost per unit of output? It would not rise at all. Hourly wages would climb 2 percent, but the amount produced in each hour of work—the definition of productivity—would also rise by 2 percent, so costs per unit of output (or, prices) would not budge. If we assume that trend productivity growth in the U.S. economy is roughly 1.5 percent per year, this means that only nominal wage growth faster than 1.5 percent puts any upward pressure on prices.
Now, the Fed isn’t committed to zero upward pressure on prices. Fed officials say they’re comfortable with 2 percent inflation. (I’d argue that they should be comfortable with inflation well above that, up to 5 percent, but we’ll take their target for now.) This price target means that nominal wage growth can be 2 percent higher than trend productivity growth before wages threaten to push inflation over the Fed’s target. We would need to see nominal wage growth of 3.5 percent, substantially higher than what it has been since the recovery began, before labor costs start threatening to push inflation beyond the Fed’s comfort zone. (There is a handy nominal wage tracker on the Economic Policy Institute’s website that covers a lot of this ground.)
All that said, in a speech last week, Federal Reserve Chairwoman Janet Yellen included a footnote that argued against the relevance of wage targeting. The upshot was this sentence: “More generally, movements in labor costs no longer appear to be an especially good guide to future price movements.” This footnote reinforced other recent statements from Dr. Yellen that seem to leave the door open to the Fed tightening well before any increase in nominal wages shows up in the data. I would argue that this is almost exactly wrong.