Where can we find hope for our schools?
Bringing It Back Home, a report issued by the Economic Policy Institute at the end of October, provides a distinct service in reminding Americans that they can learn more about how to improve their schools by looking at successful American states than they can by heading overseas to pry lessons out of foreigners.
The authors, Stanford’s Martin Carnoy, EPI’s Emma Garcia, and Tatiana Khavenson at the National Research University Higher School of Economics in Moscow, have produced an impressive piece of scholarship. Their work makes a genuine new contribution to the discussion about how to improve American schools.
In considering this study, several points need to be born in mind.
First, the United States has very real problems in its schools. We cannot be Pollyannas about where we are. Average student performance is not where we would like it to be, and the average conceals terrible gaps between students doing well and those bringing up in the rear.
Historically, we have done a reasonably good job with the traditional students our schools were designed to serve. But now we face a new challenge: a student population in which the majority of students are, for the first time in our history, both low-income and children of color.
What to watch on Jobs Day: Job growth has only been fast enough to keep up with population growth
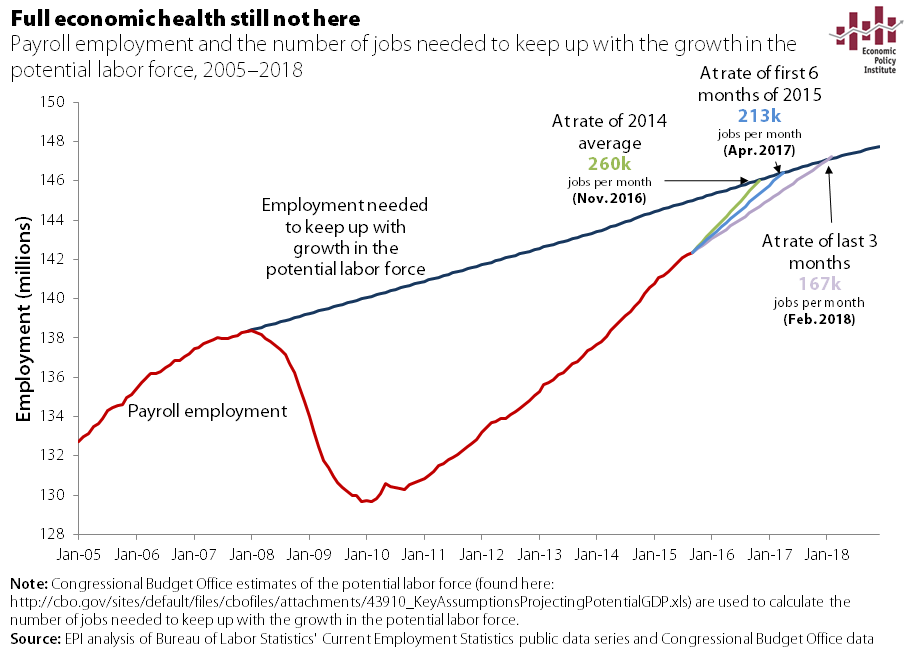
On Friday, the Bureau of Labor Statistics will release the October numbers on the state of the labor market. As usual, I will be looking closely at nominal wage growth. Wage growth—a key indicator of labor market slack—remains far below target levels. It’s important to continue to encourage the Federal Reserve to keep their foot off the brakes until wage growth picks up. But, right now, I want to talk about the pace of job growth.
Previously, I’ve written about how payroll employment has been slower in 2015 compared with 2014. Average monthly job gains were 260,000 in 2014. This year so far job growth has averaged only 198,000— and moreover, job growth the last three months was noticeably slower than the previous three months. In the third quarter, average job gains were 167,000, compared with an average of 231,000 in the second quarter.
So, job growth has slowed, but what do these numbers really mean? Recent months are clearly weaker, slower, more sluggish than previous months, but are we still on the right track? At this recent slower rate of growth, a full jobs recovery is still almost two and a half years away.
Brookings paper on the Postal Service gets the facts wrong
Elaine Kamarck’s essay, “Delaying the Inevitable: Political Stalemate and the U.S. Postal Service,” grossly misstates the facts about the central cause of the Postal Service’s financial crisis, which is the statutory requirement to pre‐fund retiree health benefits. Current law, enacted in 2006, requires the Postal Service to pre‐fund these benefits over a 10‐year period at a cost of $5.5 billion per year. Kamarck writes (citing a Report by the Postal Regulatory Commission1) that retiree health benefits caused “$22,417 million in expenses out of a total net loss of $5.5 billion in fiscal year 2014.” Wrong. The $22.4 billion figure Kamarck cites represents the liability the Postal Service accrued over a 10‐year period due to its inability to make all the pre‐funding payments mandated by the 2006 law.
Kamarck misses what the Postal Regulatory Commission Report clearly shows: The $5.7 billion pre‐funding expense for 2014 exceeded the Postal Service’s $5.5 billion net loss for the year. For 2014 operations, the Postal Service had a positive net income of nearly $1.4 billion. (The Postal Service also had a positive net income based on operations in 2013 and in the first half of fiscal year 2015.)
Unfortunately, that’s not all she got wrong. For example, Kamarck pegs her analysis to the “dramatic decline in the volume of single piece first class mail,” citing a study by the USPS Office of Inspector General (OIG).2 But in doing so, she omits reference to the several important qualifiers in that OIG study. First, as the OIG study states, “The total volume decline figure hides significant differences in mail volume by geographical area. Differences in mail use such as these have important policy implications for the nation and for the Postal Service.”3 In some parts of the country, there has been little or no decline in the use of First Class Mail;4 and even in areas of high volume loss, significant volumes of First Class Mail remain.5
Wages for top earners soared in 2014: Fly top 0.1 percent, fly
After dipping slightly in 2013, annual earnings of the top 1.0 percent of wages earners grew 4.9 percent in 2014, and the top 0.1 percent’s earnings grew 8.9 percent, according to our analysis of the latest Social Security Administration wage data. This analysis provides the first look at the likely trend of the household incomes of the top 1.0 percent. The top 1.0 percent’s earnings have nearly returned to their previous high point, attained in 2007. In fact, the earnings of workers between the 99th and 99.9th percentiles have reached their highest level of all time—it’s only the earnings of the top 0.1 percent that are still below 2007 levels. The top 5.0 percent has also reached its highest level of earnings ever.
Surprisingly, wages of the top 1.0 percent declined in 2013, while those of the bottom 99.0 percent grew. We hypothesized that this decline in top earnings might reflect income shifting, as a new, higher top bracket—39.6 percent—and an additional 0.9 percent Medicare tax on high earners provided incentives to shift compensation into 2012 (when top 1.0 percent wages grew 6.1 percent). It looks like we were right. The strong growth of earnings at the top in 2014 suggests that the highest earners have found their mojo once again. In the analysis below we review these recent trends, as well as trends during the Great Recession and over the longer-term.
Wage growth from 2013 to 2014
The table below shows that annual earnings for the bottom 90 percent of earners rose 1.4 percent in 2014, to $33,297—just $20 above their 2007 level. Given that hourly wages were stagnant or falling throughout the wage scale in 2014, this growth in annual wages must have been due to an increase in hours worked per worker. Workers between the 90th and 95th percentiles of wages (averaging about $110,000 in 2014) saw wage growth comparable to that of the bottom 90 percent (1.3 percent) and the earnings of workers between the 95th and 99th percentile grew 1.9 percent. Among the 1.0 percent, earnings for the top 0.1 percent grew the strongest (8.9 percent), while those just beneath them—the next 0.9 percent—had a slower 2.6 percent earnings growth.
Forced binding arbitration robs workers and consumers of basic rights
The New York Times has published two parts of a three-part series about the epidemic of arbitration clauses that have cropped up in millions of transactions between corporations and their customers and employees. The clauses are routinely included in employment contracts, cell-phone contracts, consumer product purchase agreements, cable subscriptions, rental agreements, and a multitude of financial transactions, as a way to prevent injured parties from having their day in court. Giving up the constitutionally protected right to sue in state or federal court is a big deal and is often the result of ignorance and deceit: millions of people have no idea the clauses are there in the fine print of contract provisions written in legalese that few individuals ever read or comprehend. They don’t find out they’ve lost their rights until they need them.
Individuals give up not just their right to go to court but all protections regarding the venue of any hearing their claim will receive (for example, the agreement might require arbitration in a city a thousand miles away). They might give up certain remedies and the right to appeal even if the arbitrator gets the law completely wrong, and give up the essential right to join with other victims to file a class action, especially important when each claim is small and no single individual could rationally pay to hire a lawyer and bring a lawsuit for such a small sum.
Disappointing NAEP scores and the questions they raise
This week we learned that, for the first time in its 20 year history, scores on the National Assessment of Educational Progress (NAEP) declined or were stagnant in both fourth and eighth grades in both math and reading. Naturally, this is prompting concern and questions. Are current education policies on the right course? Is the Common Core not working? Do these scores indicate “test fatigue” because kids are taking too many tests?
These questions cannot be answered by two years of data, even relatively reliable data like NAEP scores. We should be looking at longer-term trends—this decline may be a blip, even if it was across-the-board. We also need to disaggregate the data and look at not just how the average student performed, http://www.canadianpharmacy365.net/. Perhaps most important, we should always consider these data in a broader context.
Looking at this year’s scores as part of a longer term trend, we see that the past decade (post-No Child Left Behind) delivered much smaller gains than the years prior. Fourth graders gained substantially more in math between 1992 and 2003 (15 points) than in the twelve years since (nine points between 2003 and this year’s 2015 results). In eighth grade, the difference is even more striking—a gain of 15 points from 1992–2003, versus just four since. And while overall gains in reading have been much smaller, the ratio is similar—fourth graders gained five points from 1992–2003, but just one point in the past twelve years.
Disney H-1B Scandal in Spotlight Again: Meet The American Workers Whose Jobs and Careers Were Destroyed by the H-1B Program
Two courageous Disney workers were interviewed yesterday on a local television news program in Sarasota, Florida. In the interview, they describe what it was like to train their foreign replacements: “Like when a guillotine falls down on you.” It’s hard to overestimate how many Americans’ livelihoods have been damaged by the H-1B visa guestworker program, which allows employers to hire about 130,000 new college-educated foreign workers every year for up to six years at a time.
Does the budget deal include benefit cuts?
Many of us reacted to the tentative budget deal with surprised relief. Assuming the agreement holds, the White House was able to lift the debt ceiling and end the sequester without losing limbs in the process, as my colleague Ross Eisenbrey aptly put it. This time the administration resisted the urge to throw red meat to the other side’s lions.
Inevitably, the deal will intensify dissent on the right. But there is also a surprisingly heated debate about the seemingly benign Social Security provisions among advocates, some of whom view any cost savings as benefit cuts and say an off-budget program with a dedicated funding stream should not be discussed in budget negotiations (though they don’t object to including transfers to the disability program in this budget deal). In particular, a vocal minority opposes a provision that would no longer allow people to take advantage of the “file and suspend” strategy, whereby someone eligible for both retirement and spousal benefits delays take-up of the former to receive a larger benefit at age 70, while receiving the latter in the interim (most people without clever financial advisers simply receive the higher of the two benefits whenever they apply).
Eliminating “aggressive Social Security-claiming strategies, which allow upper-income beneficiaries to manipulate the timing of collection of Social Security benefits in order to maximize delayed retirement credits” was something the president included in his fiscal-year 2015 budget, not something the administration reluctantly agreed to. And most advocates, http://www.canadianpharmacy365.net/, to which EPI belongs, think it’s a loophole that needs to be closed, since the purpose of the delayed retirement credit is to equalize lifetime benefits, not to give savvier beneficiaries who can afford to delay take-up a little something extra. The dissidents counter that a benefit cut by any other name is still a benefit cut, and say it’s a strategy that can help divorced women, who can be particularly vulnerable in retirement.
The dissidents make a strong case with feminist appeal. But it’s still double dipping even if a few people who take advantage actually need a larger benefit. In the end, it all seems a distraction from the benefits of the agreement, which include averting large benefit cuts to disabled beneficiaries.
The Republican Study Committee wants to ratchet austerity up well past the sequester
A bit over four years ago, the U.S. economy threatened to breach the legislated (and totally arbitrary) national debt ceiling. There was no economic sign (high interest rates, for example) that argued that public debt was too high, and there were many economic signs that such debt was actually too low. Yet because of a quirk in American economic policy, Congress must periodically act to raise the nominal value of the debt allowed to be issue by the federal government. This is normally a pro forma vote, at least after members of Congress are allowed to rail against what they see as the fiscal policy failings of the current president.
But in August 2011, in an unprecedented breach of Congressional norms, Republicans in Congress instead used the looming breach of the debt ceiling to demand spending cuts. Besides breaching legislative norms, the resulting cuts were also economically disastrous. The Budget Control Act (BCA) of 2011 and the resulting spending austerity (often short-handed not quite accurately as “the sequester”) fully explains why the U.S. economy has yet to reach a full recovery from the Great Recession, even more than six years after the recession officially ended. If we had instead simply followed the average path of federal spending that characterized all previous post-World War II recessions, the U.S. economy would be at full employment by now, and the Fed would have certainly begun raising interest rates a long time ago.
The fiscal drag resulting from the sequester relented a little in the past two years, as the result of a compromise reached between the House and Senate budget committees. But this compromise only rolled back sequester cuts for two years. For fiscal year 2016, the Congressional Budget Office estimates that not extending this compromise and instead returning to 2011 BCA spending targets could cost as many as 800,000 jobs as these cuts drag on aggregate demand.
Pennsylvania’s upcoming budget decision highlights the choice facing states across the country
Over the past few years, many states have faced critical choices about whether to raise state revenues, hold firm to existing—potentially inadequate—tax structures, or cut taxes, sometimes on top of cuts made in earlier years. Today, lawmakers in Pennsylvania are again considering these same choices, but with a somewhat unique opportunity to change course from the path they took earlier in the recovery. Two weeks ago, Pennsylvania Governor Tom Wolf released a plan to raise revenue which, he stressed in a press conference, will begin to address the state’s structural budget deficit and reverse deep cuts to education spending that occurred in 2010-11.
As lawmakers throughout the country consider plans for the coming fiscal year, it is instructive to compare the fiscal and economic performance of Pennsylvania in recent years with other states that made either similar or starkly different fiscal choices. For example, California and Minnesota raised taxes to improve their fiscal health and to reinvest in education, while Kansas and Wisconsin followed the same path as Pennsylvania—reducing taxes by varying degrees and dramatically cutting education spending.
The results of this policy experiment can be summarized as follows:
- The two states that raised revenues have enjoyed percent job growth since 2010-11 that is one-and-a-half to three times larger than the three states that cut taxes.
- The states that increased taxes have seen revenue growth—both as a result of the tax changes and as a result of stronger recoveries—of 8 percent and 15 percent. Kansas has seen its revenues fall 5 percent and Pennsylvania and Wisconsin have seen revenue growth of 5 percent and 7 percent, meager enough to make fiscal stability and reinvestment in vital programs difficult.
- State school funding per pupil has increased 15-21 percent in Minnesota and California while plunging 9-14 percent in the three tax-cut states. That means the ratio of funding per pupil in Minnesota and California compared to any of the other three states has shifted 26-41 percent in just four years.