Friedrichs case threatens to push down wages for workers beyond the public sector
The Supreme Court heard oral arguments yesterday in Friedrichs v. California Teachers Association, a case that could profoundly affect the economy and the ability of millions of workers to improve their wages and working conditions. Friedrichs challenges the right of a majority of workers, through their democratically elected union, to bargain a contract with their public employer that makes every employee covered by the contract pay her fair share of the costs of negotiating it, administering it, and enforcing it in the courts or in arbitration. By preventing “free riders,” fair share clauses help ensure the viability of the union and the collective bargaining relationship.
What the fair share requirements (also known as “agency shop” provisions) don’t do is equally important to understand. They don’t require anyone to join the union—the law has been clear for decades that no one can be forced to join a union. And fair share provisions don’t require anyone to contribute to union political activity or advocacy on issues unrelated to collective bargaining.
Nevertheless, anti-union groups and the complaining teachers claim that it is unconstitutional for a public employer such as a state or county to make unwilling employees pay their fair share of bargaining costs. They claim a First Amendment right to accept the higher wages and benefits that come with the union contract without having to pay anything to support the union that won that contract. Alarmingly, a majority of the Supreme Court justices appear to agree, even though it means overturning Supreme Court precedent that is less than 40 years old. That case, Abood v. Detroit Board of Education, held that the interests of the government in having a single, stable collective bargaining partner outweighed the right of dissenting employees not to associate with the union and help pay for bargaining and administering the employment contract:
“The governmental interests advanced by the agency-shop provision in the Michigan statute are much the same as those promoted by similar provisions in federal labor law. The confusion and conflict that could arise if rival teachers’ unions, holding quite different views as to the proper class hours, class sizes, holidays, tenure provisions, and grievance procedures, each sought to obtain the employer’s agreement, are no different in kind from the evils that the exclusivity rule in the Railway Labor Act was designed to avoid. See Madison School Dist. v. Wisconsin Employment Relations Comm’n, 429 U.S. 167, 178, 97 S.Ct. 421, 425, 50 L.Ed.2d 376 (Brennan, J., concurring in judgment). The desirability of labor peace is no less important in the public sector, nor is the risk of “free riders” any smaller.”
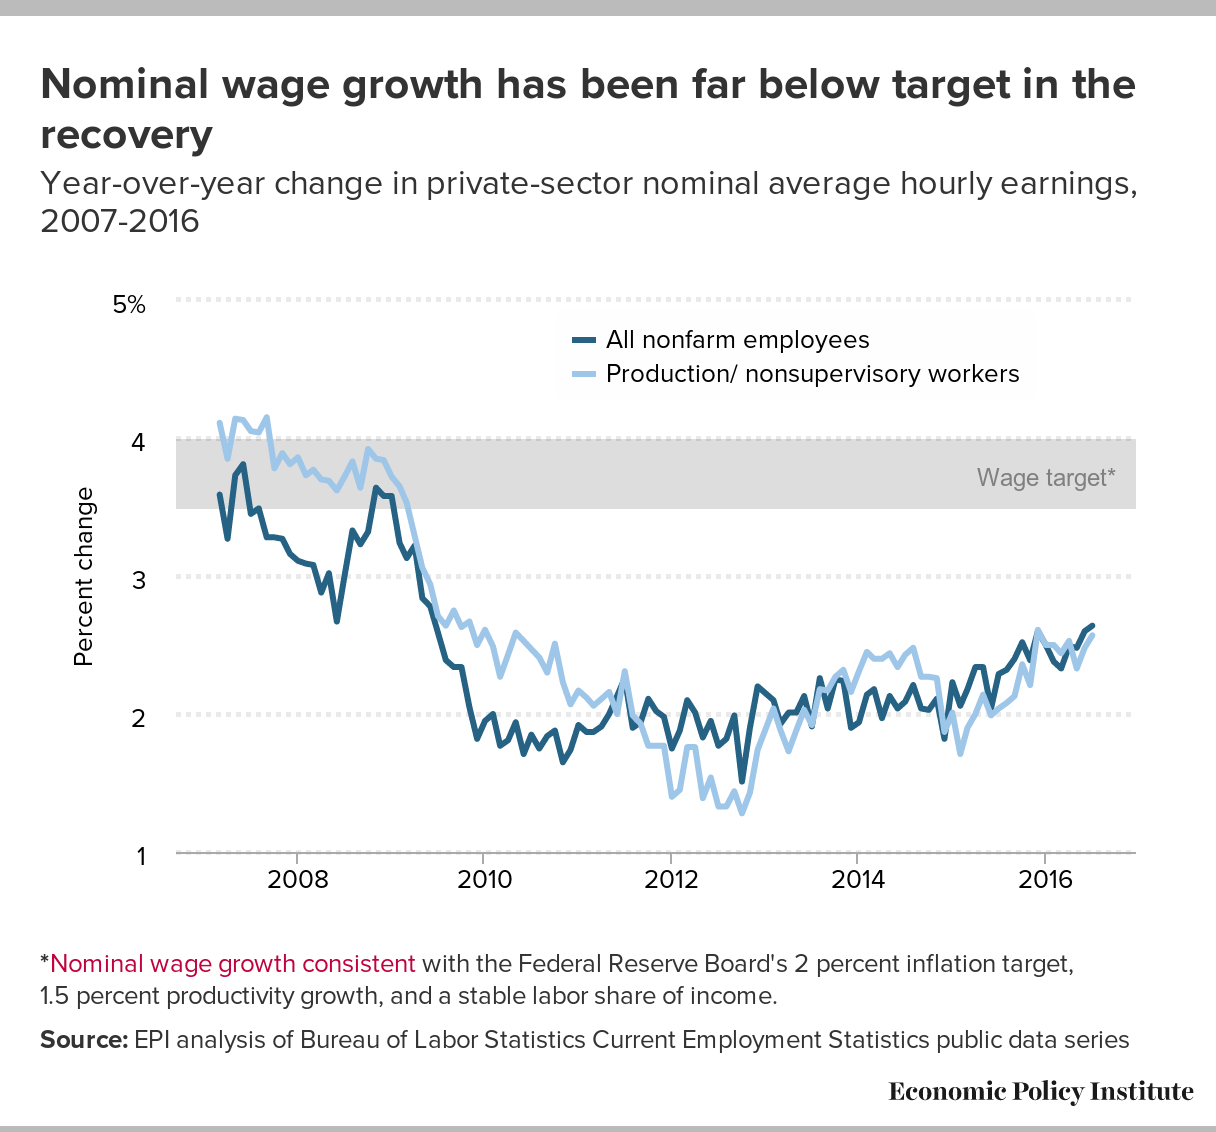
The road to full employment is long, but we are moving in the right direction
The labor market ended the year on a positive note, adding an additional 292,000 jobs in December. Of course, all economic woes are not solved. It’s clear from the data that we are still far from a full employment economy. Notably, wage growth is still not where it ought to be, and the prime-age employment-to-population ratio is barely half-way back to its 2007 level, which was not a banner year for full employment to begin with.
The Job Openings and Labor Turnover Survey (JOLTS) data released this morning provide further evidence that the economy is chugging along, but has a ways to go before the labor market is fully recovered. While my favorite indicators to watch on jobs day are nominal wage growth and the prime-age employment-to-population ratio, my favorite indicator on JOLTS day is the quits rate. There are three key lines in the graph below: the hires rate, the quits rate, and the layoffs rate.
Hires, quits, and layoff rates, 2000-2015
| Month | Hires rate | Layoffs rate | Quits rate |
|---|---|---|---|
| Dec-2000 | 4.100000 | 1.400000 | 2.300000 |
| Jan-2001 | 4.400000 | 1.600000 | 2.600000 |
| Feb-2001 | 4.100000 | 1.400000 | 2.500000 |
| Mar-2001 | 4.200000 | 1.600000 | 2.400000 |
| Apr-2001 | 4.000000 | 1.500000 | 2.400000 |
| May-2001 | 4.000000 | 1.500000 | 2.400000 |
| Jun-2001 | 3.800000 | 1.500000 | 2.300000 |
| Jul-2001 | 3.900000 | 1.500000 | 2.200000 |
| Aug-2001 | 3.800000 | 1.400000 | 2.100000 |
| Sep-2001 | 3.800000 | 1.600000 | 2.100000 |
| Oct-2001 | 3.800000 | 1.700000 | 2.200000 |
| Nov-2001 | 3.700000 | 1.600000 | 2.000000 |
| Dec-2001 | 3.700000 | 1.400000 | 2.000000 |
| Jan-2002 | 3.700000 | 1.400000 | 2.200000 |
| Feb-2002 | 3.700000 | 1.500000 | 2.000000 |
| Mar-2002 | 3.500000 | 1.400000 | 1.900000 |
| Apr-2002 | 3.800000 | 1.500000 | 2.100000 |
| May-2002 | 3.800000 | 1.500000 | 2.100000 |
| Jun-2002 | 3.700000 | 1.400000 | 2.000000 |
| Jul-2002 | 3.800000 | 1.500000 | 2.100000 |
| Aug-2002 | 3.700000 | 1.400000 | 2.000000 |
| Sep-2002 | 3.700000 | 1.400000 | 2.000000 |
| Oct-2002 | 3.700000 | 1.400000 | 2.000000 |
| Nov-2002 | 3.800000 | 1.500000 | 1.900000 |
| Dec-2002 | 3.800000 | 1.500000 | 2.000000 |
| Jan-2003 | 3.800000 | 1.500000 | 1.900000 |
| Feb-2003 | 3.600000 | 1.500000 | 1.900000 |
| Mar-2003 | 3.400000 | 1.400000 | 1.900000 |
| Apr-2003 | 3.600000 | 1.600000 | 1.800000 |
| May-2003 | 3.500000 | 1.500000 | 1.800000 |
| Jun-2003 | 3.700000 | 1.600000 | 1.800000 |
| Jul-2003 | 3.600000 | 1.600000 | 1.800000 |
| Aug-2003 | 3.600000 | 1.500000 | 1.800000 |
| Sep-2003 | 3.700000 | 1.500000 | 1.900000 |
| Oct-2003 | 3.800000 | 1.400000 | 1.900000 |
| Nov-2003 | 3.600000 | 1.400000 | 1.900000 |
| Dec-2003 | 3.800000 | 1.500000 | 1.900000 |
| Jan-2004 | 3.700000 | 1.500000 | 1.900000 |
| Feb-2004 | 3.600000 | 1.400000 | 1.900000 |
| Mar-2004 | 3.900000 | 1.400000 | 2.000000 |
| Apr-2004 | 3.900000 | 1.500000 | 2.000000 |
| May-2004 | 3.800000 | 1.400000 | 1.900000 |
| Jun-2004 | 3.800000 | 1.400000 | 2.000000 |
| Jul-2004 | 3.700000 | 1.400000 | 2.000000 |
| Aug-2004 | 3.900000 | 1.500000 | 2.000000 |
| Sep-2004 | 3.800000 | 1.400000 | 2.000000 |
| Oct-2004 | 3.900000 | 1.400000 | 2.000000 |
| Nov-2004 | 3.900000 | 1.500000 | 2.100000 |
| Dec-2004 | 4.000000 | 1.500000 | 2.100000 |
| Jan-2005 | 3.900000 | 1.400000 | 2.100000 |
| Feb-2005 | 3.900000 | 1.400000 | 2.000000 |
| Mar-2005 | 3.900000 | 1.500000 | 2.100000 |
| Apr-2005 | 4.000000 | 1.400000 | 2.100000 |
| May-2005 | 3.900000 | 1.400000 | 2.100000 |
| Jun-2005 | 3.900000 | 1.500000 | 2.100000 |
| Jul-2005 | 3.900000 | 1.400000 | 2.000000 |
| Aug-2005 | 4.000000 | 1.400000 | 2.200000 |
| Sep-2005 | 4.000000 | 1.400000 | 2.300000 |
| Oct-2005 | 3.800000 | 1.300000 | 2.200000 |
| Nov-2005 | 3.900000 | 1.200000 | 2.200000 |
| Dec-2005 | 3.700000 | 1.300000 | 2.100000 |
| Jan-2006 | 3.900000 | 1.300000 | 2.100000 |
| Feb-2006 | 3.900000 | 1.300000 | 2.200000 |
| Mar-2006 | 3.900000 | 1.200000 | 2.200000 |
| Apr-2006 | 3.800000 | 1.300000 | 2.100000 |
| May-2006 | 4.000000 | 1.400000 | 2.200000 |
| Jun-2006 | 3.900000 | 1.200000 | 2.200000 |
| Jul-2006 | 3.900000 | 1.300000 | 2.200000 |
| Aug-2006 | 3.800000 | 1.200000 | 2.200000 |
| Sep-2006 | 3.800000 | 1.300000 | 2.100000 |
| Oct-2006 | 3.800000 | 1.300000 | 2.100000 |
| Nov-2006 | 4.000000 | 1.300000 | 2.300000 |
| Dec-2006 | 3.800000 | 1.300000 | 2.200000 |
| Jan-2007 | 3.800000 | 1.200000 | 2.200000 |
| Feb-2007 | 3.800000 | 1.300000 | 2.200000 |
| Mar-2007 | 3.800000 | 1.300000 | 2.200000 |
| Apr-2007 | 3.700000 | 1.300000 | 2.100000 |
| May-2007 | 3.800000 | 1.300000 | 2.200000 |
| Jun-2007 | 3.800000 | 1.300000 | 2.000000 |
| Jul-2007 | 3.700000 | 1.300000 | 2.100000 |
| Aug-2007 | 3.700000 | 1.300000 | 2.100000 |
| Sep-2007 | 3.700000 | 1.500000 | 1.900000 |
| Oct-2007 | 3.800000 | 1.400000 | 2.100000 |
| Nov-2007 | 3.700000 | 1.400000 | 2.000000 |
| Dec-2007 | 3.600000 | 1.300000 | 2.000000 |
| Jan-2008 | 3.500000 | 1.300000 | 2.000000 |
| Feb-2008 | 3.500000 | 1.400000 | 2.000000 |
| Mar-2008 | 3.400000 | 1.300000 | 1.900000 |
| Apr-2008 | 3.500000 | 1.300000 | 2.100000 |
| May-2008 | 3.300000 | 1.300000 | 1.900000 |
| Jun-2008 | 3.500000 | 1.500000 | 1.900000 |
| Jul-2008 | 3.300000 | 1.400000 | 1.800000 |
| Aug-2008 | 3.300000 | 1.600000 | 1.700000 |
| Sep-2008 | 3.100000 | 1.400000 | 1.800000 |
| Oct-2008 | 3.300000 | 1.600000 | 1.800000 |
| Nov-2008 | 2.900000 | 1.600000 | 1.500000 |
| Dec-2008 | 3.200000 | 1.800000 | 1.600000 |
| Jan-2009 | 3.100000 | 1.900000 | 1.500000 |
| Feb-2009 | 3.000000 | 1.900000 | 1.500000 |
| Mar-2009 | 2.800000 | 1.800000 | 1.400000 |
| Apr-2009 | 2.900000 | 2.000000 | 1.300000 |
| May-2009 | 2.800000 | 1.600000 | 1.300000 |
| Jun-2009 | 2.800000 | 1.600000 | 1.300000 |
| Jul-2009 | 2.900000 | 1.700000 | 1.300000 |
| Aug-2009 | 2.900000 | 1.600000 | 1.300000 |
| Sep-2009 | 3.000000 | 1.600000 | 1.300000 |
| Oct-2009 | 2.900000 | 1.500000 | 1.300000 |
| Nov-2009 | 3.100000 | 1.400000 | 1.400000 |
| Dec-2009 | 2.900000 | 1.500000 | 1.300000 |
| Jan-2010 | 3.000000 | 1.400000 | 1.300000 |
| Feb-2010 | 2.900000 | 1.400000 | 1.300000 |
| Mar-2010 | 3.200000 | 1.400000 | 1.400000 |
| Apr-2010 | 3.100000 | 1.300000 | 1.500000 |
| May-2010 | 3.300000 | 1.300000 | 1.400000 |
| Jun-2010 | 3.100000 | 1.500000 | 1.500000 |
| Jul-2010 | 3.200000 | 1.600000 | 1.400000 |
| Aug-2010 | 3.000000 | 1.400000 | 1.400000 |
| Sep-2010 | 3.100000 | 1.400000 | 1.500000 |
| Oct-2010 | 3.100000 | 1.300000 | 1.400000 |
| Nov-2010 | 3.100000 | 1.400000 | 1.400000 |
| Dec-2010 | 3.200000 | 1.400000 | 1.500000 |
| Jan-2011 | 3.000000 | 1.300000 | 1.400000 |
| Feb-2011 | 3.100000 | 1.300000 | 1.400000 |
| Mar-2011 | 3.300000 | 1.300000 | 1.500000 |
| Apr-2011 | 3.200000 | 1.300000 | 1.500000 |
| May-2011 | 3.100000 | 1.300000 | 1.500000 |
| Jun-2011 | 3.300000 | 1.400000 | 1.500000 |
| Jul-2011 | 3.200000 | 1.300000 | 1.500000 |
| Aug-2011 | 3.200000 | 1.300000 | 1.500000 |
| Sep-2011 | 3.300000 | 1.300000 | 1.500000 |
| Oct-2011 | 3.200000 | 1.300000 | 1.500000 |
| Nov-2011 | 3.200000 | 1.300000 | 1.500000 |
| Dec-2011 | 3.200000 | 1.300000 | 1.500000 |
| Jan-2012 | 3.200000 | 1.300000 | 1.500000 |
| Feb-2012 | 3.300000 | 1.300000 | 1.600000 |
| Mar-2012 | 3.300000 | 1.300000 | 1.600000 |
| Apr-2012 | 3.200000 | 1.400000 | 1.600000 |
| May-2012 | 3.300000 | 1.400000 | 1.600000 |
| Jun-2012 | 3.200000 | 1.300000 | 1.600000 |
| Jul-2012 | 3.200000 | 1.200000 | 1.600000 |
| Aug-2012 | 3.300000 | 1.400000 | 1.600000 |
| Sep-2012 | 3.100000 | 1.300000 | 1.400000 |
| Oct-2012 | 3.200000 | 1.300000 | 1.500000 |
| Nov-2012 | 3.300000 | 1.300000 | 1.600000 |
| Dec-2012 | 3.200000 | 1.100000 | 1.600000 |
| Jan-2013 | 3.300000 | 1.200000 | 1.700000 |
| Feb-2013 | 3.400000 | 1.200000 | 1.700000 |
| Mar-2013 | 3.200000 | 1.300000 | 1.500000 |
| Apr-2013 | 3.300000 | 1.300000 | 1.700000 |
| May-2013 | 3.300000 | 1.300000 | 1.600000 |
| Jun-2013 | 3.200000 | 1.200000 | 1.600000 |
| Jul-2013 | 3.300000 | 1.200000 | 1.700000 |
| Aug-2013 | 3.400000 | 1.200000 | 1.700000 |
| Sep-2013 | 3.400000 | 1.300000 | 1.700000 |
| Oct-2013 | 3.300000 | 1.100000 | 1.800000 |
| Nov-2013 | 3.400000 | 1.100000 | 1.800000 |
| Dec-2013 | 3.300000 | 1.200000 | 1.700000 |
| Jan-2014 | 3.300000 | 1.300000 | 1.700000 |
| Feb-2014 | 3.400000 | 1.200000 | 1.800000 |
| Mar-2014 | 3.400000 | 1.200000 | 1.800000 |
| Apr-2014 | 3.500000 | 1.200000 | 1.700000 |
| May-2014 | 3.500000 | 1.200000 | 1.800000 |
| Jun-2014 | 3.500000 | 1.200000 | 1.800000 |
| Jul-2014 | 3.600000 | 1.300000 | 1.800000 |
| Aug-2014 | 3.400000 | 1.200000 | 1.800000 |
| Sep-2014 | 3.600000 | 1.200000 | 2.000000 |
| Oct-2014 | 3.700000 | 1.200000 | 2.000000 |
| Nov-2014 | 3.600000 | 1.100000 | 1.900000 |
| Dec-2014 | 3.700000 | 1.200000 | 1.900000 |
| Jan-2015 | 3.500000 | 1.200000 | 2.000000 |
| Feb-2015 | 3.600000 | 1.200000 | 1.900000 |
| Mar-2015 | 3.600000 | 1.300000 | 2.000000 |
| Apr-2015 | 3.600000 | 1.300000 | 1.900000 |
| May-2015 | 3.600000 | 1.200000 | 1.900000 |
| Jun-2015 | 3.700000 | 1.300000 | 1.900000 |
| Jul-2015 | 3.600000 | 1.200000 | 1.900000 |
| Aug-2015 | 3.600000 | 1.200000 | 1.900000 |
| Sep-2015 | 3.600000 | 1.300000 | 1.900000 |
| Oct-2015 | 3.600000 | 1.200000 | 2.000000 |
| Nov-2015 | 3.600000 | 1.200000 | 2.000000 |

Note: Shaded areas denote recessions. The hires rate is the number of hires during the entire month as a percent of total employment. The layoff rate is the number of layoffs and discharges during the entire month as a percent of total employment. The quits rate is the number of quits during the entire month as a percent of total employment.
Source: EPI analysis of Bureau of Labor Statistics Job Openings and Labor Turnover Survey
National Association of Manufacturers’ criticisms of the Obama overtime proposal all miss their mark
Last September, the National Association of Manufacturers (NAM) filed comments in opposition to the Labor Department’s proposed rule on overtime pay for salaried workers, which would raise the salary threshold under which all workers are eligible for overtime pay from $23,660 to $50,440. NAM’s chief criticism boils down to this: “The Labor Department set the salary level threshold for exemption too high.” The evidence NAM presents to support that criticism, however, is inaccurate, irrelevant, or contradicts its claims.
First, NAM claims, “The proposed salary threshold is grossly out of step with nearly 80 years of historical practice and precedent.” The evidence is a chart that purportedly shows the historic levels after each past increase, adjusted for inflation. But the chart is misleading. It cherry picks the lowest of the several potential levels set in the past, instead of the level that corresponds to the current duties test. When the correct levels are compared, DOL’s proposed $50,440 salary threshold is lower than the levels set in the Truman, Eisenhower, Nixon, and Ford administrations. As Tammy McCutchen testified in Congress on behalf of the U.S. Chamber of Commerce, the short test salary threshold varied between a low of $51,957.36 and a high of $63,741.60.
Even if you take NAM’s misleading chart at face value, it shows an increase in the threshold of 22% in the ten years from 1949 to 1959, or 2.2% per year. If the same rate of increase were applied to the 1975 threshold of $35,625, the 2015 threshold would be almost 90% higher, or about $67,000. NAM should be grateful that the Labor Department chose such a modest level.
An honest discussion of how to reduce poverty: strengthen the safety net and raise wages across the board
I’m afraid Speaker Paul Ryan’s poverty forum will fall short of coming up with solutions that will truly help lift the poor out of poverty. Real solutions should expand policies that have already been proven to work: strengthening the social safety net, making poverty programs better coordinated and more accessible to low income families, and improving job opportunities and wages across the board.
Given his past comments, it seems hugely unlikely that Ryan’s effort will emphasize these priorities, and will instead focus on pure distractions, like alleged fundamental design flaws in safety net programs that keep them from working. For example, Ryan’s arguments that the safety net creates disincentives to work can be solved by increasing program funding to flatten out phase out ranges to ensure minimal market distortions—that is (again) making the programs more generous. While some programs (e.g., the Earned Income Tax Credit [EITC]) already have these gradual phase-out ranges, others could be improved. The health insurance marketplace created a smooth transition from Medicaid to the marketplace with exchange premium and cost-sharing subsidies. Unfortunately, many states failed to expand Medicaid, leaving its near poor in the unnecessary gap. Child care subsidies, while vitally important and woefully underfunded, could be enhanced so that recipients do not fall off that eligibility cliff (PDF).
Ryan wants people to think that these issues represent a fundamental problem with these programs that can only be solved by ripping them up root and branch and sending core responsibility for safety net programs to the states. But this is wrong—these problems can best be solved with more money for benefit expansions and program coordination, including more generous and gradual phase out ranges. The fact is that Ryan’s main proposal to merge safety net programs and block grant funds to states are likely to do more harm than good, leading to increases in poverty, not reductions.
The American safety net does, of course, have a fundamental flaw: it’s simply not generous enough, because we do not provide it enough money. Any serious agenda to address poverty should attack both pre-tax and transfer inequality (mostly by boosting hourly compensation for low and moderate-wage workers) and post-tax and transfer inequality by strengthening the safety net.
The labor market is still moving in the right direction, but has a ways to go before reaching full employment
The top line numbers from this morning’s jobs report suggest that the economy is moving in the right direction, but we need to see a whole lot more movement before we reach full employment. It’s hard to overstate how important true full employment is for workers. In the absence of substantive policy changes to restore workers’ bargaining power, a tight labor market is the one avenue left to improve living standards for the vast majority of workers and their families. In a full employment economy, there are fewer people lined up for every job and employers have to offer higher wages to attract and retain workers. So, it’s really important for the Federal Reserve to let the economy achieve not just a full recovery from the Great Recession, but also genuine full employment.
While payroll employment growth in 2015 was a bit weaker than 2014, we ended the year on high note. Payroll job growth in December was strong at 292,000 jobs. While average payroll growth in 2015 (221,000 a month) was still below 2014 (260,000), the last three months saw some decent acceleration. Fourth quarter job growth averaged 284,000, compared to 174,000 in the third quarter. I’m hoping this is an indication of stronger job growth in 2016. If that strong pace continues over the next year, we will return to pre-recession labor market health in the near future.
When that happens, we should see better and better wage growth. Nominal average hourly wage growth rose 2.5 percent over the year, which is still too slow, but there have been some signs it’s picking up. In each successive quarter of 2015, average hourly wage growth increased by 0.1 percentage points. I wouldn’t go so far as to say that constitutes substantial acceleration, but the rate of growth has indeed nudged up. It’s important to remember, however, that nominal wage growth is still far below target levels. We need to see stronger and more sustained wage growth, above 3.5 percent, before it would be safe to say we were at full employment and it would be appropriate for the Fed to act to raise rates.
Recovery is still in full swing for African American workers
The 2015 job market ended on a high note after trailing the pace of monthly job growth in 2014 for much of the year. The economy averaged net job growth of 284,000 in the last quarter of 2015, adding 292,000 in December—the second highest month behind October. Though the national unemployment rate was unchanged over the last month, it appears that African Americans reaped notable benefits from the end of the year increase in hiring. The black unemployment rate declined 1.1 percentage points (to 8.3 percent) and the percentage of African Americans with a job (the employment-to-population ratio, or EPOP) rose by half a percentage point, to 56.4 percent.
Even with this end of the year hiring surge, unemployment rates have remained relatively flat over the last two quarters of the year and are still slightly above the 2007 pre-recession average. However, comparing annual averages for 2013, 2014, and 2015 reveals that there has been notable longer term progress, especially for black workers. On average, the black unemployment rate falls by 1.7 percentage points for every 1 percentage point drop in the national rate. The following chart shows that relationship has held up over the last couple years, but it also shows that changes in the black unemployment rate are consistent with increased employment and a growing (rather than shrinking) labor force. In fact, African American workers have registered more growth in labor force participation and employment than whites or Latinos over the last year.
What to Watch on Jobs Day: A 2015 Wrap Up
With the last jobs report for 2015 coming out tomorrow, let’s step back and put it in the context of the entire year—and of the recovery as a whole. If December’s numbers come in as expected (analysts are predicting job growth around 215,000), that will be an indication of a relatively strong labor market in 2015, especially compared with the Great Recession and the beginning of the recovery. While the economy has improved, when you look at the peak in 2007 or the stronger economy of 2000, it is clear we still have a way to go before we reach full employment.
Job gains in 2015 were slower than 2014, but they remained solid—slowly eating away at the slack created by the Great Recession. The unemployment rate, and the long-term unemployment rate, measurably declined. The unemployment rate fell from a January to November average of 6.2 percent in 2014 to 5.3 percent in 2015, while the long-term unemployment rate fell from 33.5 percent to 28.1 percent over the same period.
Another key indicator is the employment-to-population ratio (EPOP) of prime age workers (25-54 years old). While prime-age EPOP increased in 2014, it has barely budged since January of 2015, even as the unemployment rate continued to fall. A flat EPOP would mean we’re only adding enough jobs to absorb new prime age population growth. Job growth has to be stronger, and sustained for a longer period, before we return to recovery level EPOPs. If job growth continues in 2016, prime-age EPOPs should start rising again, continuing their march toward recovery.
The worst part of the Fed’s rate increase? It wasn’t data-driven
The Federal Reserve’s decision to begin nudging up interest rates in the clear absence of any inflationary pressures in economic data is disappointing. Interest rate increases should be a tool used to slow the pace of economic growth and halt downward progress on unemployment when there are clear signs of economic overheating that threaten to unsustainably push up wage and price inflation. There are no such signs in today’s economy.
If last week’s hike presages a regular round of increases and monetary tightening going forward, the cost would be immense—millions of Americans would have fewer work opportunities and tens of millions would see smaller wage increases 12-18 months from now. Further, these costs would be strongly regressive, disproportionately harming low and moderate-wage workers and communities of color.
Over the past generation in the American economy, only genuine full employment like we achieved in the late 1990s has delivered strong and equitable wage growth. Because other policy decisions made over this time have eroded most sources of American workers’ bargaining power (inflation-adjusted minimum wages are low, unionization rates are low, and exposure to global competition is high), low and moderate wage workers need extraordinarily tight labor markets to achieve decent rates of hourly pay increases. A full-employment economy is particularly vital for African American and Latino workers, who continue to experience significantly higher rates of unemployment and lower rates of wage growth than other workers, but who have seen larger drops in unemployment as the recovery has proceeded.
Sen. Mikulski wrecks labor standards in H-2B guestworker program
Senator Barbara Mikulski wants the public to believe that replacing U.S. workers with lower-paid foreign guestworkers is somehow good for us and good for the economy. That’s nonsense. The economy needs good-paying jobs for U.S. workers, not jobs that pay $5 an hour less and get filled by indentured workers recruited from foreign countries.
Sen. Mikulski claims that her efforts to gut the Department of Labor’s H-2B visa program regulations are all about trying to protect the Maryland seafood industry, which she claims is at risk because few Americans are willing to take oyster and crab-shucking jobs for minimum wage. What she doesn’t tell the public is that the H-2B visa program she’s expanding—while simultaneously gutting all of its rules—is used mostly to bring in landscape laborers and gardeners, not crab pickers. Her claim that bringing in one poorly paid gardener creates four jobs in the U.S. economy—a claim concocted by a conservative think tank—is utter baloney. You can find some economist somewhere who will defend almost any claim, but that particular claim is indefensible. Bringing in landscape laborers on H-2B visas who are indentured to their employers and can’t bargain for better wages and working conditions lowers wages for Americans who would otherwise get those jobs, and it leaves more money in the employer’s pocket, but it doesn’t create additional jobs. As EPI has shown, there are no labor shortages in landscaping or other H-2B occupations, but employers want H-2B workers instead of Americans because they can control them and keep them in shocking conditions.
H-2B visas are also used to bring in indentured construction laborers at wages far below prevailing wages. Ask a construction worker in Baltimore what he thinks about seeing what used to be decent-paying construction jobs go to people from thousands of miles away when thousands of Maryland construction workers are still unemployed.
If Sen. Mikulski weren’t so concerned about the corporations itching to bring in another 200,000 guestworkers, she could guarantee an adequate supply of seafood workers by restricting the 66,000 H-2B visas already available to jobs where a real labor shortage has been found—where employers offer higher wages and still can’t find qualified workers—rather than supporting an amendment that drastically cuts wages and labor protections and opening the gates for a race to the bottom.
Labor Department’s common sense fiduciary rule survives the House of Representatives
The Obama administration deserves the nation’s thanks for standing up to the financial industry and its army of lobbyists on a matter of principle as well as practical importance: holding financial advisers accountable to their clients. Secretary of Labor Tom Perez refused to back down from a rule he proposed that would require financial advisers to act in the best interests of their clients. The rule simply requires advisors to provide what most clients probably already think they are receiving: advice about their retirement plans untainted by conflicts of interest. It would prohibit common practices such as steering investments to companies that pay the adviser a commission.
This rule would seem to be a no-brainer, but the industry makes billions of dollars from conflicted advice, and it’s used to getting its way. So the outcome of its efforts to kill the fiduciary rule was uncertain until yesterday, when it was revealed that an amendment to block the fiduciary rule was left out of the House omnibus appropriations bill.