A long spell of very low unemployment would raise wages—even in the face of employers’ monopsony power
Probably the most-asked question about the U.S. economy in recent months has been “why aren’t wages growing faster?” For years during the slow recovery from the Great Recession of 2008–09, the reason why wages weren’t growing fast enough was pretty clear: the labor market had too much “slack”, represented by the millions of potential workers sidelined by the crisis who were queuing up to take any available job. The big bargaining chip workers have when negotiating for higher wages is the threat to quit and find another job. This threat isn’t very credible when alternative work is hard to find and there are multiple workers who would jump at the chance to take your current job.
But because unemployment has dropped below pre-Great Recession levels, many have decided that labor slack can’t be the cause of subdued wage growth anymore. So, the search for causes of sluggish wage growth that are not labor slack has begun. Two (potentially related) suspects accused in recent months have been an erosion of workers’ labor market leverage (sometimes referred to as growing monopsony power on the part of employers) and rising monopolization. This post will discuss the first one, one tomorrow will tackle monopoly.
Two punchlines to this discussion are simple enough to highlight:
Why is wage growth so slow? It’s not because low-wage jobs are being added disproportionately
Despite an unemployment rate that averaged 4.1 percent over the last 12 months, the average real (inflation-adjusted) wage of private sector workers did not grow at all over this period. Part of the reason is an increase in energy prices, which is likely to be temporary, but our slow wage growth has mostly been driven by nominal wages failing to rise quickly even in the face of low unemployment.
One explanation worth looking into is whether today’s low wage growth is due to a composition effect—i.e. low-wage jobs being added faster than middle- and/or high-wage jobs and, as a result, pulling down wage growth.
Composition was certainly a factor during the early part of the recovery from the Great Recession. In the first few years of the recovery, the jobs being added were very disproportionately low-wage jobs, which had the effect of pulling wage growth down over that period. But since 2013, as the recovery has strengthened, the opposite has been true—low-wage jobs are actually declining on net while middle and high wage jobs are being added, which has the effect of raising average wages. In other words, the composition effect is currently putting upward pressure on wages.
Why is real wage growth anemic? It’s not because of a skills shortage
Despite an unemployment rate at 4.1 percent or less since last October, wage growth has been anemic. In fact, over the last year, the average real wage of private sector workers saw no growth at all. While the total lack of growth in inflation-adjusted (real) wages over the last year is due in part to an increase in energy prices that is likely temporary, the slow real wage growth we’ve seen in recent years is mostly driven by nominal wages failing to rise quickly even in the face of low unemployment.
Some have posited that our far-less-than-stellar wage growth right now could be due to workers not having the skills employers need. But that idea has the logic backwards. When employers can’t find workers with the skills they need at the wages they are offering, they will raise wages in order to attract qualified workers—if employers can’t find the workers they need among the unemployed, they will offer higher wages in an attempt to poach needed workers from other firms, who will then raise wages in an attempt to keep their workers, and so on. In other words, if there are skills shortages, we should see signs of faster wage growth for workers with needed skills. This fast wage growth for skilled workers should push up average wages, not weigh them down. Since we continue to see anemic average wage growth, not just slow wage growth for select groups of workers, it’s clear that there is not a widespread shortage of the types of workers (i.e., those with the right skills) that employers need.
But we certainly hear widespread employer complaints about not being able to find workers. Why? One reason is monopsony power in the U.S. labor market. There is a lot of evidence that many firms have monopsony power, either because of a limited number of buyers of labor or other sources beyond labor market concentration. When firms have monopsony power, they are able to pay workers less than what their work is “worth,” i.e. less than their marginal product. But a key dynamic of monopsony power is that even though monopsonists would like to hire more workers, the low wages they offer mean they can’t attract more workers unless they pay more. That is, it is a normal state of affairs for a firm with monopsony power to wish they could hire more workers at the wages they are offering, but to be unable to attract additional workers because their wages are too low. So when a firm with the power to set wages below a workers’ marginal product complains about not being able to find workers at the wages they are offering, it’s useful to remember that they are choosing to keep wages low in order to increase profits—which remain high as a share of corporate sector income—and could get more workers by simply raising wages. And importantly, when firms with monopsony power complain about not being able to find workers, it is not adequate evidence of a skills shortage.
Average wage growth continues to flatline in 2018, while low-wage workers and those with relatively lower levels of educational attainment see stronger gains
Real (inflation-adjusted) average hourly wages from the Current Employment Statistics (CES) survey did not grow at all between June 2017 and June 2018. This is not only troubling, but mildly surprising given the historically low unemployment rate of 4.0 percent. Some of this real wage stagnation can be explained by an uptick in energy prices, but even the underlying pace of nominal wage growth has yet to pick up in the way it historically has as labor markets tightened. It’s likely that the unemployment rate is overstating the strength of the economy given still soft labor force participation and the prime-age employment-to-population ratio. Even so, a steadily improving economy should eventually translate into stronger wage growth. And, if there were any thoughts that those tax cuts were going to lead to faster wage growth, which was doubtful in the first place, zero wage growth certainly isn’t a compelling case.
But the CES is only one measure of wage growth. Its large sample size and benchmarking make it one of the most reliable measures, but it only provides information on average wages for very large groups of workers (all workers or the 82 percent who are non-supervisory). The Current Population Survey-Outgoing Rotation Group (CPS-ORG) allows us to see what’s happening at different parts of the wage distribution and for workers with varying levels of educational attainment. Because of the volatility in the CPS-ORG, we’ve constructed annual averages for the year ending in June of each year, combining first half data in the stated year with second half data in the prior year. All wages are in first half 2018 dollars. Using this metric, real average hourly wages in the CPS-ORG grew 1.2 percent between 2017 and 2018. Table 1 below shows real wages by wage percentile for 2000, 2007, 2017, and 2018, with annualized changes between each set of years shown at the bottom of the table.
Hourly wages by wage percentile, 2000–2018 (FH2018 dollars)
| Wage by percentile | ||||||||||
|---|---|---|---|---|---|---|---|---|---|---|
| Year | 10th | 20th | 30th | 40th | 50th | 60th | 70th | 80th | 90th | 95th |
| 2000 | $9.09 | $11.20 | $13.11 | $15.10 | $17.89 | $20.97 | $24.80 | $30.05 | $39.23 | $50.07 |
| 2007 | $9.30 | $11.36 | $13.27 | $15.61 | $18.20 | $21.54 | $25.41 | $31.12 | $41.87 | $53.82 |
| 2017 | $9.85 | $11.44 | $13.47 | $15.60 | $18.63 | $21.96 | $26.45 | $33.41 | $46.19 | $60.95 |
| 2018 | $10.06 | $11.90 | $13.89 | $15.95 | $18.72 | $22.00 | $26.56 | $33.62 | $46.49 | $62.26 |
| Annualized percent change | ||||||||||
| 2000–2007 | 0.3% | 0.2% | 0.2% | 0.5% | 0.2% | 0.4% | 0.3% | 0.5% | 0.9% | 1.0% |
| 2007–2018 | 0.7% | 0.4% | 0.4% | 0.2% | 0.3% | 0.2% | 0.4% | 0.7% | 1.0% | 1.3% |
| 2017–2018 | 2.2% | 4.0% | 3.1% | 2.3% | 0.5% | 0.2% | 0.4% | 0.6% | 0.7% | 2.2% |
| 2000–2018 | 0.6% | 0.3% | 0.3% | 0.3% | 0.3% | 0.3% | 0.4% | 0.6% | 0.9% | 1.2% |

Note: The xth-percentile wage is the wage at which x% of wage earners earn less and (100-x)% earn more.
Sample based on all workers ages 18–64. Each year represents annual data, calculated using the first-half data in the listed year combined with the second-half data for the prior year.
Source: EPI analysis of Current Population Survey microdata
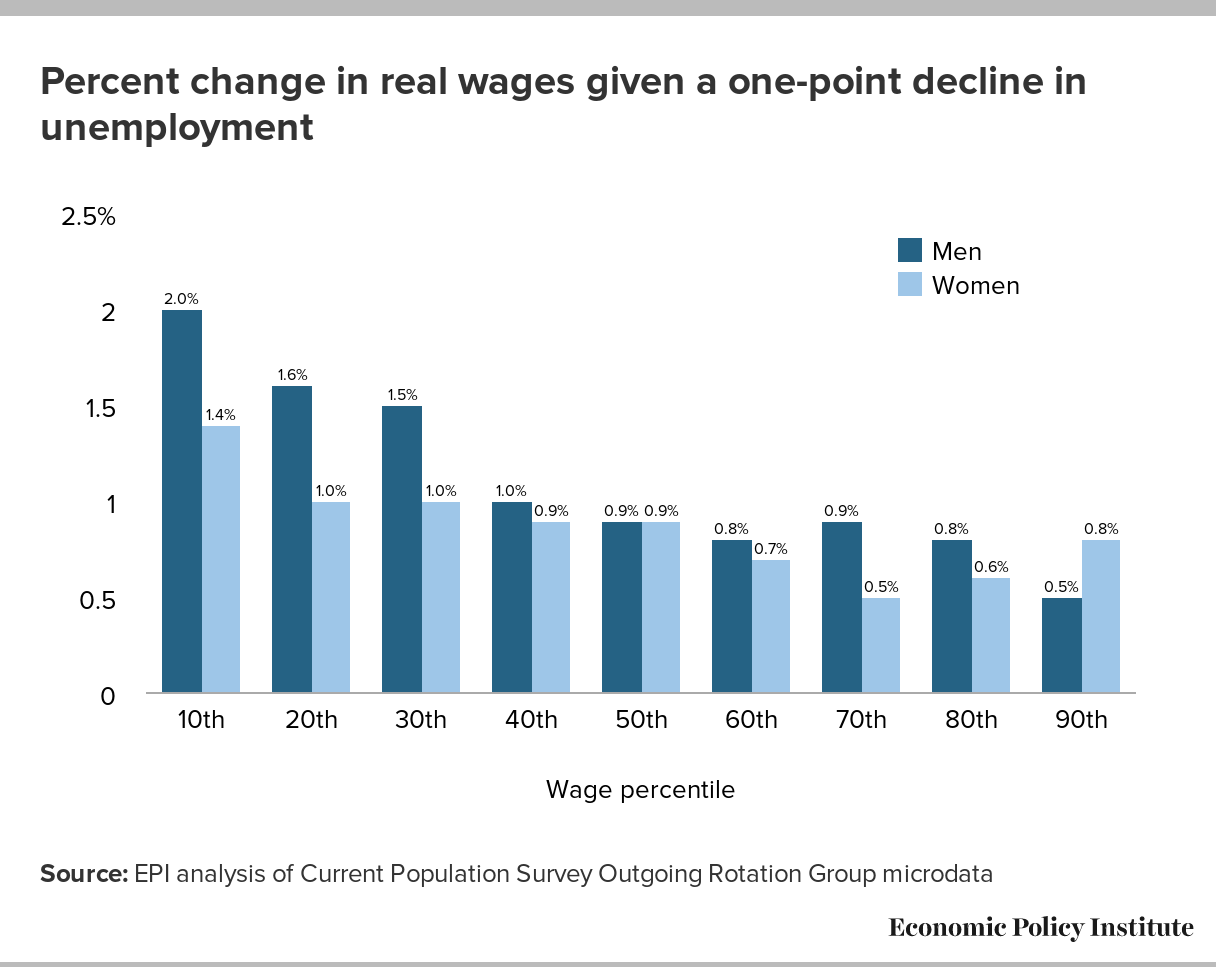
Real hourly wage growth over the last year is relatively polarized, with the strongest growth among the bottom 40 percent of workers along with those at the 95th percentile. More broad based growth, with particularly strength at the bottom of the wage distribution, is expected as we continue to move toward full employment. When the unemployment rate falls, even as more workers are drawn into the labor market, available workers of all types become scarcer and employers have to increase wages to attract and retain the workers they want. Lower unemployment has, in the past, benefited low-wage workers more than middle-wage workers and middle-wage more than higher-wage workers. In addition, in the last three to four decades of growing inequality, high-wage workers have had more leverage to bid up their wages faster than others. That trend has continued through the 2000s.Read more
What to Watch on Jobs Day: Public sector jobs are threatened by austerity and attacks on collective bargaining
Last week, the U.S. Supreme Court ruled on Janus v. AFSCME Council 31. The Court’s 5-4 decision bars unions from requiring state and local government workers who benefit from union representation to pay their fair share of that representation. As a result, public sector unions will be up against a classic free rider problem, in which all the workers in a bargaining unit will be legally entitled to union representation, even if they don’t pay a penny for the benefits and services the union provides. This decision will have profound implications for all state and local government workers throughout the country, not just the share covered by a union contract.
To get a sense of the number of workers directly affected by this decision, let’s take a look at state and local government employment. According to the Current Employment Statistics survey, there are nearly 20 million state and local workers in the economy today. This represents about 13 percent of the overall workforce. The majority of these state and local workers are in the education sector. State and local education workers top 10 million, representing 53 percent of all state and local government workers.
At the same time as attacks on public sector collective bargaining erode compensation and job quality, austerity has held back employment and wage growth. State and local workers—such as the teachers in West Virginia and Oklahoma who were recently protesting not just their low wages but lack of funding in the classroom—have already been hammered by years of austerity policy at all levels of government. In states like Wisconsin, tax cuts for the most well off in the early 2010s were financed by the layoffs and cuts to public employees’ wage and benefits. As of the beginning of this school year, local public education employment was still lower than it was before the Great Recession, and much lower than where it could be if employment had kept up with the growth in school enrollment. This means, in this past school year, we experienced a shortfall of over 300,000 public educators.
Social Security data confirm same old pattern: Self-employment headcount has risen but economic impact remains small
One indication of the growth of self-employment activity has been the rise in the number of people filing Schedule C income and self-employment earnings in their annual tax filings. This growth has been cited to illustrate the escalation of self-employment and to suggest that Bureau of Labor Statistics (BLS) measures of self-employment are missing an important phenomenon. Tracking headcounts of tax filings, however, does not adequately reflect trends in the economic impact of self-employment since, as this analysis shows, most of the growth is activity for supplementary incomes.
Our analysis of self-employment earnings data from the Social Security Administration (SSA) through 2015 (the latest data) confirms previous general findings regarding Uber drivers, independent work, all online demand platform work, nonemployer establishments, and independent contractors more generally. These previous findings are:
- The number of people involved in these types of work activity has increased;
- The increase is primarily among people who are doing so to earn supplementary income and for a short amount of hours. The increase in the various self-employment activities has not occurred in people’s “main job” or as their main source of income; and
- The economic scale of these activities has not changed much when measured as a share of economy-wide total hours worked, earnings, or compensation. While headcount measures of self-employment activity do show a large increase, the overall economic impact of this activity is relatively small in scale and growth.
The following table summarizes SSA data through 2015, the most recent year available, by “type of earnings”, meaning it distinguishes between those with regular W-2 earnings and those with self-employment earnings: the data show the number of individuals with each type of income and the amount of earnings from each type of earnings. Note that in any given year or at any particular point in time, workers can have income both from regular W-2 employment and from self-employment. One indication of this is that the sum of W-2 filers and the self-employed exceeds the total number of workers, indicating that about 40 percent of self-employed also filed a W-2.Read more
Janus decision is not about union finances—it’s about working people’s finances
Today, the Supreme Court issued its final opinions from October Term 2017. This ends a particularly devastating term for working people—and for our democracy. One of the most troubling elements of the decisions impacting workers is the court’s repeated undermining of workers’ ability to act collectively in addressing workplace issues. This can be seen in the both Epic Systems Corp. and Janus. Corporate interests have long fought to erode the right of workers’ to join together. The Supreme Court certainly advanced this attack this term.
It is likely that the small group of foundations with ties to the largest and most powerful corporate lobbies that are behind the Janus case feel validated by today’s opinion that shamefully safeguards their interests by contorting the First Amendment. However, this victory will be short lived. Working people in this country know that the economy is not working for them. Today’s decision is likely to make that more true, but at the same time, it has already made workers’ right to a union and collective bargaining a topic covered by cable news and in newspapers throughout the country—a feat in and of itself. As was seen in the reaction to the teachers’ strikes in West Virginia, Oklahoma, and beyond, when issues of economic justice and workers’ rights are put front and center, the interests of the wealthy few rarely prevail.
Much will be said of Janus and its impact on unions—particularly union finances. But today’s decision is really about working people’s finances—our wages and our benefits. Unions provide a means for working people to come together and ensure that we are paid fairly and treated with dignity on the job. Unions are fundamental to a fair economy. Union membership cuts not just across political party affiliation, but also across race, gender, and ethnicity, ensuring that often marginalized voices are represented. Unions also provide an effective, organized voice for working people in our political process—helping to win minimum wage increases and civil rights protections for all working people. Today, millions of men and women in this country are union members, and millions more view unions favorably. Over half of all Americans say that the decline in union representation has been bad for working people in the United States. The Supreme Court today focused on fair share fees, but the focus going forward must be on a fair economy for working people and unions are clearly a critical part of that fight.
Workers of color are far more likely to be paid poverty-level wages than white workers
Marking the 50th anniversary of the 1968 Poor People’s Campaign, EPI has described the potential to reduce poverty through work, provided there are jobs with decent wages and adequate hours available to everyone who can and wants to work. Unfortunately, even when jobs are available, workers are often paid so little that they can still be left in poverty. Today, one in nine U.S. workers are paid wages that would leave them in poverty for their family size if they are the sole earner in their family—even with a full-time, year-round schedule.
Although the share of workers earning poverty wages has declined over the past three decades, there are still large racial and ethnic differences in the shares of workers being paid at adequate wage levels. As shown in the first figure below, workers of color are far more likely to be paid poverty-level wages than white workers. In 2017, 8.6 percent of white workers were paid poverty wages—i.e., hourly wages that would leave them below the federal poverty guideline for their family size if they are the sole earner in the family, even if they work full-time, year-round. In contrast, 19.2 percent—nearly one in five—Hispanic workers were paid poverty wages, and 14.3 percent—roughly one in seven—black workers were paid poverty wages. Asian or Pacific Islander workers also had higher poverty-wage rates than white workers, at 10.9 percent.
Workers of color are far more likely to be paid poverty-level wages than white workers: Share of workers earning poverty-level wages, by race/ethnicity, 1986–2017
| Year | White | Black | Hispanic | Asian/P.I. |
|---|---|---|---|---|
| 1986 | 15.4% | 23.5% | 28.3% | |
| 1987 | 14.6% | 22.5% | 27.7% | |
| 1988 | 14.4% | 21.8% | 26.9% | |
| 1989 | 13.5% | 21.0% | 26.6% | 16.8% |
| 1990 | 14.5% | 22.7% | 30.2% | 18.3% |
| 1991 | 14.4% | 22.7% | 30.7% | 18.7% |
| 1992 | 14.6% | 22.4% | 30.9% | 19.2% |
| 1993 | 14.4% | 22.1% | 31.2% | 18.6% |
| 1994 | 14.8% | 22.3% | 33.1% | 19.3% |
| 1995 | 14.8% | 21.8% | 34.2% | 20.0% |
| 1996 | 13.9% | 22.0% | 32.2% | 19.9% |
| 1997 | 13.9% | 21.8% | 33.5% | 20.4% |
| 1998 | 12.6% | 18.7% | 30.8% | 18.3% |
| 1999 | 12.0% | 18.2% | 29.6% | 17.1% |
| 2000 | 10.8% | 16.2% | 28.1% | 15.4% |
| 2001 | 10.4% | 16.0% | 27.1% | 13.4% |
| 2002 | 10.3% | 15.3% | 26.5% | 14.2% |
| 2003 | 10.0% | 14.6% | 24.7% | 12.8% |
| 2004 | 10.7% | 15.0% | 26.0% | 14.1% |
| 2005 | 10.2% | 15.5% | 25.6% | 13.7% |
| 2006 | 9.8% | 14.1% | 24.3% | 12.2% |
| 2007 | 9.9% | 14.7% | 23.9% | 12.5% |
| 2008 | 10.1% | 15.1% | 23.0% | 13.0% |
| 2009 | 11.1% | 15.2% | 25.6% | 12.5% |
| 2010 | 10.5% | 14.7% | 26.0% | 13.1% |
| 2011 | 10.6% | 14.9% | 25.3% | 13.1% |
| 2012 | 11.2% | 16.6% | 26.6% | 14.4% |
| 2013 | 11.0% | 16.4% | 26.1% | 14.0% |
| 2014 | 11.1% | 17.8% | 24.6% | 13.1% |
| 2015 | 10.7% | 16.8% | 24.9% | 14.0% |
| 2016 | 9.6% | 15.4% | 21.0% | 11.8% |
| 2017 | 8.6% | 14.3% | 19.2% | 10.9% |
Notes: A “poverty-level wage” is a wage that would leave a full-time, year-round worker below the federal poverty guideline for their family size if they are the sole earner in the family. Poverty wage thresholds are specific to each family size, and family sizes are calculated using the total number of people in each family or subfamily within the CPS data. The "Asian or Pacific Islander" race category is only available beginning in 1989.
Source: EPI analysis of Current Population Survey Outgoing Rotation Group microdata
Among workers of all races and ethnicities, the shares being paid poverty wages have declined from highs reached in either the mid-1980s or the mid-1990s. However, the share of black workers earning poverty wages in 2017 (14.3 percent) was still slightly above where it was in 2006 (14.1 percent.) Black workers are the only group for whom the share receiving poverty wages is not at its lowest level on record.
Notably, racial gaps have been remarkably consistent—if not gotten worse—over time. The share of black workers earning poverty-level wages has consistently been 1.5 times that of white workers for the entirety of the series. The ratio of the Hispanic poverty-wage rate to the white poverty-wage rate has actually grown since the 1980s. In 1986, the share of Hispanic workers earning poverty-level wages was 1.8 times that of white workers; in 2017, it was 2.2 times the share of white workers.Read more
Nonemployer establishments grew in 2016 but their real revenues were stable: This confirms other data on self-employment showing more activity, but little economic impact
Last week’s release of the new Bureau of Labor Statistics (BLS) Contingent Worker Survey (CWS) has renewed public interest in tracking the number of self-employed or independent contractors. Today’s release of the U.S. Census nonemployer establishment data for 2016 provides another useful data point about the trends in self-employment.
Our analysis of these new nonemployer establishment data affirm the pattern seen through 2015. As we wrote yesterday: these data confirm previous general findings regarding Uber drivers, all online demand platform work, and independent contractors more generally. These previous findings are:
- There is an increase in the amount of people involved in self-employment or online platform types of work activity;
- The increase is primarily among people who are doing so to earn supplementary income and for a short amount of hours. The increase in the various self-employment activities has not occurred in people’s “main job” or as their main source of income; and
- The economic scale of these activities has not increased greatly when measured as a share of hours worked or compensation earned. While “headcount” measures do show a large increase, the overall economic impact is relatively small.
As we show, there has been a significant increase in the headcount of nonemployer establishments. However, the economic impact, as measured by the share of nonemployer establishment revenues in total revenues, has not increased in roughly 20 years. Nonemployer establishments grew by 2.0 percent from 2015 to 2016 but their real revenues grew by just 0.2 percent, evidence of a very small economic impact. In fact, over the medium term there has been a slight decline in the nonemployer establishment share of all revenue between 2007 and 2016, from 3.3 to 3.1 percent of all revenue. This indicates that the growth of nonemployer establishments seems to reflect the growth of self-employed individuals operating unincorporated businesses that generate very little revenue, including the period since 2011 when Uber, Lyft, and other online platform work expanded rapidly.Read more
Has self-employment surged? Data on nonemployer establishments confirm other data showing more activity, but not much economic impact
Update: Read the analysis of 2016 nonemployer establishment data.
Last week’s release of the new Bureau of Labor Statistics (BLS) Contingent Worker Survey (CWS) has renewed public interest in tracking the number of self-employed or independent contractors. The upcoming release of the U.S. Census nonemployer establishment data for 2016 this Thursday will provide another useful data point about the trends in self-employment.
Our analysis of nonemployer establishment data through 2015 indicates that these data confirm previous general findings regarding Uber drivers, all online demand platform work, and independent contractors more generally. These previous findings are:
- There is an increase in the amount of people involved in these types of work activity;
- The increase is primarily among people who are doing so to earn supplementary income and for a short amount of hours. The increase in the various self-employment activities has not occurred in people’s “main job” or as their main source of income; and
- The economic scale of these activities has not increased greatly when measured as a share of hours worked or compensation earned. While “headcount” measures do show a large increase, the overall economic impact is relatively small.
As we will show, there has been a significant increase in the headcount of nonemployer establishments. However, the economic impact, as measured by the share of nonemployer establishment revenues in total revenues, has not increased in roughly 20 years. This indicates that the growth of nonemployer establishments seems to reflect the growth of self-employed individuals operating unincorporated businesses that generate very little revenue.
Background on CWS and nonemployer data
The CWS is based on a household survey and showed that in 2017, the share of independent contractors in total employment was 6.9 percent, comparable to what was reported in all of the other CWS surveys back to 1995. This has elicited surprise by many observers, especially those that have touted the explosion of gig work or freelancing.
The release of new Census data on nonemployer establishments for 2016 this month provides another opportunity to track these trends. These Census data capture the phenomenon of self-employment by examining business establishment/firm data rather than asking individual workers or households about employment. Census describes the data as:
“data for businesses that have no paid employees and are subject to federal income tax. Most nonemployers are self-employed individuals operating unincorporated businesses (known as sole proprietorships), which may or may not be the owner’s principal source of income.”
Various analysts have used these data to track the rise of self-employment with many arguing that the rapid rise of nonemployer establishments reflect a surge of self-employment and gig work. Abraham et al. (2017) note that the growth of nonemployer establishments was faster than self-employment in the Current Population Survey (CPS). They cite this evidence (along with tax records) as being consistent with the argument that the CPS is missing some of the growth of in self-employment, pointing out that nonemployer establishments “have trended upwards as a percent of the number of earners.” Steve King of Emergent Research, a leading analyst of gig and “independent worker” trends, has also said that nonemployer data are “a useful general indicator of U.S. self-employment.”
All of the analyses we have seen of these data solely focus on headcount measures, tracking the number of nonemployer establishments, and do not examine the economic impact, as we do in our analysis by examining the revenues of nonemployer establishments.
This may be surprising since the Census used to (but now does not) warn data users of the following:
“The majority of all business establishments in the United States are nonemployers, yet these firms average less than 4 percent of all sales and receipts nationally. Due to their small economic impact, these firms are excluded from most other Census Bureau business statistics.”Read more