Modest Income Growth in 2013 Puts Slight Dent in More than a Decade of Income Losses
Wage trends greatly determine how fast incomes at the middle and bottom grow, as well as the overall path of income inequality, as we argued in Raising America’s Pay. This is for the simple reason that most households, including those with low incomes, rely on labor earnings for the vast majority of their income. That is why my initial look at the data from the newly released Census Bureau report on income and, poverty in 2013 will look at wages and the incomes of working age households.
The Census data show that from 2012 to 2013, median household income for non-elderly households (those with a head of household younger than 65 years old) increased 0.4 percent from $58,186 to $58,448. However, that modest growth barely begins to offset the losses incurred during the Great Recession or the losses that prevailed in the prior business cycle from 2000 to 2007. Between 2007 and 2013, median household income for non-elderly households dropped from $63,527 to $58,448, a decline of $5,079, or 8.0 percent. Furthermore, the disappointing trends of the Great Recession and its aftermath come on the heels of the weak labor market from 2000-2007, where the median income of non-elderly households fell significantly, from $65,785 to $63,527, the first time in the post-war period that incomes failed to grow over a business cycle. Altogether, from 2000 to 2013, median income for non-elderly households fell from $65,785 to $58,448, a decline of $7,337, or 11.2 percent.
Real median household income, all and non-elderly, 1979–2013
| All households | Non-elderly households | |
|---|---|---|
| Jan-1979 | $49,225 | |
| Jan-1980 | $47,668 | |
| Jan-1981 | $46,876 | |
| Jan-1982 | $46,752 | |
| Jan-1983 | $46,425 | |
| Jan-1984 | $47,867 | |
| Jan-1985 | $48,761 | |
| Jan-1986 | $50,487 | |
| Jan-1987 | $51,121 | |
| Jan-1988 | $51,514 | |
| Jan-1989 | $52,432 | |
| Jan-1990 | $51,735 | |
| Jan-1991 | $50,249 | |
| Jan-1992 | $49,836 | |
| Jan-1993 | $49,594 | |
| Jan-1994 | $50,147 | $57,893 |
| Jan-1995 | $51,719 | $59,417 |
| Jan-1996 | $52,472 | $60,527 |
| Jan-1997 | $53,551 | $61,307 |
| Jan-1998 | $55,497 | $63,792 |
| Jan-1999 | $56,895 | $65,435 |
| Jan-2000 | $56,801 | $65,785 |
| Jan-2001 | $55,562 | $64,772 |
| Jan-2002 | $54,914 | $64,108 |
| Jan-2003 | $54,865 | $63,545 |
| Jan-2004 | $54,674 | $62,801 |
| Jan-2005 | $55,278 | $62,391 |
| Jan-2006 | $55,690 | $63,228 |
| Jan-2007 | $56,435 | $63,527 |
| Jan-2008 | $54,424 | $61,443 |
| Jan-2009 | $54,059 | $60,623 |
| Jan-2010 | $52,646 | $59,057 |
| Jan-2011 | $51,843 | $57,627 |
| Jan-2012 | $51,758 | $58,186 |
| Jan-2013 | $51,939 | $58,448 |
Note: Non-elderly households are those in which the head of household is younger than age 65. Data for non-elderly households are not available prior to 1994. Shaded areas denote recessions.
Source: EPI analysis of Current Population Survey Annual Social and Economic Supplement Historical Income Tables (Tables H-5 and HINC-02)
What to Look for in next Week’s Census Income Data: How Long Will It Take to Claw Back Lost Years of Income Growth?
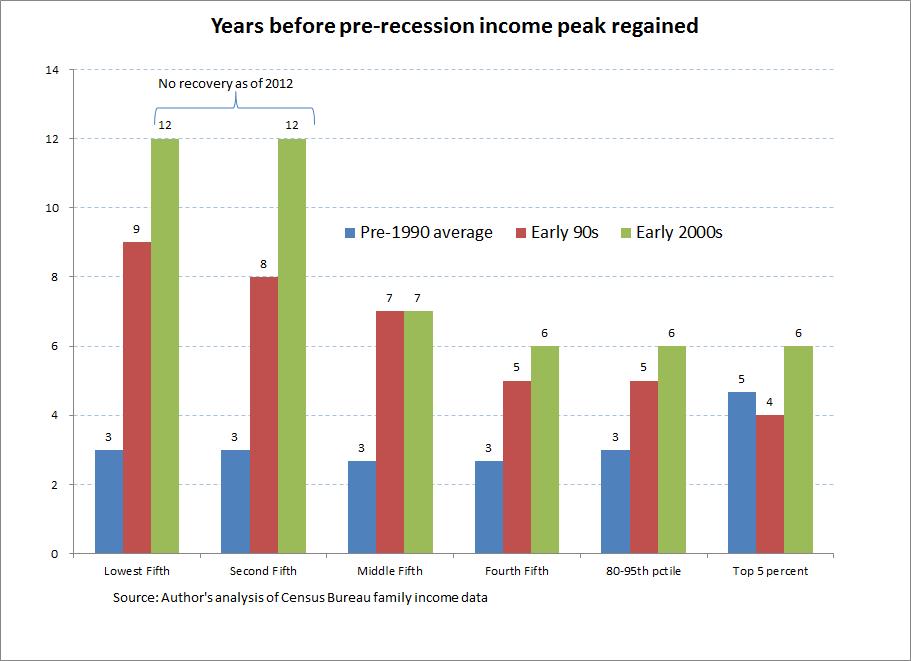
Next week will see the release of Census data on family income (as well as poverty and health insurance coverage) for 2013. Before the data are released, it’s worth reminding ourselves of one thing that last year’s data showed clearly: economic recoveries in recent recessions have been increasingly unequal, largely mirroring the generation-long upwards march of income inequality more generally. And this pattern seems poised to continue in the recovery from the Great Recession.
The figure below shows these unequal recoveries from recessions in a potentially new way. It essentially looks at just how many years of income growth were lost by each income grouping in various recessions. It measures this by simply counting how many years it took after a recession for each group to regain its previous income peak. For example, incomes for the middle fifth saw a peak in 1989 at $62,212. The recession in the following year led average income for these middle-fifth families to fall for a time, and the 1989 peak of $62,212 was not re-gained for these families until 1996, meaning that essentially seven years (from 1989 to 1996) of income growth for this group was stalled by the recession of the early 1990s. The figure below shows this number of lost years of income growth by income grouping across a range of recessions.
NAM’s “Cost of Regulations” Estimate: An Exercise in How Not to Do Convincing Empirics
The latest effort to scaremonger about a rising regulatory burden on U.S. business was released yesterday by the National Association of Manufacturers (NAM). The report, by W. Mark Crain and Nicole V. Crain (C&C, henceforth) purports to (among other things) estimate the total cost of U.S. regulations. The claimed price tag is enormous—$2.1 trillion. The bulk of these costs (75 percent) are estimated using a cross-country regression analysis. This cross-country analysis, however, is completely unconvincing and should be ignored.
An earlier C&C study used a similar methodology as yesterday’s release—that study was shown to be deeply flawed by an EPI analysis. Yet, the methodology of the current study is largely the same. In fact, if anything, the current analysis is less robust and convincing than the previous one.
C&C undertake a cross-country regression analysis across 34 OECD countries for the years 2006–2013. This obviously leads to a first reason for being wary of results—one would expect the economic performance of rich countries during the 2006–2013 period to be utterly dominated by the Great Recession and its aftermath. C&C use dummy variables to control for the years 2008 and 2009, presumably to capture the official years of the Great Recession. But most of the OECD remains operating far below potential even in 2013 due simply to a shortfall of demand. Unless one is making the case that regulations impede recovery from recessions (a claim that they do not make) then it is extraordinarily hard to make large inferences about the effects of regulations on long-run economic performance in this short sample period.
NAM Publishes Bogus Regulatory Cost Estimates
The National Association of Manufacturers (NAM) is a cynical organization. It knows that few journalists will read a lengthy paper on the cost of regulation and realize that it is dressed-up junk economics, so it has published a re-run of the truly meretricious report that Mark Crain and Nicole Crain issued four years ago. The new report is even worse than its predecessor, in the sense that the authors have chosen not to respond to any of the criticism of their earlier work—even though it has been shown to be based on bad research, unreviewable and probably biased data, and faulty assumptions about the relationship between regulation and GDP.
EPI’s Josh Bivens and others will deal with the main methodological problems with the Crains’ analysis. I want to focus just on the Crains’ re-use of the same indefensible research concerning the cost of OSHA regulation, which we first exposed in 2011. The Crains claim that OSHA regulations cost businesses $71 billion a year, even though the cost for new regulations since 2001 is only $733 million. How is it that the previous years’ regulation cost nearly 100 times as much? The Crains don’t have an explanation—they simply rely on someone else’s discredited work.
Joseph M. Johnson published “A Review and Synthesis of the Cost of Workplace Regulations” in 2005. Johnson’s paper makes many serious mistakes, but the biggest is the application of a cost “multiplier” derived from yet another analyst’s work. Harvey S. James, Jr. estimated that the true cost of OSHA rules is not the cost estimated by the agency at the time of rulemaking (which often turns out, in reality, to be too high), but a cost 5.5 times greater because of “fines for violations and the costs of the many non-major regulations for which no cost estimates exist.” This multiplier is ludicrous on its face, both because OSHA fines have never amounted to very much (even today the maximum fine that can be assessed for a willful or repeat violation is only $70,000, and the amount paid is usually far less than what is initially assessed) and because the costs of non-compliance should not be double-counted as compliance costs.
Here’s Why We Need to Legalize the Undocumented Immigrant Workforce
The Tennessean reported yesterday on the miserable work life of a 17-year old migrant worker named Ivan Alvarez, who lost three fingers when a tobacco farmer’s makeshift shearing machine sliced them off. How did the farmer treat him? He gave him a check for $100 and fired him. No worker’s compensation, no disability insurance, and no compassion.
Young Alvarez was one of six migrant teenagers working at Marty Coley Farms in Macon County, Tennessee. He lived with 13 adult men in a vermin-infested three-bedroom house, and was paid less than minimum wage for six days a week of work. Why did Alvarez and the others put up with such mistreatment? As undocumented immigrants, they were trapped.
A recorded conversation between the farm’s owner and one of the employees after the amputation shows how employers use the threat of deportation to oppress their workers and drive labor standards to the bottom. When the worker said he was leaving to take a better-paying job at another farm, the farmer, Marty Coley (one of the largest tobacco growers in the county), threatened him with deportation.
“I’ll tell you what,” Coley said. “You all go there and I’m going to call immigration and clean the whole damn bunch out.”
It adds insult to injury to learn that, as The Tennessean reported, Marty Coley Farms has received more than half a million dollars in federal tobacco price support subsidies over the past ten years.
One often hears that employers hire undocumented migrants because no American wants to do the kind of work they’re hired to do. Clearly, no American wants to live in overcrowded and disgusting quarters, be paid a subminimum wage, and have his fingers cut off. The answer isn’t to let this kind of exploitation continue—it’s to improve pay and working conditions enough that Americans will do the work, and to give immigrants the right to reject a job that degrades rather than rewards their labor. As long as the undocumented workforce is subjected to the threat of deportation, Marty Coley Farms and other low-road employers will continue to abuse and exploit them, to the detriment of every American.
The Leisure and Hospitality Sector has the Largest Gap between CEO and Worker Pay
Last week, fast food workers across the nation went on strike to demand higher wages, more regular schedules, and the right to collectively bargain. These fast food workers are a part of the restaurant industry, which Heidi Shierholz recently investigated and found to be characterized by low wages, few benefits, and high rates of poverty. But how does the experience of workers in the restaurant industry compare to its CEOs?
In 2013, CEOs of top restaurant chains in the United States made an average of $10.9 million, which is 721 times more than the minimum wage workers they employ. Restaurant are a part of the wider Leisure and Hospitality sector, which is also characterized by high rates of CEO pay and low rates of worker pay. In fact, CEOs at Leisure and Hospitality companies made, on average, 370 times the pay of a “typical” worker in that sector in 2013—making Leisure and Hospitality the worst sector in terms of disparity between CEO and worker pay. This ratio is far above the average CEO-to-worker pay ratio at all top companies, which in 2013 was 295.9-to-1. It’s also much higher than the next most disparate industry, Information, which has a CEO-to-worker pay ratio of 180-to-1, and the one after that, Trade, Transportation, and Utilities, which has a ratio of 178-to-1.
Blockbuster Report on Construction Industry Tax and Wage Cheating
For 12 months, McClatchy reporters have been carefully digging into a pit of corruption, gathering payroll records in 28 states and interviewing hundreds of workers and business owners about an epidemic of tax cheating, wage theft, and exploitation in the construction industry. The extraordinary report of their investigation was published Thursday, and it’s hair-raising. More than one-third of the employees working on federally-funded projects in Texas and Florida, overseen by public housing authorities and monitored by the U.S. Department of Labor, were improperly classified as independent contractors. The contractors misclassified them in order to escape paying worker’s compensation premiums, unemployment insurance taxes, and FICA taxes, to avoid complying with immigration document requirements, and to avoid liability for labor law violations. In just Florida, Texas, and North Carolina, McClatchy estimates that half a million workers were misclassified, and that the state and federal governments were cheated out of approximately $2 billion in taxes as result.
The stories make the damage this does to the labor market utterly clear. Construction wages were lower in 2012 than they were in 1980, despite rising productivity and huge profits in the industry. Even skilled tradesmen like plumbers and electricians earned 12 to 14 percent less than thirty years ago. Labor law offers no protection to independent contractors, who are not entitled to the minimum wage, overtime pay, or the right to join a union and bargain collectively. Exploited workers—many of them undocumented immigrants who live in fear of deportation—work without adequate safety protections, sometimes receive far less than the pay they were promised, and are deprived of the safety net’s protections if they lose their jobs, are injured or disabled, or reach retirement age. They often live in slum conditions, even while working on luxurious and glitzy new housing.
Unemployment Rate Continues To Be Elevated Across the Board
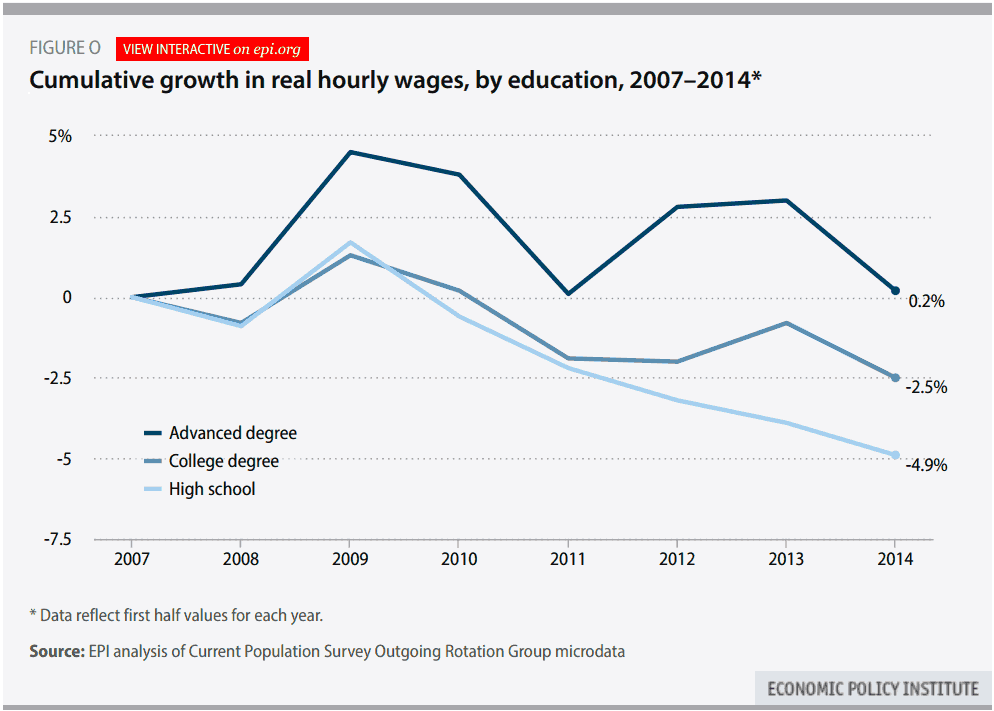
The jobs numbers today, along with a closer look at unemployment rates by demographic groups, point to considerable slack in the labor market across the board. A couple weeks back, I examined real (inflation adjusted) wages across the wage distribution. One of my findings was that real wages fell for all education groups between the first half of 2013 and the first half of 2014. As you can see in the figure below, real hourly wages fell even for those with a college or advanced degree.
And, when we look at these declining real wages hand in hand with the unemployment rates of those with a college or advanced degree, it is obvious that the existence of any sort of skill mismatch is a myth.
Slow Job Growth Should Give Us Pause
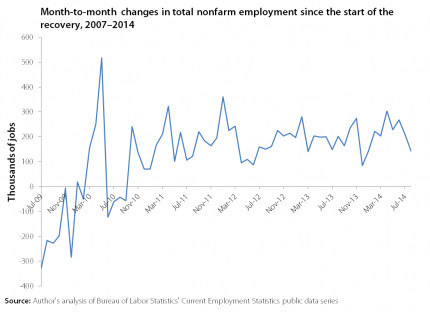
Today’s jobs report showed the economy added 142,000 jobs in August, far below expectations of job growth closer to 230,000. Prior to August, monthly job growth averaged 226,000 this year. The figure below charts monthly job growth since the start of the recovery in July 2009. While the general trend has gone up, this month’s job growth was disappointingly below trend. We haven’t seen job growth this slow since December of last year.
While it’s yet to be seen whether this slower job growth is an anomaly or a new trend, these numbers should give us pause. Adding in this month’s disappointing numbers, job growth this year is still above last year’s average at this time. Job growth has averaged 215,000 jobs a month thus far in 2014, compared to 197,000 in the first eight months of 2013. We need to be consistently adding jobs at a much faster rate to return to the labor market conditions before the recession began. Arguably, that standard is a low bar as the labor market at that time still had considerable slack.
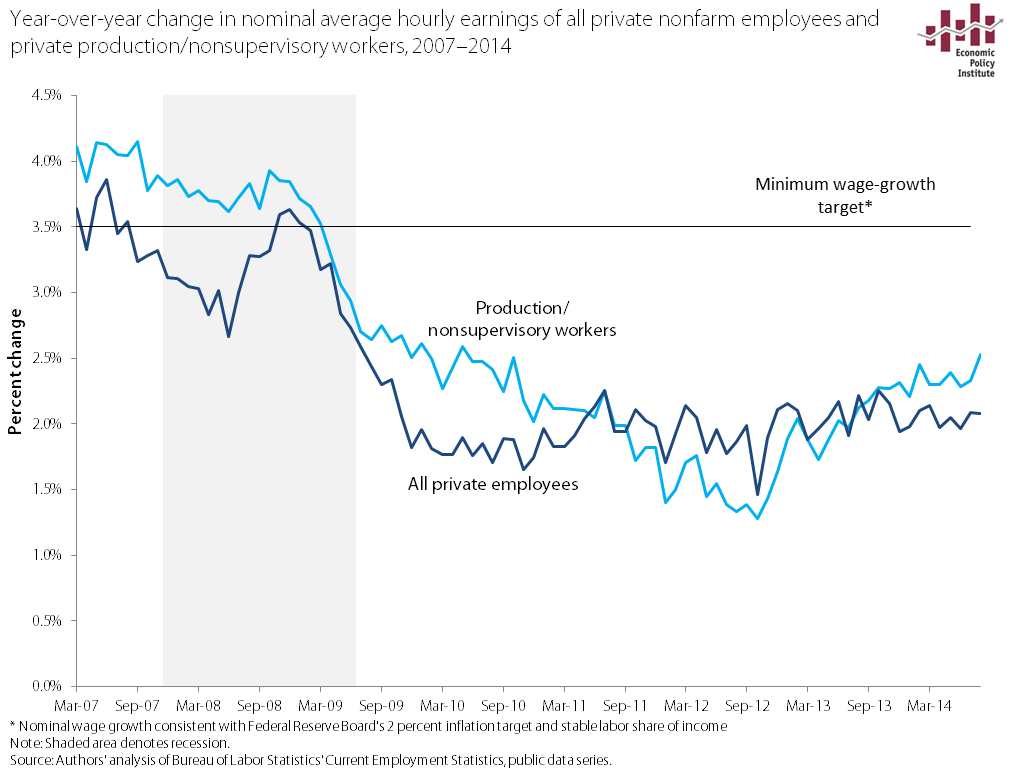
Wages Are Growing Far Below the Fed’s Target
Despite fears from some inflation hawks, the fact is that the weak labor market of the last seven years has put enormous downward pressure on wages, and there has been no significant pickup in nominal wage growth in recent years. As shown in the figure below, wage growth is far below the 3.5 percent rate consistent with the Federal Reserve Board’s inflation target of 2 percent. It’s clear that Fed policymakers should abandon notions of slowing the economy. (For a longer analysis of what to watch for in upcoming months on wage growth, see this explainer.)
What is more than obvious is that employers just don’t have to offer big wage increases to get and keep the workers they need, when hiring rates and net job creation remain far slower than what’s needed to generate healthy labor market outcomes. The result is that over the last year slow nominal wage growth, and inflation-adjusted wage stagnation (or even outright declines), have continued.
What to Watch on Jobs Day: It’s No Longer a Jobless Recovery but It’s Undoubtedly a Wage-Growth-Less Recovery
The pace of job growth in the U.S. economy has increased in 2014 relative to the preceding years, and consensus forecasts suggest that this more rapid trend will continue. Job growth has averaged 230,000 a month thus far in 2014, as compared to 196,000 and 183,000, respectively, in the first seven months of 2013 and 2012. Unfortunately, at that rate it will still take over three years to return to pre-recession labor market conditions, but clearly it is a move in the right direction.
Wage growth, on the other hand, has been uniformly dismal essentially throughout the recovery from the Great Recession. A report we released last week showed that real (inflation adjusted) wages in the first half of 2014 were down over the year across nearly all parts of the wage distribution and across all education levels. One measure we’ll be looking at more closely tomorrow—in large part because it bears so heavily on Federal Reserve policy in coming months—is the pace of nominal wage growth.
Despite fears from some inflation hawks, the fact is that the weak labor market of the last seven years has put enormous downward pressure on wages, and there has been no significant pickup in nominal wage growth in recent years. Employers just don’t have to offer big wage increases to get and keep the workers they need, when hiring rates and net job creation remain far slower than what’s needed to generate healthy labor market outcomes. The result is that over the last year slow nominal wage growth, and inflation-adjusted wage stagnation (or even outright declines), have continued. In the figure below, we show nominal average hourly earnings for both all private workers and for private production/nonsupervisory workers from 2007 to 2014. It’s clear that nominal wage growth has been flat for a long time, and there’s little evidence this flatness has changed in recent months.
The United States Leads in Low-Wage Work and the Lowest Wages for Low-Wage Workers
Fast-food workers across the country are on strike today, as a way of demanding higher wages and calling attention to the extremely low wages of low-wage workers. As Elise Gould shows in her recent paper, Why America’s Workers Need Faster Wage Growth—And What We Can Do About It, the wages of low-wage workers (the 10th percentile of wage earners) declined by five percent over the 1979-2013 period, despite a generation of productivity gains (64.9 percent).
Low-wage workers in the United States also fare very poorly by international standards, as the OECD’s recent Employment Outlook report reminds us. In the United States, according to the OECD, 25.3 percent of workers had “low-pay”—earning less than two-thirds of the median wage—which was the highest incidence of low-pay work among the twenty-six countries surveyed and far higher than the OECD average of 16.3 percent. In fact, as the figure below shows, low-wage workers fare worse in the United States than any other OECD nation. Low-wage workers earned just 46.7 percent of that of the median worker—far beneath the OECD average of 59.9 percent in 2012. To catch up to the OECD average, U.S. low wage workers would need a 28 percent wage boost.

Labor Day Hope
The last several decades have been hard on working men and women in the United States. The decline of unions (which now represent just a little more than one sixteenth of private sector workers), job loss to Mexico, China, and other low wage countries, and a series of bad court decisions weakening the rights to effectively bargain a contract have left working Americans nearly defenseless, as wages stagnate or fall and traditional pension coverage disappears. The results are ugly: since 2000, 70 percent of Americans have seen no gain in wages, and wages have fallen for the bottom 40 percent. Traditional pensions are disappearing, to the point that less than 18 percent of workers still have this crucial benefit.
Despite that grim background, there is cause for hope, and three events this past week brought a big smile to my face and lifted my spirits. The biggest lift came from two court decisions in California and Oregon (I’m a lawyer, I can’t help it!), where a U.S. Court of Appeals struck down one of corporate America’s longest-running and most outrageous schemes to cheat workers and scam the government. FedEx, a giant in package delivery industry, has avoided payroll taxes, prevented union organizing, and escaped the laws that give workers meal breaks, overtime pay, sick leave, and family leave by entering into sham contracts with its 27,000 drivers in which it declares them to be independent contractors. Employees have employment rights, but independent contractors don’t.
An employer has to pay Social Security and Medicare taxes for employees, as well as unemployment insurance taxes and worker’s compensation premiums—but not for independent contractors. So FedEx, while maintaining control over the minutest aspects of their working lives, called its drivers contractors—shifting all of the costs and risks off of FedEx and onto its employees. As described by Judge William Fletcher, FedEx “contracts with drivers to deliver packages to its customers. The drivers must wear FedEx uniforms, drive FedEx-approved vehicles, and groom themselves according to FedEx’s appearance standards. FedEx tells its drivers what packages to deliver, on what days, and at what times. Although drivers may operate multiple delivery routes and hire third parties to help perform work on those routes, they may do so only with FedEx’s consent.”
Why Young People Should Care About a Lame Labor Market
I am not as optimistic about my future as my peers tell pollsters they are. Relative to the two previous generations, Millennials have higher levels of student debt, poverty, and unemployment, and lower levels of personal income and wealth. All of this has been covered in depth by the media, but what doesn’t get nearly enough attention given its importance is how poorly the American labor market is performing for my generation.
At EPI, we talk a lot about how weak labor markets hurts workers and their families (something that even The Onion has picked up on). Heidi Shierholz has documented the impact that labor market policies have on workers in various sectors, like domestic workers, and Josh Bivens and I wrote a paper showing how the weak labor market is the main challenge for middle class families in the aftermath of the Great Recession. But it can be hard to understand how the labor market relates to readers my age. With this post, I’m going to try to make the case for why young people should care about what’s going on in the labor market, and why it makes sense for them work to make it better.
A weak labor market hurts the living standards of young people in two immediate ways. First, it disproportionately affects young people’s job opportunities. This is true in good and bad times: unemployment for younger workers is almost always about twice the overall unemployment rate. As of July 2014, the unemployment rate for young workers was 13.6 percent, while unemployment for workers ages 25-54 was 5.2 percent (relative to 10.5 percent and 3.7 percent in 2007, the last time we experienced a “strong” labor market). One of the reasons for this is obvious: young people are inexperienced relative to their older counterparts. In a time of labor market weakness, older, more experienced workers who are newly unemployed will apply to jobs they may be overqualified for, leaving young people to compete with not just their peers but also a larger pool of more experienced candidates. So even while the Great Recession officially ended in 2009, young people are currently facing one extremely competitive labor market.
The Dog That Didn’t Bark, or, Why Wages at the Bottom of the Distribution Were the Only Ones That Didn’t Fall over the past Year
In writing my paper on the most recent wage trends released today, I came across an interesting finding: Wages at the bottom of the wage distribution were the only ones that didn’t fall between the first half of 2013 and first half of 2014. The figure below shows the change in real (inflation-adjusted) wages over this time at different points in the wage distribution. What is obvious from the figure is that wages have fallen for nearly every group. If I showed you the same trends by education, as I do in the paper (see Figure O), you’d see an even starker story: Wages over the past year have fallen for all education groups, including those with college or advanced degrees.
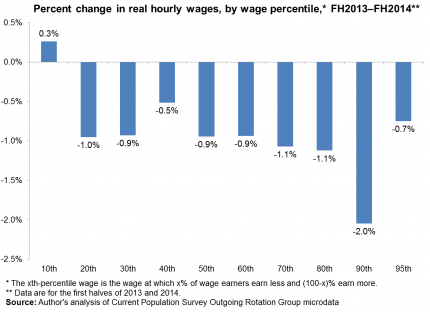
So, why didn’t the 10th percentile wage fall like all others? What is so special about that wage that sits below 90 percent and above 10 percent of workers (i.e., is not generally earned by particularly privileged workers)? Simple—several states raised their minimum wage over that period.
Wages Have Fallen for Most Americans in 2014
Today, we released a report analyzing the most recent reliable data on wages by decile and by educational attainment. These data are illuminating because they look beneath the overall averages presented in the regular statistical series covered by the media. On the one hand, these recent data look quite a bit like the couple of years of data that come before it—but that is still very revealing of what’s going in the economy.
Overall, the trends over the last year—from the first half of 2013 to the first half of 2014—show that real, inflation-adjusted wages fell up and down the entire wage scale, with one revealing notable exception. The recovery has not been completely jobless for a while now, but it does continue to be pretty much wage-less, or at least wage-growth-less.
Let’s start at the top of the wage distribution: those workers with the most education and the highest wages. Over the last year, real wages at the top of the wage distribution fell, by 2.0 percent at the 90th percentile and 0.7 percent at the 95th percentile. Real wages also fell for workers with a 4-year college degree, and even for those workers with an advanced degree. This is important in particular because it sends a clear message to the Federal Reserve Board. If even these groups of highly educated workers facing the lowest unemployment are seeing outright wage declines, there is clearly lots of slack left in the American labor market, and policymakers—particularly the Federal Reserve—should not try to slow the recovery down in an effort to keep wage and price inflation in check: they’re both already firmly in check even for the most privileged workers.
Job Growth in the Great Recession Has Not Been Equal Between Men and Women
While many strides have been made in the women’s equality movement, job growth among women and men in the aftermath of the Great Recession is not one. The solid lines in the figure below show job loss during and after the Great Recession by gender. Men lost far more jobs than women did in the Great Recession—over 6.0 million jobs, or 8.5 percent of their total December 2007 employment, compared to women who lost 2.7 million jobs, or 3.5 percent. Since the economy started regaining jobs, however, the gender dynamic in job growth has reversed—between February 2010 and the June 2014, men gained 5.5 million while women gained 3.6 million jobs.
How did men both lose and then gain more jobs than women? A lot can be explained by the industries men and women were in at the time of the Great Recession—men were in industries that would sustain the most dramatic job loss while women were concentrated in industries with less job loss. The industries with the largest overall job losses—manufacturing and construction—also employed a very large share of men. Meanwhile, the industries that employed the greatest shares of women in 2007—health care and state and local government—were not as hard-hit. However, men have gained more jobs than women because they’ve had stronger job growth within almost every industry. Women experienced a smaller share of net gains between 2007 and 2014 in 10 out of the 16 major industries: manufacturing, whole sale trade, retail trade, professional and business and health care to name a few. (To see how men and women fared in each of the 16 major industries, see my blog post in which I update the distribution of workers across industry by gender during and after the Great Recession.)
A Brief but Sad History of Selected Corporate Inversions
Earlier this week, we were greeted with the news that Burger King, a U.S. fast-food giant, is in talks to merge with Tim Hortons, a much smaller Canadian fast-food chain, and become a Canadian firm. This proposed deal is interesting on many levels. First, it is another example of a corporate inversion in which, to use Edward Kleinbard’s description, a “foreign minnow swallows a domestic whale.”
Second and more importantly, this is a corporate inversion involving a large U.S. corporation and a much smaller foreign corporation that was once a U.S. corporation. Yes, you read that correctly: Tim Hortons was a U.S. corporation prior to its inversion to Canada in 2009. Though to be fair, Tim Hortons started as a Canadian company—it was founded in Hamilton, Ontario in 1964. Wendy’s restaurant chain purchased Tim Hortons in 1995 and then spun-off the company in 2006. Tim Hortons inverted to Canada in 2009 arguing that they had substantial business activity in Canada.
Another Day, Another Corporate Inversion
In looking to merge with Canadian coffee-and-doughnuts icon Tim Hortons, Burger King is just the latest American multinational to buy a smaller foreign company and reincorporate abroad, lowering its tax bill in the process. This maneuver, called a “corporate inversion,” has picked up steam this year as Congress has stood idly by, twiddling its thumbs.
There is something unseemly about corporate inversions—that American companies would reap the benefits of American infrastructure, labor, customers, and local and federal tax incentives, and then move—just on paper—abroad, just to help their bottom lines. Executives of these now “foreign,” inverted companies don’t have to move and the companies can remain listed on American stock exchanges, but some (perfectly-legal) paper shuffling allows them to escape paying U.S. taxes. And while President Obama has appealed to corporations’ sense of “economic patriotism,” the companies—despite recent Supreme Court decisions—are not people; they don’t have emotions separate from their desire to maximize profits.
While both parties profess to disdain the practice of inversions, they disagree on what to do about them. Democrats have taken a sensible approach, writing bills that would prohibit inversions unless 50 percent of the value of the stock of the newly-merged company were held by foreigners (which makes a lot of intuitive sense), up from the current 20 percent as mandated by the most recent anti-inversion legislation, signed into law by George W. Bush. Other proposals would limit the potential benefits of corporate inversions, for example by withholding federal contracts from inverted corporations or by making it harder for a newly-foreign parent company to transfer loads of debt to its now American subsidiary and then write off the interest paid on that debt. (The Obama administration is looking to see if it can implement rule changes like this without Congress’s approval, but worries remain about whether such new rules would survive the inevitable legal challenges.)
Back to School: A Useful Guide for Parents and Policymakers to Use School Quality Rankings
The Wallethub state school quality rankings that were released earlier this month add to a growing list of such guides. They join those of the Education Law Center, which has ranked state school systems since 2011 using a four-part funding equity model, Students First’s state report cards, and the Brookings Institution Brown Center’s Education Choice and Competition rankings of large urban districts. There are many others, but these four illustrate some of the diversity in both approaches to ranking schools and types of institutions that rank them.
All four suggest to parents and policymakers that their system identifies the highest quality schools. Yet they produce a very disparate set of “best” and “worst” states (and districts). Two of Wallethub’s top three—New Jersey and Massachusetts—are among two of the the three states that Education Law Center also ranks highest: New Jersey, Massachusetts, and Connecticut. In contrast, two of Students First’s top-ranked three, Louisiana and Florida, are among the lowest on Education Law Center’s sufficiency ranking. The Brown Center gives top billing to the New Orleans’ Recovery School District, New York City, and Washington, DC, and Students First also gives DC high marks, while Wallethub has it dead last, behind Mississippi. And Wallethub ranks Louisiana, Students First’s top-ranked state, 48th of 51.
As the new school year refocuses our attention on education and school quality, what are we to make of these conflicting numbers? Can we use the rankings to help us make good decisions, whether as parents or policymakers?
The Obama Administration Moves to Protect U.S. Steel Industry from Unfair Trade Practices
Earlier this year, we showed that an increase in illegal steel dumping was putting up to half a million U.S. jobs at risk, in a study I co-authored with the law firm of Stewart and Stewart. On Friday, the U.S. International Trade Commission (USITC) determined by a vote of 5-0 that companies from South Korea, along with five other countries (India, Turkey, Ukraine, Vietnam, and Taiwan) are dumping Oil Country Tubular Goods (OCTG) into the U.S. steel market. Countervailing duties will also be assessed on OCTG imports from Turkey and India. OCTG is a high-value steel product used in the rapidly growing U.S. oil and gas fracking industry. U.S. imports of OCTG products from the subject countries more than doubled between 2010 and 2013. South Korean imports, which represent more than half of all U.S. OCTG imports, were being shipped to the United States at prices far below fair value.
The USITC vote follows on the heels of a decision by the Commerce Department that it would impose punitive tariffs on manufacturers of OCTG from Korea and the other countries involved in this case. As I noted last month, Commerce’s decision (today endorsed by the USITC) to assess duties on OCTG imports from Korea and other countries is a victory for steel workers, U.S. steel producers, and the millions of people whose jobs depend on the U.S. steel industry.
In the run-up to the decision, U.S. steelworkers mounted a “nationwide call to action” to “ensure that our trade laws are fully enforced.” This campaign featured rallies in six of the major steel-producing states, which were supported by bipartisan letters signed by more than 150 members of the U.S. House of Representatives and by 57 members of the U.S. Senate. As Steelworkers President Leo Girard pointed out, this national campaign “should not be necessary to ensure that our trade laws are enforced.” U.S. officials should enforce U.S. fair trade laws to the fullest extent allowable under U.S. and international law. And the time has come for a complete reassessment of U.S. trade laws to close loopholes and ensure that the law is promptly and effectively enforced to the full extent intended by Congress and the president.
A Salute to Jim Jeffords, a True Vermont Progressive
I was saddened to learn of the death of Sen. Jim Jeffords of Vermont this week. He was the rare politician who combined intelligence, humility, and a sense of humor, with a deep love for his state and his country. Like Sen. Paul Wellstone, Jeffords never held himself above the congressional staff who worked for him and around him, and he certainly didn’t hold himself above the people he represented, despite his Harvard and Yale degrees and his elevated position, which ultimately included service as chairman of the Senate Committee on Health, Education, Labor and Pensions and the Committee on Environment and Public Works.
When I first met Jeffords in 1982, he was a senior Republican on the House Education and Labor Committee, already exercising an independent streak by opposing Ronald Reagan’s efforts to eliminate any role for the federal government in employment and training programs. He supported the Job Training Partnership Act, and got involved in the bill’s minutiae, sitting late at night with mostly Democratic staffers as the formulas for distributing funds to the states and local entities were worked out. By pushing to give greater weight to factors like poverty, unemployment, long-term unemployment, or total population in the formulas, a state like Vermont could see its funding change dramatically, and Jeffords made sure the staff assigned to negotiate and draft the bill pushed the right buttons for his state. He was the only member of Congress in the room.
Broadening Agreement That Job Polarization Wasn’t Present in the United States In 2000s
A common but erroneous theme in the media about recent labor market trends is that technology (the robots!) threatens job growth and is the cause of wage stagnation and inequality. Politicians, policymakers, and pundits echo this as well. These insights come from research on the “job polarization hypotheses”—the claim that computerization leads to the “simultaneous growth of high-education, high-wage and low-education, low-wages jobs at the expense of middle-wage, middle education jobs” and, correspondingly, to wage polarization. It is noteworthy, therefore, that MIT Professor David Autor, the leading intellectual architect of the job polarization hypothesis, has presented a paper at the Federal Reserve Bank of Kansas City’s economic policy symposium in Jackson Hole, Wyo., which finds that job polarization did not occur in the 2000s and that, in any case, job polarization is not necessarily connected to wage polarization.
This confirms the findings of others, such as Beaudry, Green, and Sand and my own research with Heidi Shierholz and John Schmitt. One can only applaud Autor for updating his analysis of employment and wage trends, and acknowledging the lack of occupational job polarization in the 2000s and its failure to be able to explain wage trends. One can only hope that the economics commentariat will follow suit and ramp up their exploration of other causes of stagnant and unequal wage growth. Immodestly, I would suggest our recent paper, Raising America’s Pay, as a starting point.
In 2010, Autor wrote the influential paper The Polarization of Job Opportunities in the U.S. Labor Market: Implications for Employment and Earnings for the Center for American Progress and the Hamilton Project. This paper laid out what became the conventional wisdom: “the structure of job opportunities in the United States has sharply polarized over the past two decades, with expanding job opportunities in both high-skill, high-wage occupations and low-skill, low wage occupations, coupled with contracting opportunities in middle-wage, middle-skill white-collar and blue-collar jobs” and “this pattern of employment polarization has a counterpart in wage growth.”
The Fed Should Continue Its Support for a Jobs Recovery
The following is a slightly edited version of remarks delivered on an Economic Policy Institute teleconference on Friday, July 25, 2014.
Since the Great Recession began almost 7 years ago, the Fed has been the most proactive and the most effective macroeconomic policy-making institution both in attempting to end the recession and then subsequently trying to spur a full recovery. It’s been the most effective by far in the United States and almost certainly the most effective in the world. The Fed deserves a lot of praise for this stance and the economic evidence argues strongly that it should continue to prioritize boosting employment and spurring a full economic recovery. Specifically, this evidence indicates:
- The economy continues to have enormous amounts of productive slack—including in the labor market.
- Until this slack is taken up, wage-driven inflationary pressures just will not materialize.
- Wage and compensation growth will have to more than double to put significant upward pressure on overall price-growth in coming years—meaning that the Fed should be fully comfortable with nominal compensation growth as high as 4 percent over the next couple of years. This follows from the fact that trend productivity growth is roughly 1.5 percent so that 2.0 to 2.5 percent nominal compensation growth above 1.5 percent implies rising unit labor costs corresponding to 2.0 percent inflation, allowing for an additional to 0.5 compensation growth at the expense of historically thick profit margins.
The Fed is commonly described as being tasked with targeting more rapid employment growth and economic activity until the point that such rapid growth begins to spur accelerating inflation. The U.S economy is nowhere near the point where growth is rapid enough to spark accelerating inflation. Instead, we remain far from fully recovered from the Great Recession, and because of this, inflationary pressures just aren’t in the data.
What’s at Stake If the Fed Prematurely Raises Rates
The following is a slightly edited version of remarks delivered on an Economic Policy Institute teleconference on Friday, July 25, 2014.
Any systematic look at the current data on the U.S. labor market says that the large costs of the incomplete recovery are quite apparent. We still have a labor market that faces three major ongoing problems. The first is that our very incomplete macroeconomic recovery means that we have continuing high cyclical non-employment and a lot of slack left in the labor market. Even if you look at prime-age workers, those 25 to 54 years old, we’re only one-third of the way back in terms of the employment rate to where we were before the Great Recession.
If you look at young workers, the situation is particularly dire. We still have close to record low employment rates for those less than 25 years old. For disadvantaged and minority young men, the fraction that are both out of school and out of work has increased enormously since 2007; for young black males aged 20 to 24 by almost 10 percentage points from about 23 percent to 32 percent. Over the last year, we are finally seeing some significant recovery in employment, but it’s not nearly enough yet to make people whole and create real opportunities for those in many low-income and working-class communities.
Second, even as we get back closer to full employment, from which we remain very far from, we will still have the scars of the Great Recession including huge increases in the long-term unemployed and in disconnected young workers who have not gotten the types of opportunities needed to jump start their careers and to be poised to move up the career ladder in a stronger economy. So we will need to run a tight labor market for longer than normal—possibly even allowing inflation to eventually overshoot the Fed’s target for a modest period as suggested in a recent paper by Glenn Rudebusch and San Francisco Fed President John Williams—just to help make many American families whole once again and to make enough progress in combating long-term unemployment.
What You Need to Know about the President’s Legal Authority to Expand Deferred Action for Unauthorized Immigrants
President Obama is reportedly considering “deferring” (temporarily suspending) the deportation of up to five million unauthorized immigrants, which would expand and be modeled after his 2012 Deferred Action for Childhood Arrivals (DACA) initiative. This has led to a stimulating and lively public discussion regarding the extent of the president’s legal authority under U.S. immigration law. Understanding the basics of what the president may or may not do under existing law, his constitutional authority and responsibilities, and what Congress can do about it if it disapproves of the president’s course of action, is essential for evaluating the various policy arguments and should help non-lawyers follow the many nuances of this substantive debate.
Here are four questions and answers to get you up to speed:
1. Does the president have legal authority to defer the deportation of all unauthorized immigrants?
No. The president cannot refuse to enforce immigration laws, or enforce an immigration law in a way that is contrary to the aims of the law, or change immigration policy on his own. This requirement comes from the “Take Care” clause in the U.S. Constitution, which requires the president to ensure “that the Laws be faithfully executed” (Article II, Section 3). The Immigration and Nationality Act, the United States’ main set of immigration laws, contains many provisions specifying who is a “removable” (i.e., deportable) migrant (the term the law uses is “alien”). Right now there are an estimated 11.7 million unauthorized immigrants in the United States, who are deportable unless they can prove that they deserve to remain in the country because they are entitled to a legal status under U.S. law.
Congress provides the executive branch the funds to enforce the immigration laws, but it has not provided nearly enough funding to deport all 11.7 million unauthorized immigrants. The Department of Homeland Security (DHS) believes that the amount Congress has appropriated is enough to deport approximately 400,000 unauthorized immigrants per year (3.4 percent of the total) and that is how many people the Obama administration has been deporting. If the president were to refuse to deport any unauthorized immigrants, such action would violate his constitutional duty to faithfully execute the laws and amount to a de facto legalization in direct contradiction of what Congress has required of the president.
Read more
A Step in the Right Direction: OMB Will Not Implement Plan to Include “Factoryless Goods Producers” In Manufacturing
Last week, the Office of Management and Budget (OMB) announced that it was cancelling plans to reclassify factoryless goods producers (FGPs) such as Apple and Nike—most of which are now in wholesaling or management of companies (both service industries)—into manufacturing. The FGP proposal is part of a broader set of changes to the North American Industry Classification System (NAICS) that were scheduled to take effect in 2017. The FGP plan would have also required government agencies to move trade in goods made by manufacturing service providers (MSPs), such as China’s Foxconn (which builds Apple products) into services. The OMB proposal was highly controversial, and more than 26,000 comments were submitted for the record. In addition, more than 40 members of the House and Senate signed letters to the OMB raising objections and requesting clarification on a number of unresolved issues regarding the proposal.
In a recent policy memo, I noted that the proposal would artificially inflate manufacturing output and employment by treating outsourced production as part of domestic manufactured output, while artificially suppressing the reported U.S. goods trade deficit, with offsetting reductions in the services trade surplus. The proposal would also require manufacturing firms to begin reporting trade and manufacturing activities on a value-added basis, which would introduce a new level of distortion in U.S. international trade statistics that would undermine enforcement of U.S. fair trade laws. Finally, adoption of the FGP proposal, as initially formulated, could undermine U.S. Buy American Laws and U.S. Export-Import Bank policies.
The Top 10 Myths About Social Security
In honor of Social Security’s 79th birthday, here’s an update to a 2011 blog post refuting Social Security myths spread by critics of the program.
- Social Security costs are escalating out of control. No. Costs are projected to rise from roughly five to six percent of GDP before leveling off.
- Americans want benefits but aren’t willing to pay for them. Wrong again. Americans across political and demographic lines support paying Social Security taxes and prefer raising taxes over cutting benefits as a way to close the projected shortfall. A popular option is raising taxes on high earners, since earnings above $117,000 aren’t taxed. But Americans prefer to close the gap on the revenue side even if they’re asked to pay more themselves.
- Our children and grandchildren will drown in debt if we don’t cut the social safety net. No, future generations will drown in debt if we don’t address health cost inflation. Though the Affordable Care Act and other factors have slowed costs considerably, this isn’t enough—we need to get costs closer in line with those in Europe and Canada. Cutting Medicare or Medicaid benefits just pushes costs onto the private sector. And there’s no reason to lump Social Security in with other programs since it’s funded through dedicated taxes and prohibited by law from borrowing.
- The Baby Boomers will sink us. On the contrary. We saw them coming. Social Security began building up a trust fund in the early 1980s in anticipation of the Boomer retirement. The trust fund is projected to keep growing for another five years to almost $3 trillion, not quite enough to get us through the peak Boomer retirement years (the Great Recession took a bite). Read more
What’s Lost in the Market Basket Stories
The saga that has unfolded at the New England grocery store Market Basket over the past few weeks has struck a nerve, and rightly so. As many others have pointed out, the story of a corporate board taking steps to squeeze customers and employees in order to generate ever-higher profits feels far too representative of the way most businesses operate today. What fewer have come out and said: it doesn’t have to be this way.
For the uninitiated in this story, Market Basket is a supermarket chain with 71 stores in Massachusetts, Maine, and New Hampshire. The company employs about 25,000 people throughout the region and had $4.6 billion in revenue in 2013. The chain is an unabashed success, having grown from a small family store to a regional powerhouse. And they have succeeded by taking a distinctly high-road approach: the company takes care of its workers, paying decent wages, offering benefits to full- and part-time staff, and providing employees with a profit-sharing plan. At the same time, Market Basket still offers prices lower than its competitors, Walmart included.
This take-care-of-your-customers and value-your-workers philosophy has given Market Basket an intensely dedicated following, both from employees and regular shoppers. Thus, it should not be surprising that when the controlling members of the chain’s board fired the company’s beloved CEO, allegedly so that they could cut back on compensation, maximize payouts to shareholders, and potentially liquidate the company, the Market Basket faithful revolted, with workers walking off the job and customers boycotting.
I Can’t Tolerate the Nonsense on Corporate Tax Reform Any More
Corporations are adopting a new tactic to lower their taxes—renouncing their U.S. “citizenship” and adopting headquarters where there are lower tax rates. These are called “inversions.” Nothing changes in the corporations’ operations, but the “paper changes” result in lower taxes. Inversions are threatening to erode corporate taxation even further than has already occurred, which is a lot.
Corporate spokespeople would have you believe that the real problem is our corporate tax code, which they claim is in real need of “reform.” This is a total distraction, and also total nonsense.
Here’s what John Engler of the Business Roundtable said about the wave of corporations renouncing their citizenship, similar to many other quotes from business folks readily available (you can hear that same mantra from the Washington Post editorial team):
“We’re seeing one more manifestation of why the business tax structure needs to be fixed. We’re the proverbial frog that’s being boiled, and a few frogs have decided to jump out.”