The value of the federal minimum wage is at its lowest point in 66 years
The value of the federal minimum wage has reached its lowest point in 66 years, according to an EPI analysis of recently released Consumer Price Index (CPI) data. Accounting for price increases in June, the current federal minimum wage of $7.25 per hour is now worth less than at any point since February 1956. At that time, the federal minimum wage was 75 cents per hour, or $7.19 in June 2022 dollars.
Last July marked the longest period without a minimum wage increase since Congress established the federal minimum wage in 1938, and continued inaction on the federal minimum wage over the past year has only further eroded the minimum wage’s value. As shown in Figure A, a worker paid the current $7.25 federal minimum wage earns 27.4% less in inflation-adjusted terms than what their counterpart was paid in July 2009 when the minimum wage was last increased, and 40.2% less than a minimum wage worker in February 1968, the historical high point of the minimum wage’s value.
The minimum wage increases of the late 1960s expanded the coverage of the minimum wage to include industries like agriculture, nursing homes, restaurants, and other service industries. The earlier exemption of these industries from the federal minimum wage disproportionately excluded Black workers from this important labor protection. The application of the minimum wage to these industries raised workers’ incomes and directly reduced Black-white earnings inequality. Congress’s failure to raise the minimum on a regular basis in the interim, however, has eroded the value of the federal minimum wage and worsened racial earnings gaps.
The growing housing supply shortage has created a housing affordability crisis
Rising housing costs have made housing largely inaccessible and unaffordable to most Americans, but have acutely impacted communities of color and low- to moderate-income families over the past several decades. The median asking rent in the United States rose above $2,000 for the first time in June 2022. Given that the U.S. Department of Housing and Urban Development (HUD) sets the standard of affordability at 30% of household income, $2,000 per month would only be “affordable” for households earning at least $80,000 per year—well above the median U.S. household income ($67,521).
A growing housing supply shortage is a key contributor to the housing affordability crisis. Following the Great Recession, the share of homes being built fell significantly, causing buyer demand to exceed housing production. In fact, fewer new homes were built in the decade following the Great Recession than in any decade since the 1960s. This deficit has now expanded even further, contributing to a shortfall of over 3 million homes and growing.
Some of the leading factors responsible for the housing shortage are land availability and exclusionary zoning laws, which restrict the kinds of homes that can be put in certain neighborhoods—maintaining segregation. Examples of exclusionary zoning laws include minimum lot and square footage requirements, limits on the height of buildings, and restrictions on building multi-family homes. These laws have historically sought to exclude lower-income residents from living in more affluent suburban developments with access to high-performing schools, employment, and other amenities. In the early decades of the 20th century, these laws were also used as a vehicle for explicit racial discrimination excluding Black residents from predominantly white neighborhoods.
Today, the legacy of these laws remains in place and has had far-reaching consequences for all families trying to secure housing. Despite the Fair Housing Act prohibiting discrimination based on race, color, national origin, religion, sex, and other identities, the law does not prohibit class-based discrimination. This allows a legal loophole where people earning low incomes can be restricted to certain neighborhoods and excluded from living in more affluent areas with broader investment and economic opportunity. Given that Black and Latinx families have far less wealth and income than white households, on average, these exclusionary zoning laws are often used to intentionally drive people of color out of certain communities and keep neighborhoods more uniformly white. The pattern of this discriminatory practice over time has exacerbated many racial economic disparities we see today and also takes root in the current housing unaffordability crisis.
A recession would be worse than today’s inflation
The Federal Reserve has been under intense pressure in recent months to sharply raise interest rates in the name of taming inflation. The voices calling for these rate increases often explicitly say that they are worth doing even if they greatly increase the risk of recession. At their last open market committee meeting, the Fed heeded these voices and raised rates by 0.75%—the largest single increase in 28 years—and indicated commitment to continuing to raise rates until inflation normalized, even if this increased the risk of recession.
The Fed’s actions to date do not guarantee a recession, but they have already made one more likely. Moreover, if they continue on a hawkish path much longer, a recession is quite probable. This would be a huge and avoidable policy mistake. Inflation is not being driven by large macroeconomic imbalances between aggregate demand and supply. Wage growth is already decelerating noticeably. In short, the point of rate hikes—bringing demand and supply into balance and restraining wage growth—has already been accomplished.
Besides failing to recognize these points, many voices in this debate have implicitly or explicitly argued that recession and inflation cause equivalent damage, or that inflation actually causes worse damage than recession. This view is clearly wrong—the economic damage wrought by recessions is far greater than that by single-digit inflation rates.
A common argument runs that inflation harms everybody in the economy, but only those who lose their job are harmed by recession. This is the opposite of truth. A recession directly reduces economy-wide incomes while inflation does not.
June inflation data show continued growth in overall CPI, but don’t capture recent price declines in food and energy
Below, EPI director of research Josh Bivens offers his insights on today’s release of the consumer price index (CPI) for June. Read the full Twitter thread here.
Rising minimum wages in 20 states and localities help protect workers and families against higher prices
On July 1, three states, 16 cities and counties, and the District of Columbia raised their minimum wages. These updates can all be viewed in EPI’s interactive Minimum Wage Tracker and in Table 1 and Table 2 below. At a time when families are coping with rising prices, these increases will help many low-wage workers and their families make ends meet.
State minimum wage increases
Connecticut, Nevada, Oregon, and the District of Columbia raised their minimum wages, with increases ranging from $0.50 per hour in Oregon’s nonurban counties1 to $1.00 in Connecticut. The new wage floors in Connecticut ($14.00), Nevada ($10.50), and Oregon ($13.50) were set in legislation passed in the last few years, while the District of Columbia’s minimum wage ($16.10) went up due to automatic annual inflation adjustment built into the District’s minimum wage law. (Eighteen states and the District of Columbia, as well as dozens of cities and counties, have automatic annual inflation adjustment built into their minimum wage laws.)
Added to the 21 states that raised their minimums at the start of the year, a total of 24 states and the District of Columbia have raised their minimum wages in 2022. Florida and Hawaii also have minimum wage increases scheduled to occur in October. Hawaii’s increase will be the first of four increases, recently enacted by state lawmakers, that will ultimately bring the state’s minimum wage to $18 by 2028.
Jobs report: Moderating wage growth means the Fed doesn’t need to raise interest rates further to contain inflation
Below, EPI president Heidi Shierholz offers her initial insights on the jobs report released this morning, which showed 372,000 jobs added in June and wage growth continuing to decelerate. Read the full Twitter thread here.
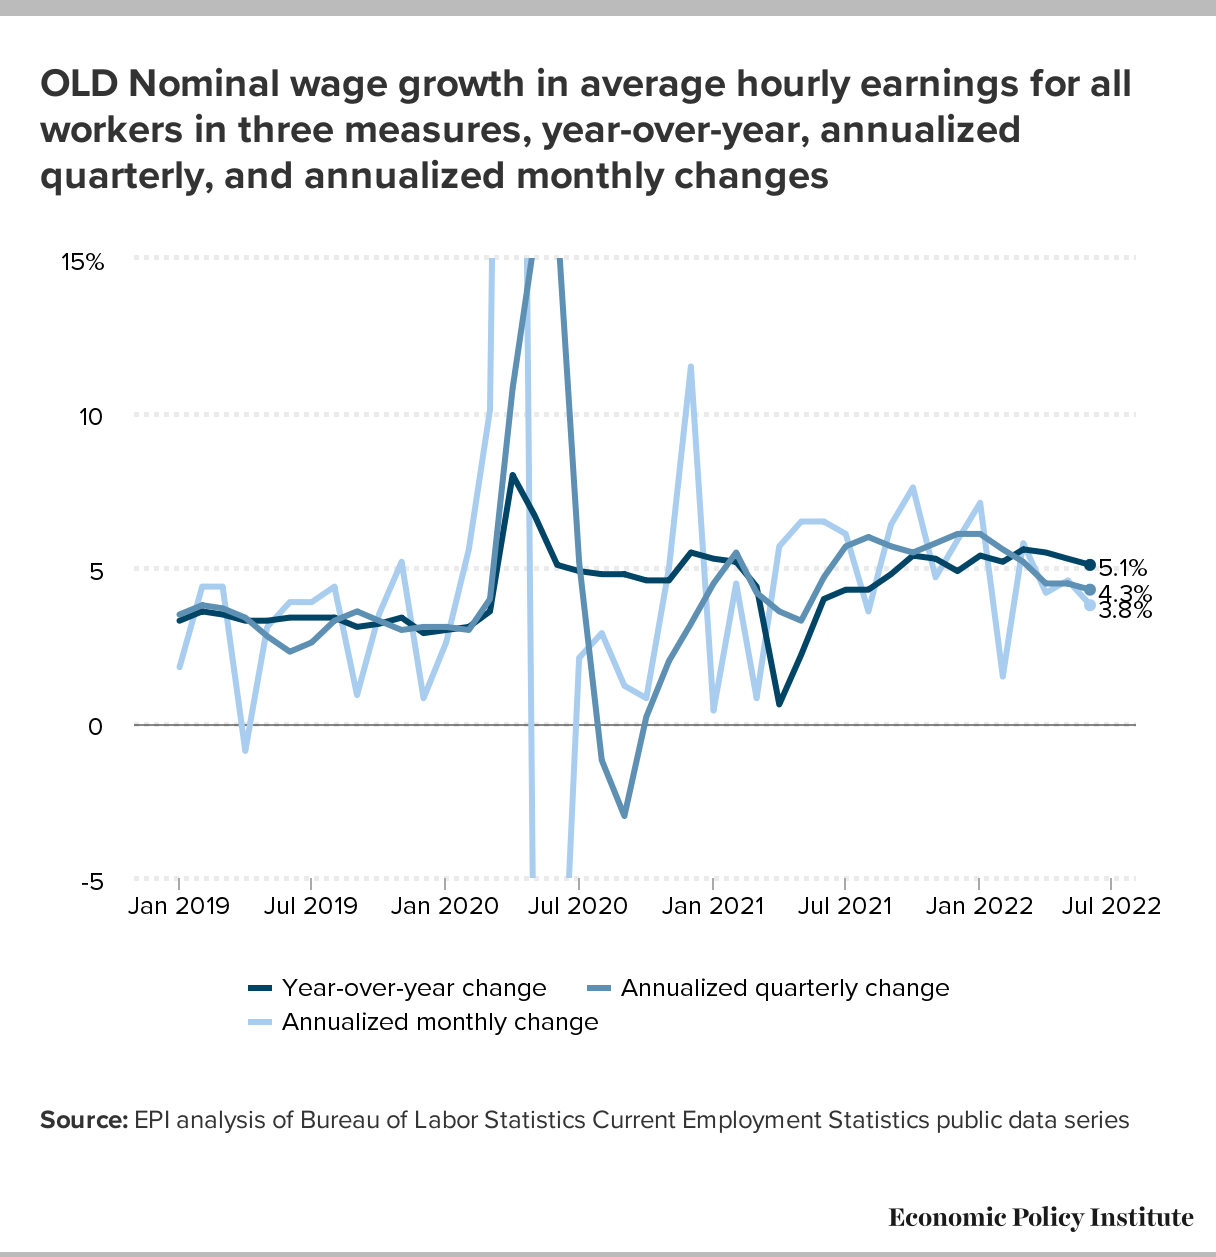
Will Friday’s wage growth numbers stop the Fed from snatching defeat out of the jaws of victory?
This Friday’s data from the Bureau of Labor Statistics (BLS) could be enormously consequential for what the Federal Reserve does over the next few months. If, as we think, Friday’s data continue to show decelerating wage growth, then the Fed really doesn’t need any more interest rate increases to contain inflation. But if the Fed ignores this and tightens anyhow, the magnificent achievement of a rapid recovery from the worst economic shock of the century could be thrown away, snatching defeat from the jaws of victory.
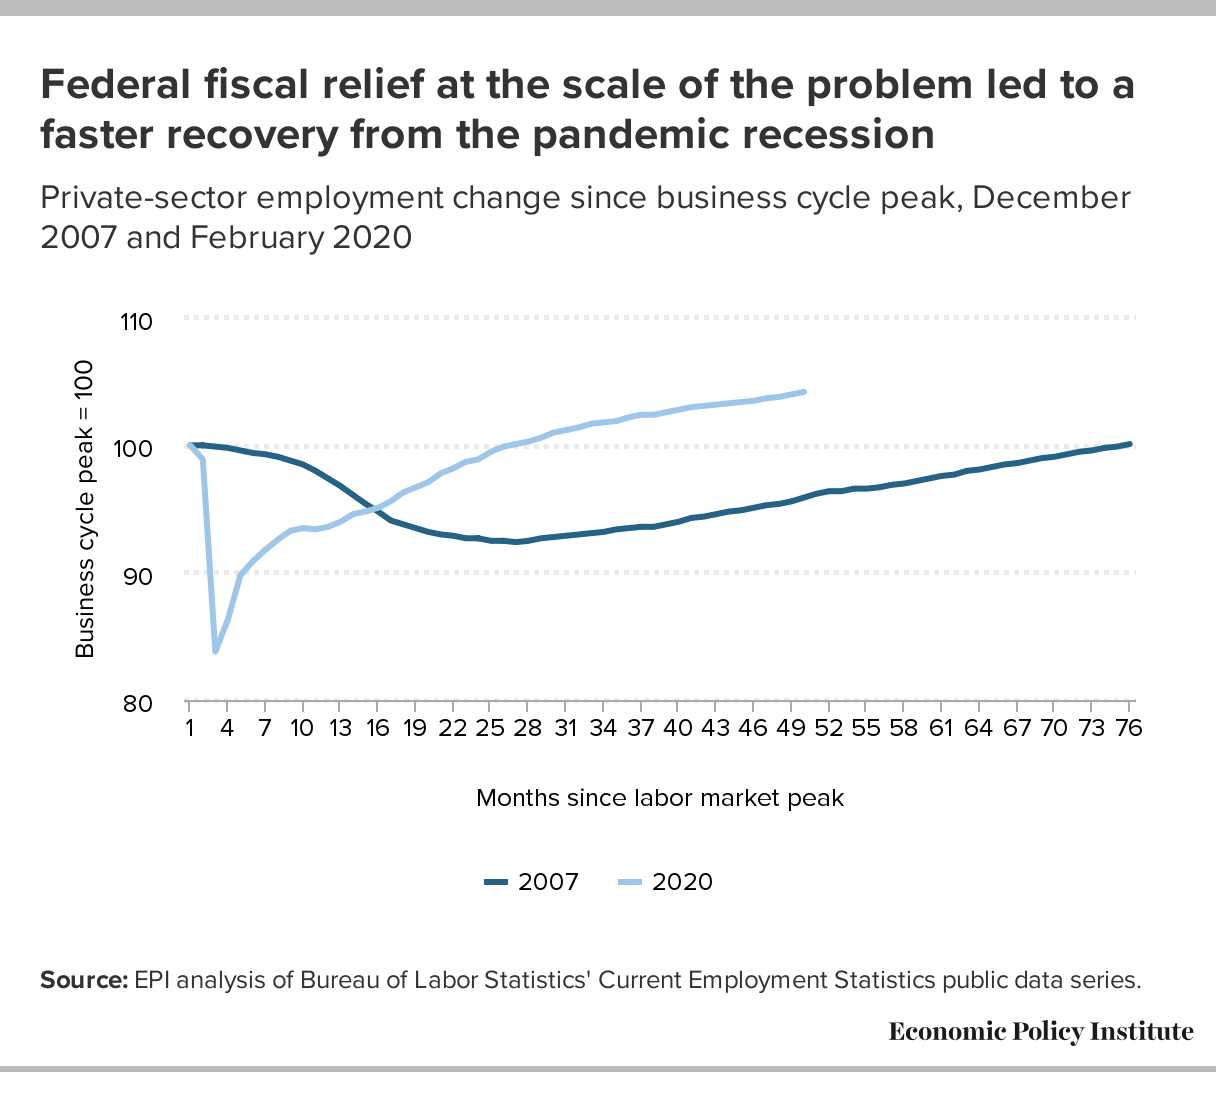
In March and April of 2020 as COVID-19 first spread across the United States, 22 million jobs were lost. Aided by the CARES Act passed in April 2020, the first 12 million jobs came back pretty easily over the following six months—businesses that had closed their doors but not gone bankrupt during the months of lockdown simply re-opened. But, job growth slowed in every month between August 2020 and December 2020—and in that last month employment contracted. Progress had not just stalled but gone backwards. At a similar point in the recovery from the Great Recession of 2008–2009, fiscal policymakers perversely shifted toward austerity and the result was that it took a full 10 years to regain pre-recession labor market health.
This time, however, additional fiscal support was passed in December 2020 and with the American Rescue Plan in March 2021. And since December 2020, the pace of job growth has been spectacular, with 9.2 million jobs added in 17 months—about 540,000 jobs every single month. Fiscal policy led the way on this, but the Federal Reserve has played a strong supporting role in boosting growth over this time as well. Today, unemployment is fully recovered to pre-pandemic levels and labor force participation nearly so. This is a huge policy accomplishment.
State and local governments have made transformative investments with American Rescue Plan recovery funds in 2022: A tighter focus on working families and children will have the greatest impact going forward
An earlier version of this post reported that large cities and counties had only budgeted 50% of their allocated funds. However, this number is misleading as only 50% of SLFRF funds for local governments were disbursed in 2021. This post has been edited to show that 83% of the received funds had been budgeted.
As most states wrap up their legislative sessions, we can assess expenditures of State and Local Fiscal Recovery Funds (SLFRF), appropriated by the American Rescue Plan Act (ARPA), so far this year. Many state and local governments have used ARPA funds to make transformative investments to support an equitable recovery, while others have used the funds in ways that will do much less to stimulate the economy, enhance racial equity, or support low-wage workers and their families. State and local governments still have considerable remaining ARPA resources to spend, and ample opportunity to use them effectively.
By now, nearly all of the $350 billion in ARPA funds has been disbursed by the federal government to the states; some entities got all their funds at one time in 2021, but most had half their funds withheld to 2022. According to the National Council of State Legislatures, states and territories have so far appropriated $133 billion of the $199.8 billion allocated to them for SLFRF. Below the state level, it’s not possible to know exactly how much of the approximately $150 billion allocated to cities, counties, and tribal governments has been spent, since those reports are not publicly available. However, the largest cities and counties are required to file reports on SLFRF funds, and as of the end of 2021, 83% of the money they received in the first tranche of funding has been budgeted, according to an analysis by the Treasury Department. (This does not mean all budgeted funds have already been spent.)
Job openings still near historic high in May while hires and separations were little changed
Below, EPI senior economist Elise Gould offers her initial insights on today’s release of the Job Openings and Labor Turnover Survey (JOLTS) for May. Read the full Twitter thread here.
The hires and layoffs rates held steady in May as the quits rate ticked down slightly. Hires remain elevated by historical standards as workers get (re)absorbed into the labor market. High quits signals a stronger labor market where workers can quit, search, and obtain new jobs. pic.twitter.com/0MYPh51VD6
— Elise Gould (@eliselgould) July 6, 2022
Against panic: The Fed should not be given permission to cause a recession in the name of inflation control
The disappointing May data on consumer prices—showing continued strong growth of overall inflation and no real reduction of core inflation—seem to have been a turning point in how many influential policymakers and analysts view the U.S. inflation problem. In particular, it has inspired near-panic and damaging exhortations that the Federal Reserve should push the economy to the brink of recession in the name of fighting inflation. It has also led to preemptive absolutions of the Fed of any criticism that might come their way if a recession does result from steep interest rate increases.
This panic is unwarranted, and the Federal Reserve should not feel free to ratchet up interest rates without regard to the risk of recession. Years from now, a recession induced by the Fed raising rates too quickly will be seen clearly as a policy mistake that could have been avoided. This conclusion stems from several simple facts:
- Both real output and the economy’s underlying productive capacity (potential output) are essentially in line with what pre-pandemic forecasts projected by mid-2022. None of these pre-pandemic forecasts indicated this would imply economic overheating by now. Given this, the macroeconomic balance between demand and supply cannot be so out of alignment that it explains a large share of the acceleration of inflation in the past 15 months.
- Crucially, potential gross domestic product (GDP) was clearly above actual GDP for most of 2021 when inflation started. This is very hard to square with macroeconomic imbalances driving the rise of inflation.
- Finally, there is rich, existing literature on the degree of inflation to expect given an overshoot of aggregate demand over potential supply. These estimates imply substantially less inflation than we’ve seen to date, meaning that factors besides simple macroeconomic imbalances are likely at play.
- While the May price data were discouraging, there is reason to think that some of the drivers of inflation in recent months may be losing steam.
- Profit margins are still at historically high levels but have come down significantly in 2022.
- Wage growth has lagged inflation over the entire episode and has even decelerated in recent periods. This means that wages’ role as a dampener of inflation looks set to continue (and maybe even strengthen) in coming months.
- The main channel through which higher interest rates will put downward pressure on prices runs through a softer labor market (higher unemployment) reducing growth in labor incomes, which reduces demand and reduces pressure on prices from the cost side as well. But, labor income growth has not been a key driver of inflation so far; in fact, wage growth has significantly dampened the growth of inflation over the past 15 months. In the past six months, hourly wage growth is actually running at a pace entirely consistent with the Federal Reserve’s 2% long-run inflation target.