Mankiw swings and misses in defense of Romney’s carried interest
A couple days ago, Harvard economist Gregory Mankiw tried his best to defend the carried interest tax loophole by blowing smoke at the debate and hoping no one would notice. The carried interest loophole allows hedge fund and private equity managers to reclassify their compensation for management services—a hefty slice of the return on their investors’ capital—as capital gains, which are taxed at a preferential 15 percent rate instead of the top marginal income tax rate of 35 percent. Mankiw is an economic adviser to former Massachusetts Gov. Mitt Romney, who inadvertently thrust the carried interest loophole into the spotlight with his 13.9 percent effective tax rate. But no amount of smoke or sand can cover up Romney’s tax return or a tax code that throws fairness out the window for the millionaires and billionaires in high finance.
Rather than defending carried interest outright, Mankiw muddies the water by leading readers through five examples of varying business arrangements and their respective tax treatment, attempting to illustrate that the line between labor and capital income is often blurred. Fair point. The tax code is complicated and similar modes of economic activity are often taxed differently, violating the principle of horizontal equity. Indeed, the tax code grossly violates the principle of horizontal equity when compensation is reclassified as investment income, as the carried interest loophole allows. Inadvertently, Mankiw is making a strong case for again equalizing the tax treatment of income derived from wealth and income derived from labor (as was done under the Tax Reform Act of 1986). After all, why should the tax code incentivize one compensation arrangement over another?
And Mankiw brushes off the second half of the fairness question: The carried interest loophole and the preferential treatment of capital gains it confers also violate the principle of vertical equity (the basic tenet of a progressive tax code that effective tax rates should rise with income). Instead, he compares Romney to a carpenter specializing in business fixer-uppers, implying that this tax question is about fairness to the middle class. But this is about someone with a net worth between $190 million and $250 million paying less than 15 percent on $21.7 million in income and the principle of vertical equity being undermined where it is most needed (where the money is).
This flaw in the tax code spans well beyond the presidential campaign trail: Private equity firm The Carlyle Group recently disclosed that its three founders each received in 2011 a $275,000 salary, a $3.5 million bonus, and roughly a $134 million share of investment profits, much of which is carried interest. Additional returns on their personal investments in Carlyle ranged from $57 million to $78 million. With so much income taxed at a 15 percent rate, it’s hard to imagine their effective tax rates landing in a different ballpark than that of Romney. The carried interest loophole helps the wizards of high finance to undermine the basic principles of fairness in the tax code. And unless repealed, this Wall Street subsidy will cost taxpayers $13 billion to $24 billion over a decade (the range of estimates in President Obama’s four budget requests, all of which have proposed repealing the carried interest loophole to no avail).
As Alec MacGillis notes, Mankiw’s half-hearted defense of the carried interest loophole is odd because he had previously concluded that, “Deferred compensation, even risky compensation, is still compensation, and it should be taxed as such.” But that was before he became an economic adviser to Romney. One of Mankiw’s famous “10 Principles of Economics” is that people respond to incentives, as he’s aptly proving.
The carried interest tax loophole is simply indefensible, as demonstrated by Mankiw’s fickle muddy-the-water defense. There are certainly gray areas in the tax code, but no amount of smoke can shroud this particular loophole as anything but an egregious subsidy to high finance.
Montana judge’s actions provide an opportunity to confront the origins of America’s racial divide
John Conyers, ranking Democratic member of the House Judiciary Committee, has called for hearings that could lead to the impeachment of chief federal district Judge Richard Cebull of Montana. Common Cause president Bob Edgar called for Cebull’s resignation last week. A New York Times editorial has now weighed in with a similar call. Cebull acknowledges having sent an email to friends with a racist “joke” about President Obama, suggesting that the president could well have been born from the union of a drunken white woman and a dog.
Whatever the future holds for the judge himself, the best broader outcome from these events would be congressional hearings or other national discussion about the country’s historic and ongoing racial segregation. Unless we can come to a national understanding of the public policies that have produced a segregated society, there is little chance of developing consensus around policies to address it.
Montana’s experience is on point. At a time when, as we have recently reported, racial segregation persists, and may even be intensifying, such discussion is urgently needed. It is unlikely that the country can address the twin and mutually reinforcing crises of economic and racial inequality if it fails to examine how we arrived at this juncture.
Few blacks now interact with Judge Cebull and his circle in Helena, Mont., or in the state as a whole. This is not because blacks never settled in Montana but because, early in the 20th century, African Americans in Montana and its neighboring states were forcibly removed by the formal and informal actions of public officials and an organized white community.
In Helena, Montana’s capital where Judge Cebull now holds court, there was a black literary society founded in 1906 that heard presentations by local black poets, playwrights, and essayists. The society’s weekly attendance of 100 was about as large as the entire black population of Helena today.
In that same year, Helena’s chief county prosecutor told a jury, “It is time that the respectable white people of this community rise in their might and assert their rights.” Such incitement was successful in Helena, elsewhere in Montana, and throughout the nation during the first few decades of the 20th century.
As blacks were driven from towns in Montana and elsewhere, a series of federal, state, and local policies reinforced their concentration in urban ghettos. The public has largely forgotten this history of segregation that has bequeathed us, in the words of a 1968 presidential commission, “two societies, one black, one white—separate and unequal.” Unless we can come to a national understanding of the public policies that have produced a segregated society, there is little chance of developing consensus around policies to address it.
Read more on this issue in my commentary published earlier today.
Cuts to state and local governments are particularly hard on women
Paul Krugman and Jared Bernstein have written recently of the seemingly contradictory forces at work today in government policy. On the one hand are the stimulus efforts of the Obama administration and the federal government, which have had a measurable impact in reducing unemployment and aiding the recovery. On the other hand are the dramatic cuts to state and local budgets that these governments have made in the wake of the Great Recession. States have had to deal with the largest drop in state revenues ever recorded, and the resulting deficits have meant huge jobs losses among state and local workers.
I have commented on these job losses a few times before, so this time around I want to highlight the gender dynamics a bit. These cuts to state and local government workforces, while a significant drag on the economy as a whole, are particularly damaging for women. In 2011, women made up 46.6 percent of the overall labor force, but among state and local workers, about 60 percent are women. Because women are so disproportionately represented in state and local jobs, they also have taken the brunt of the job losses in state and local governments. Of the net change in total state and local employment between 2007 and 2011—a decline of roughly 765,000 jobs—70 percent of the drop is from female employees. Today, there are about 540,000 fewer women in state and local jobs than in 2007, compared with about 225,000 fewer men.
One other way to look at this is through the proportion of people from state and local jobs currently unemployed. According to the Current Population Survey, in 2011 women made up about 62 percent of those who reported that they were unemployed and that their most recent job was from the state or local government sector. This is lower than the female share of the net change in state and local jobs mentioned above, suggesting that some of the women who lost state and local jobs since the recession have either found private sector work or exited the labor force. Nevertheless, it is still larger than the overall female share of state and local employees.
It’s worth noting that since the recession began, men have faced larger job losses than women in the private sector. But as of Jan. 2012, the overall unemployment rate for both genders is the same at 8.3 percent. In fact, when you look at the gender breakdown of the employment to population ratio—the proportion of the total population currently employed—the most recent figures show improvement only for men. The ratio for men declined from 69.8 percent in 2007 to a low of 63.3 percent in Dec. 2009. It has since risen a bit, up to 64.5 percent in Jan. 2012 (still one of the lowest percentages on record.) For women, however, the employment to population ratio in 2007 was 56.6 percent and it has fallen virtually every month since then, hitting 52.9 percent in Jan. 2012. It has not been that low since 1987.

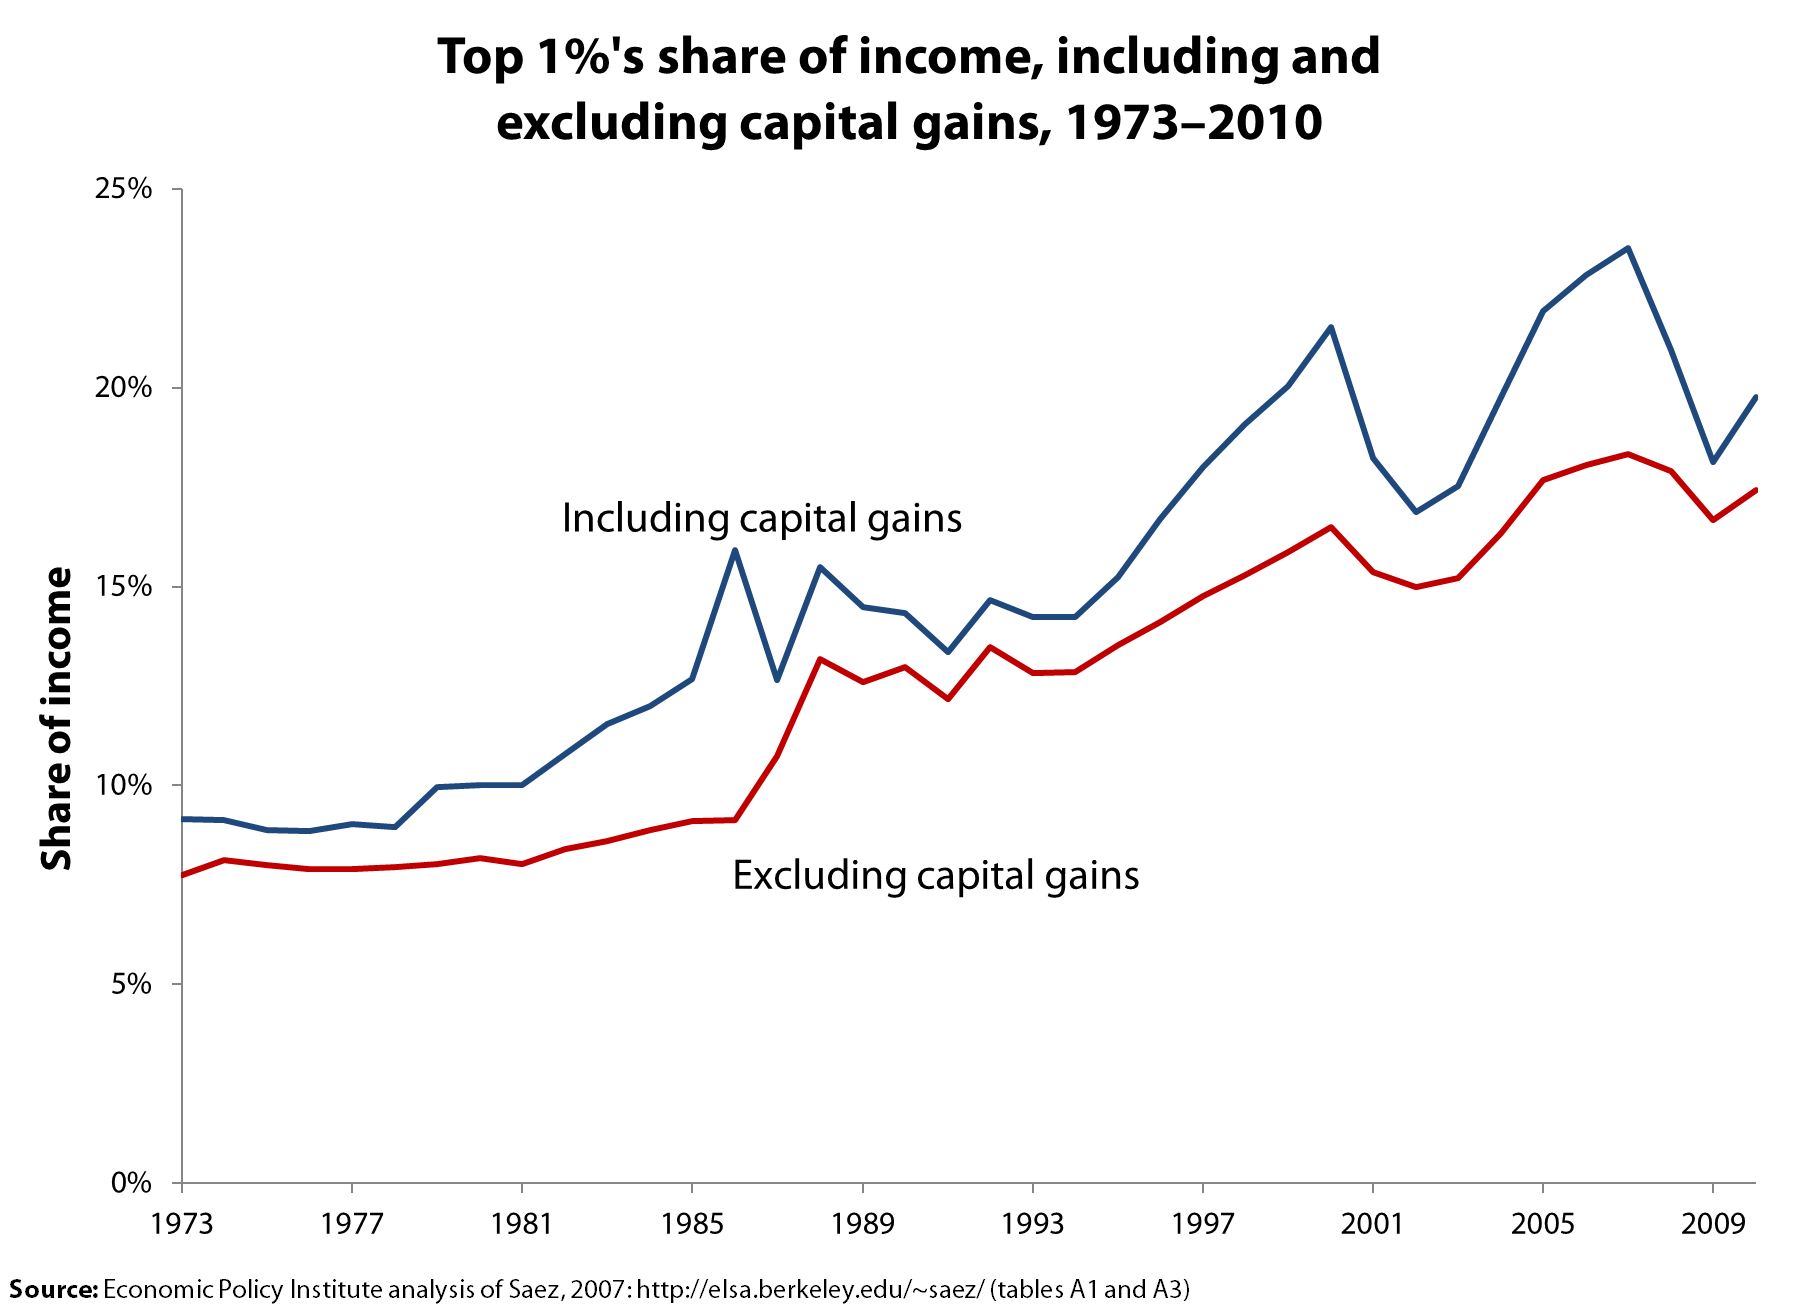
The top 1% recoups lost ground
Emmanuel Saez updated his valuable series on income trends to include 2009 and 2010 and finds, not surprisingly, that those in the top 1 percent started seeing a strong recovery in 2010 and have recouped some of the ground lost in the downturn.
I reached the same conclusion a while back based on my analysis of wage data for the top 1 percent through 2010 which showed: the recession and financial crisis crunched the wages at the top from 2007 to 2009 but the top 1 percent experienced wage gains in 2010 while the bottom 90 percent actually saw losses. (See the graph.)
The trends in capital gains is another important piece of all this. In response to the misguided claim that the financial crisis ended concerns about income inequality (“We don’t want to spend years focused on income inequality, only to learn that the financial crisis fixed it for us,” said one observer), Nicholas Finio and I showed that realized capital gains trends are volatile and correspond to the stock market. This historic pattern would have led top incomes to fall over 2007-09 and then start recovering in 2010. So, with wages of the top 1 percent recovering and the stock market growing, it makes sense that the incomes at the top fared well in 2010 as the Saez data show, regardless of whether the income measures include or exclude realized capital gains.
Paul Krugman has already commented and Mike Konczal has offered his analysis. I am going to focus on what segments of the income distribution have recovered and by how much, as the following table does, showing the income shares of the top 1 percent and the rest of the top 10 percent for the recession years and for 1979, which is a useful historic benchmark.
| Household Income Shares | |||||
|---|---|---|---|---|---|
| Top 1% | Bottom | ||||
| Year | Top 0.1% | Next 0.9% | All top 1% | 90-99 % | 0-90 |
| Income excluding capital gains | |||||
| 1979 | 2.2 | 5.9 | 8.0 | 24.3 | 67.7 |
| 2007 | 8.2 | 10.2 | 18.3 | 27.3 | 54.3 |
| 2008 | 7.8 | 10.1 | 17.9 | 28.1 | 54.0 |
| 2009 | 7.0 | 9.6 | 16.7 | 28.8 | 54.5 |
| 2010 | 7.5 | 9.9 | 17.4 | 28.8 | 53.7 |
| Change | |||||
| 2007-09 | -1.1 | -0.5 | -1.6 | 1.5 | 0.2 |
| 2009-10 | 0.5 | 0.3 | 0.7 | 0.1 | -0.8 |
| Income excluding capital gains | |||||
| 1979 | 3.4 | 6.5 | 10.0 | 24.3 | 65.8 |
| 2007 | 12.3 | 11.2 | 23.5 | 26.2 | 50.3 |
| 2008 | 10.4 | 10.5 | 20.9 | 27.3 | 51.8 |
| 2009 | 8.3 | 9.8 | 18.1 | 28.4 | 53.5 |
| 2010 | 9.5 | 10.3 | 19.8 | 28.1 | 52.1 |
| Change | |||||
| 2007-09 | -4.0 | -1.4 | -5.4 | 2.1 | 3.2 |
| 2009-10 | 1.2 | 0.4 | 1.7 | -0.3 | -1.4 |
| Source: Mishel analysis of Piketty and Saez. 2012 | |||||
The top panel shows the changes in income shares using an income measure that does not include realized capital gains. Note the income share of the top 1 percent fell 1.6 percentage points between 2007 and 2009 with the largest fall among the very top 0.1 percent. Equally interesting is that almost of the income share lost by the top 1 percent was captured by the next 9 percent, those in the 90th to 99th percentiles. That is, the great redistribution that occurred happened almost totally among the top 10 percent and did not benefit the bottom 90 percent of households. From 2009 to 2010, the top 1 percent recouped almost half the income share lost in the downturn (gaining 0.7 percentage points of the 1.6 percentage points lost) and the 90-99th percentiles gained a bit more, up 0.1 percentage points. That means, by the way, that the bottom 90 percent saw their income share fall by 0.8 percentage points from 2009 to 2010. As for inequality reversing itself, note that even at the low point following the recession, 2009, the income share of the top 1 percent was 16.7 percent, still more than double the share in 1979 of just 8.0%. Not quite a reversal.
Income losses for the top 1 percent when realized capital gains are included in the income measure (in the bottom panel) were steeper. This follows from the fact that the top 1 percent receives a huge share of all capital gains. Using this measure, the lower income shares of the top 1 percent corresponded to an increased share among both the next 9 percent and the bottom 90 percent (seen by the fact that not all of the losses of the top 1 percent were gained by the next 9 percent). With this more inclusive income measure, the top 1 percent has recouped in 2009-10 only about 30 percent of what was lost from 2007 to 2009. Even with a shrunken income share in 2009 of 18.1 percent, however, the top 1 percent still has a substantially higher income share than 1979’s 10.0 percent. Again, not quite a reversal.
The top 1 percent may not regain the extraordinary income shares obtained in 2007 or in 2000, so it may be that income inequality peaked in those earlier years. Nevertheless, we can count on a few things. One is that the top 1 percent will see its share of income expand in the current recovery. A second is that income inequality, at least as measured by the income shares at the very top, will remain very high and much greater than what prevailed at the end of the 1970s. The forces at work driving up income inequality are still in place.
Economic growth will not come to Mitt Romney’s rescue
Last year, Mitt Romney released a budget plan that achieved a remarkable trifecta: massive cuts to the social safety net, higher taxes on low-income households, and a roughly $2 trillion increase in debt over 10 years relative to a continuation of current policies. He pulled this off by boosting defense spending by $1.6 trillion and cutting taxes (mostly for high-income taxpayers) by $1.4 trillion, which together were so costly that they consumed all of the aforementioned savings and then some.
Last month, he revised this proposal. Did he pull back on his tax cuts, realizing that they’re too expensive and unfair in light of the huge sacrifices that he’s demanding of middle- and lower-income Americans? Or perhaps he reversed his defense build-up, now cognizant of the fact that the international challenges of tomorrow will have more to do with economic competitiveness than the size of the Seventh Fleet?
Hahahaha… no. Instead, he concluded that his tax cuts for high earners weren’t enough. So he doubled down—actually, tripled down—by proposing another $3.4 trillion tax cut, reducing marginal income rates by 20 percent (the top rate would fall from 35 percent to 28 percent) and eliminating the Alternative Minimum Tax, which is mainly paid by high earners.

From Flickr Creative Commons by NewsHour
His campaign states that this new tax cut will be fully paid for with a combination of tax expenditure limitations on high earners, spending cuts, and economic growth. We don’t know the details of the tax expenditure limitations, but we do know that the Feldstein proposal—popular in conservative circles—would only cover about 15 percent of the cost of these new tax cuts, and likely less. His spending cuts are already more than offset by his previous tax cuts, so that’s out. That leaves economic growth.
Problem is, there’s no way his tax cuts can generate enough additional economic growth (and associated revenue) to cover anywhere near 85 percent of these tax cuts’ price tag. Even the most favorable studies, with the most favorable assumptions, find that economic growth effects may offset a maximum of 10-20 percent of tax cuts’ static cost. Under the George W. Bush administration, the Treasury Department found that the Bush-era tax cuts recouped only 7-10 percent of their cost through macroeconomic effects. The Congressional Budget Office, under noted Republican and supply-sider Douglas Holtz-Eakin, found that the economic impact of a hypothetical across-the-board tax cut could only cover 19 percent at best (more if it were financed by tax increases after 10 years, but Romney’s anti-tax pledge rules that out) and -3 percent at worst (in this case, the tax cut would be a net drag on the economy). Most tellingly, Romney’s own economic advisor, Greg Mankiw, found that a hypothetical cut to ordinary income rates would offset less than 15 percent of its own cost over 10 years.
And each of those estimates assumes that households have unlimited foresight (likely false) and ignore the long-run impact of budget deficits on the economy by magically assuming that the deficit is stabilized. Estimates using more realistic assumptions often find that permanent, deficit-financed tax cuts skewed to high-income taxpayers actually slow long-run growth.
In Romney’s Wall Street Journal editorial accompanying his tax plan revisions, he stated that “offering gimmicky proposals that rely on implausible levels of economic growth and blow huge holes in the budget is easy. Fixing our very serious problems is not.” Clearly, he’s taken the easy route.
Pushing back against illegal unpaid internships
My appearance on The Colbert Report and an earlier blog post about unpaid internships have generated a lot of thoughtful comments and some heartbreaking stories about how hard it is to find a paying job today, even with a graduate degree. I’d like to respond to some of the comments, remind readers that this is an international problem, and point out some resources for interns who feel abused by their employers.
First, the comments. A few readers were still confused about what is legal and what isn’t, and about what legal changes I am advocating.
Certain nonprofits do not have to pay volunteers, including interns. I think there are ethical problems with nonprofits that pay their executives hundreds of thousands of dollars a year but can’t scrape up the funds to pay their interns the minimum wage. And I think it limits access to full political participation and social mobility when entry-level positions in government or nonprofits are taken by the sons and daughters of well-off parents, who support them while they work unpaid. Working class and poor kids don’t have that option and will be denied important opportunities if congressional and executive branch internships or internships in nonprofit organizations that are pre-requisites for formal, paid employment are unpaid. But I am not advocating changes in the law.
Rather, I am calling for enforcement of the law as it already is and for employers to abide by the law, which says that work performed for the benefit of a private sector, for-profit business must be paid at no less than the federal minimum wage ($7.25/hour). In the District of Columbia, Santa Fe, N.M., San Francisco, and in many states, the minimum wage is higher than $7.25 an hour. Unpaid internships in for-profit businesses are already illegal unless they meet every element of the strict six-part test provided by the U.S. Department of Labor.
 My blog post sparked a lively debate about the role of universities in promoting unpaid internships. One commenter, Heather Krasna, disagreed strongly with my statement that “universities have a cozy deal collecting tuition for semesters in which their students get farmed out as free labor to employers.” Heather’s response? The fault lies with employers, not the schools:
“The deal with college credit is not that it benefits universities. It absolutely does NOT benefit the universities. The reason students have to take credits for internships is that employers believe that it absolves them of the 6 prong minimum wage test– i.e. if a student gets college credit for their work, they are no longer an unpaid slave laborer, instead they are a “trainee” and the internship is proven to be a “learning experience” (i.e. college credit=proof the internship is not a job). So, the reason universities often allow/accept students’ getting credit for unpaid internships is that the university is being directly and loudly pressured by students who want desperately to get work experience and are being told by an employer that they can’t work for free unless they get credit. Universities, rather than telling their students that they are not going to be allowed to get relevant work experience, cave in and push their faculty to offer credit to avoid students (and their parents) from making a fuss that the university “is standing in the way” of the students’ career experience.”
But another commenter, FiredCareerCounselor, disagrees and puts the blame squarely on the schools:
“Make no mistake that unpaid internships are advocated by institutions of higher education as a means of generating huge revenue by exploiting students. The college where I work recently mandated internship for ALL students. When I expressed concern about the legal and ethical ramifications, I was replaced. Even at our small, public university, students leave with staggering student-loan debt. To think we’re MANDATING a work-for-free policy, is shameful. Here’s hoping for precedent-setting in the Hearst case, so students can earn tuition money via internship, and career centers can return to the business of getting students jobs, not volunteer positions!”
Ross Perlin, in his seminal book, Intern Nation, cites Gina Neff, a professor at the University of Washington who has studied communications internships and calls internship tuition credits a significant revenue stream for colleges and universities. “It’s a dirty little secret” that internships represent “a very cheap way to provide credits…cynically, a budget balance.” But whether universities are being thrown into the briar patch or climbing in themselves, the result is the same: Students are effectively forced into paying for work (by paying for course credits) that they ought instead to get paid for doing. Read more
Reagan, Keynes, government spending, jobs. Redux.
The blogosphere has batted around a good graph recently (from Antonio Fatas to Mark Thoma to Paul Krugman) showing the weakness of direct government spending (i.e., not including transfers) in the current recovery.
This is worth repeating, and not just because I said it a while back, but because the economic implications are huge. If government spending after the 2007 business cycle peak had seen the 19 percent cumulative growth that characterized the 16 quarters after the 1981 recession, this would have led to government spending that was higher by 3.2 percent of overall GDP by the end of 2011. Assume a reasonable multiplier of around 1.25 for government purchases (it’s probably higher than that) and you get a 4.1 percent boost to GDP. This translates into over 4 million jobs, or, more than a third of the total “jobs gap” that remains today after the Great Recession.
There are plenty of lessons to be learned from the rapid recovery after the early 1980s recession (among them – start with short-term interest rates at over 15 percent, so there’s lots of room to cut, rather than starting from right around zero), but one that is too often missed is that big government spending contributed a lot. That’s right, Reagan was a big Keynesian after all.
The myth of rising domestic spending strikes again!
I happen to love Kevin Drum’s blog, so I hope he takes this as a helpful correction. In a post yesterday, he echoed the very important point from the Center on Budget and Policy Priorities that there hasn’t been an “explosion of government’s size,” but rather that over the last few decades, health costs and demographics have driven primary (i.e., non-interest) spending trends. But then he went on and veered toward an issue very near and dear to my heart: domestic spending. Quote:
“Assuming I did my sums properly, federal spending on ‘everything else’ — that is, everything except Social Security, Medicare, and interest on the debt — has indeed gone down from 15.2% of GDP in 1962 to a projected 11.3% of GDP in 2017. (That’s from Table 3.1 here.) However, the national defense piece of that has declined from 9.2% to 2.9%, while the nondefense piece has increased from 6.0% to 8.4%. There are some arguments to be had about whether the defense piece of the budget is calculated correctly (it doesn’t include veterans benefits, for example), and it’s worth noting that healthcare costs are part of the nondefense picture too (mostly due to rising Medicaid expenditures). Still, the basic shape of the river doesn’t change much. Most of the downward slope in spending is due to lower defense spending. Domestic nondefense spending hasn’t gone up a lot, but it has gone up.”
Actually, the shape of the river changes pretty significantly if you take Medicaid, veterans benefits, and other security spending (i.e., homeland security, international affairs, and nuclear weapons security, which oddly enough is embedded in the Department of Energy) out of the domestic spending category. Throw Medicaid in with Medicare and Social Security (all part of the “health care costs and demographics” thesis) and include veterans benefits and other security spending in with the defense budget, and you get a very different picture. Yes, defense/security fell from nearly 11 percent of GDP in 1962 to 5.7 percent in 1979, but guess where it’s at now? About 6 percent of GDP. Domestic spending climbed from a little more than 4 percent in 1962 to about 7.7 percent in the late ’70s, but over the last few decades it’s actually fallen: Before the recession, domestic spending had actually declined to under 5 percent. It’s risen a bit because of the recession (e.g., more people qualifying for food stamps and unemployment insurance) and the Recovery Act, but by 2017 it is projected to fall to a near 40-year low.

In other words, there was a story to tell of defense/security spending falling and domestic spending rising, but all that happened before 1980. Since then, defense/security went up a bit during President Reagan’s Cold War build-up, down in the aftermath of the Soviet Union’s dissolution, and up again post-9/11 (wars aren’t cheap). As for domestic spending? It’s been pretty flat.
Nation, you’ll want to watch this
Update (2/29 10:18 a.m.): Watch video of Eisenbrey’s appearance on Colbert below.
***
Original post: Tonight’s episode of Comedy Central’s Emmy and Peabody Award-winning The Colbert Report will feature EPI Vice President Ross Eisenbrey. In what is sure to be a memorable and entertaining exchange, host Stephen Colbert and Eisenbrey, a labor and employment law expert, will talk about the troubling proliferation of unpaid internships in the workforce. Tune in at 11:30 p.m./10:30 p.m. CDT (check local listings) to watch Eisenbrey discuss the negative impacts of this growing labor practice.
Over the past decade, the illegal use of unpaid interns has exploded with little protest. Unpaid internships don’t fairly reward hard work, block economic mobility and leave young workers in danger of exploitation.
EPI has highlighted the inadequate regulation of student internships and detailed why it is wrong, particularly with respect to for-profit employers not paying interns for their work. Serving as a crucial voice, our research and advocacy has garnered attention from government enforcement agencies, universities, and multiple major media outlets.
MORE: EPI’s work on unpaid internships
Rein in the debt tax preference, raise some revenue
As a follow-up to my earlier post on the revenue implications of the Obama administration’s corporate tax reform framework, there is a major escape valve for turning at-best revenue-neutral tax reform into appropriately revenue-positive reform. In its framework, the administration singled out the deductibility of interest payments as one of the key imbalances in the tax code, along with distortions across industries’ effective tax rates, distortions among businesses’ organization (i.e., pass-through entities versus C-corporations), and distortions favoring offshoring. (The Center on Budget and Policy Priorities’ Chuck Marr has a good overview of this part of the framework.) These are all key areas for improvement in the tax code, but the deductibility of interest payments also has serious potential for raising revenue and curbing systemic financial risk.
This feature of the tax code distorts corporate financing decisions by pushing the effective tax rate on debt-financed investment well below the effective tax rate on equity-financed investment. The Treasury Department estimates that the effective marginal tax rate on debt-financed corporate business investment is -4.4 percent (a subsidy), versus a 36.8 percent for equity-financed investment – quite the tax wedge. Profits from equity-financed investment will be taxed at the effective corporate rate (26 percent on average), and after-tax profits will be taxed when disbursed to shareholders as dividends or realized as capital gains, both at the 15 percent rate. Conversely, Treasury notes that “profits from the same investment funded by debt will only be taxed to the extent they exceed the associated interest payments” and the interaction with the accelerated depreciation deduction results in a big tax subsidy. This is a huge boon to industries reliant on debt, notably the highly leveraged financial sector, although the value of the so-called “debt tax shield” weighs against the costs of financial distress associated with indebtedness.
We previously proposed limiting the deductibility of interest payments in our budget blueprint Investing in America’s Economy, with emphasis on reining in financial sector leverage. (This progressive budget report was a collaboration of Demos, EPI, and The Century Foundation.) The tax code should not subsidize systemic financial risk in the form of high leverage ratios (in balance-sheet terms, the ratio of assets to net worth). Emerging from the worst financial crisis since the Great Depression, curbing the debt tax shield should be a no-brainer: Lehman Brothers was leveraged 30-to-1 when it collapsed in Sept. 2008. This concern should have been addressed after hedge fund Long-Term Capital Management went bust in Sept. 1998 with a balance-sheet leverage ratio over 50-to-1. (LTCM was deemed systemically important, and the New York Fed organized a bailout by private investors.)
The administration proposed “reducing the bias toward debt financing,” which, while lacking specificity, could be a major revenue source. The deductibility of interest payments is not considered a “tax expenditure” (it’s not a deviation from the tax code, it is the tax code) so this isn’t included in the Joint Committee on Taxation’s estimate that revenue-neutral tax reform could only lower the corporate rate to 28 percent rate. (As I noted, the administration wants this 28 percent rate and permanent tax breaks for manufacturing, drawing into question whether these tax changes will result in reform or a tax cut.) Broadening the tax base into interest payments could help lower the corporate rate to the targeted 28 percent, fund the proposed continuation of the research and experimentation credit, level the playing field across financing decisions, and contribute to deficit reduction. There is a huge sum of money at stake here.
The Federal Reserve’s Flow of Funds data show $11.5 trillion in outstanding non-financial business debt and $13.7 trillion in outstanding domestic financial-sector debt as of the third quarter of 2011. It doesn’t take a leap of the imagination to conclude that there is real revenue potential in curbing the tax code’s debt-financing preference. Doing so could ensure that tax reform helps restore revenue adequacy while mitigating the subsidization of systemic financial risk.