What’s good for Apple is … just good for Apple
In a conference call with investors Monday, Apple CFO Peter Oppenheimer argued that the company could not repatriate its $65 billion (yes, with a ‘b’) in earnings and investments held overseas because the corporate income tax constituted too large a “disincentive” to do so. This was apparently the latest in a lobbying effort by Apple to have Congress institute a repatriation “tax holiday” similar to one passed in 2004, that saw hundreds of billions of dollars of foreign-held corporate earnings brought back to the country under preferential tax rates.
Calls for another corporate tax holiday have been growing in the past six months, with various pieces of legislation introduced in the House in 2011 that would reward companies that repatriate profits with a low tax rates. These calls for a repatriation holiday are often bipartisan (House legislation introduced in the summer of 2011, for example, is co-sponsored by Utah Democrat Jim Matheson and Texas Republican Kevin Brady).
It is important to note that a repatriation holiday solves no economic problem at all … unless one defines Apple investors’ obligation to pay taxes as a problem.
The best economic case made in favor of such a holiday is that by encouraging U.S. corporations to return their overseas holding to the domestic economy, this will greatly increase the supply of investment capital that can be mobilized to help businesses increase capacity.
But, as we’ve noted over and over again, U.S. businesses today still are not using anywhere near the full amount of capacity they already have. And access to cheap credit for corporations is historically easy. And business investment is the one area of the economy that is actually growing historically fast. And corporations are already sitting on historically large amounts of investable capital. In short, there is no plausible reason at all to think that repatriating foreign earnings provides any relief to the actual economic problems facing the U.S.
What a holiday would do, especially given the 2004 holiday, is convince U.S. corporations that profits earned abroad will always be given an opportunity to be brought home at very low tax rates in the future. And this will provide further incentives to firms to increase the share of their profits that are earned abroad, which means increasing the share of jobs and capacity that is held abroad.
Apple (and other multinationals) already has the chance to defer taxation on profits held overseas – this is a substantial tax benefit already. There is no public policy case at all for giving them and other multinationals another holiday from corporate taxes. Luckily, the Obama administration seems unswayed so far by Apple’s complaints.
State Department right to ban Alaskan fish processing jobs from J-1 visa Summer Work Travel program
Representatives of fish processing companies in Alaska are complaining about the possibility that they might lose access to 4,000 to 5,000 temporary guest workers they hire each year through the State Department’s “Summer Work Travel” (SWT) program, a part of the J-1 visa Exchange Visitor Program originally designed to facilitate a cultural exchange between Americans and citizens of other countries. The companies worry that they won’t be able to find enough workers this summer and that the whole industry will be negatively impacted as a result. The fundamental problem is that the industry has come to depend on an exploitable foreign workforce instead of hiring U.S. workers.
The J-1 SWT program was not designed to be a temporary foreign worker program. Its purpose is to facilitate a cultural exchange between foreign college students and American residents. If fish processors need a workforce, they should look to unemployed Alaskans and other Americans first, and if they still can’t find enough workers, there are other work visa programs that are more appropriate (for example, the H-2B program). Secretary of State Hillary Clinton and the State Department should not be persuaded by the fish processors or the two U.S. Senators from Alaska, who have urged the secretary to spare the industry from a ban on using J-1 SWT student workers.
 The concern of the fish processors likely stems from an Associated Press story about a leaked memo outlining a number of changes to the SWT program the State Department might implement this year. This includes prohibiting the employment of SWT student workers in seafood processing plants and other potentially dangerous workplaces.
The following is an excerpt from the statement of purpose in the Fulbright-Hays Act, the legislation that created the J-1 Exchange Visitor Program which includes SWT. It clearly states what the program is designed to do:
The purpose of this chapter is to enable the Government of the United States to increase mutual understanding between the people of the United States and the people of other countries by means of educational and cultural exchange; to strengthen the ties which unite us with other nations by demonstrating the educational and cultural interests, developments, and achievements of the people of the United States and other nations, and … thus to assist in the development of friendly, sympathetic, and peaceful relations between the United States and the other countries of the world.
Even if you read the entire Fulbright-Hays Act, you won’t find anything that suggests a congressional intent to provide employers with a temporary workforce or to help them fill labor shortages. It’s clear the SWT program is not primarily a guest worker program; it is intended to facilitate a cultural exchange. The State Department’s new Guidance Directive outlines this clearly. The work component of this cultural exchange is designed to allow the SWT student worker to interact with Americans and to allow him or her to earn enough money to travel to and within the United States. This allows foreign students from lower-income backgrounds to visit the United States when they otherwise might not be able to afford it. From that perspective, it’s a good thing, but it’s impossible to argue with a straight face that J-1 student workers in Alaskan fish processing plants are experiencing the cultural exchange envisioned in the Fulbright-Hays Act.
A recent investigation revealed an example of what SWT recruiters for fish processing jobs tell potential participants about the cultural exchange program they offer:
“We’re looking for hard workers who are not afraid to work every single day, up to 16 hours a day,’’ said Sarah Russell of Leader Creek Fishing in the village of Nakenak [sic]. “You will make a lot of money in a very short period of time and you won’t spend it anywhere because there’s really nothing to do in Nakenak, other than work.”
That says it all.
Russell admits the J-1 SWT student workers will work long hours – double all-day shifts to be exact. If you work 16 hours a day, when will you have time to interact with other Americans? Perhaps in the workplace? Probably not, since the plant is likely to be staffed with many other SWT workers from around the world. Russell also notes that the job is located in an isolated location with nowhere to shop and nothing to do. I assume that also means there are no cultural or educational activities available locally. How are SWT student workers supposed to interact with Americans and learn about American culture if they live far from them and are working for two-thirds of the day? (Presumably they sleep during the eight hours they have all to themselves.) Quite simply, they can’t, and that’s why it doesn’t make sense to allow fish processing jobs in the SWT program. Read more
Wisconsin one year later
We recently passed the one-year anniversary of the “uprising” in Wisconsin, which began with a governor allegedly trying to wrestle with state fiscal challenges, and quickly became the focal point for an outright attack on public sector workers. Underlying Gov. Scott Walker’s position was a belief that public sector workers were impeding the state’s economic performance. In the midst of draconian cuts to public sector employment, there emerged outlandish claims that Wisconsin’s economy was leading the nation in job growth. No single month’s employment numbers should be relied on to tell the story of what’s happening in a state economy. But looking at the longer trend provided by year-over-year data is instructive.

Figure 1 Source: EPI analysis of BLS data
EPI looks at state employment trends on a monthly basis (the most recent state level data are Jan. 2012 data). Looking comparatively at all states often tells an interesting story, but sometimes it’s good to drill a little deeper, or to look through a lens that examines regional trends.
As seen in Figure 1, overall non-farm employment since Jan. 2011 has rebounded in the Midwestern states surrounding Wisconsin, with Michigan leading the region with Jan. 2012 employment 1.6 percent higher than in Jan. 2011. Wisconsin stands out in the region, lagging with employment significantly lower — by 0.5 percent — in Jan. 2012 than a year earlier.

Figure 2 Source: EPI analysis of BLS data
While Figure 1 showed trends over the last year in overall employment, Figure 2 shows trends in private sector employment. Wisconsin appears to have returned to a “break even” point by Jan. 2012 (noting the caveat above that single month “trends” should be used with extreme caution), but it is still very clearly an outlier amongst its neighboring states.
Our colleagues at the Center on Wisconsin Strategy wrote in June that Gov. Walker should be neither credited (nor blamed) for employment trends that result from factors outside his influence. The trends we see above, however, are substantially within his influence. We and others have cautioned repeatedly that states that close their budget gaps by laying off public sector workers do so at the peril of their overall economy. To be clear, we are not talking only of the fact that unemployed public sector workers will be added to state unemployment rolls (though they have been in states across the country), but that their ability to contribute to the economy is curtailed by their unemployed status. Because public sector workers are a vital part of every state economy—firefighters, teachers, police officers and department of health officials all buy clothing, groceries, and movie-tickets just like private sector workers—laying them off hurts us all by reducing economic activity, which holds back the recovery.
Fair-minded people would surely agree that we want our governments to make smart policy choices. The data above underscore the results of two policy choices. In one choice, the decision to rescue the auto sector, we see that the result is Michigan leading the region in employment growth. In the other choice, the decision to lay off thousands of public sector workers, we see that the result is Wisconsin lagging behind the region (indeed, the nation) in employment growth.
Public investment and the social contract
On Wednesday I participated in a panel discussion called Public Investment: Key to Prosperity, sponsored by Americans for Democratic Action. Leaving aside the broader case for public investments, I’d like to point out that this topic is important not just because we continue to underinvest in infrastructure, education, and innovation, but because public investments are a powerful messaging tool for progressives. The right is exceedingly effective at demonizing all government spending as wasteful and, in the era of deficit hysteria, greedy as well because it forces us to pass debt on to future generations.
But public investments, which make up about half of all domestic (non-security) discretionary spending, are exactly the opposite of this characterization—they are investments made now, but their benefits accrue to society over decades and sometimes centuries (the Erie Canal has been in operation for nearly 200 years!). The left does well talking about the importance of individual programs, but unless we can start linking it all (or at least many) together under a single conceptual umbrella, we’ll keep losing the budget battles that happen at the macro level.
This message gets to the broader social contract. Elizabeth Warren’s hyper-viral video is really about the role that public investments play in an individual’s success, and the debt that successful taxpayers owe back to society in the form of higher tax rates. For a deeper look at this, check out The Self-Made Myth, which shows how many successful business leaders—from Warren Buffet and Ben Cohen to Donald Trump and Ross Perot—owe their success to government’s investment in them.
China continues to lean against the wind on need for currency revaluation
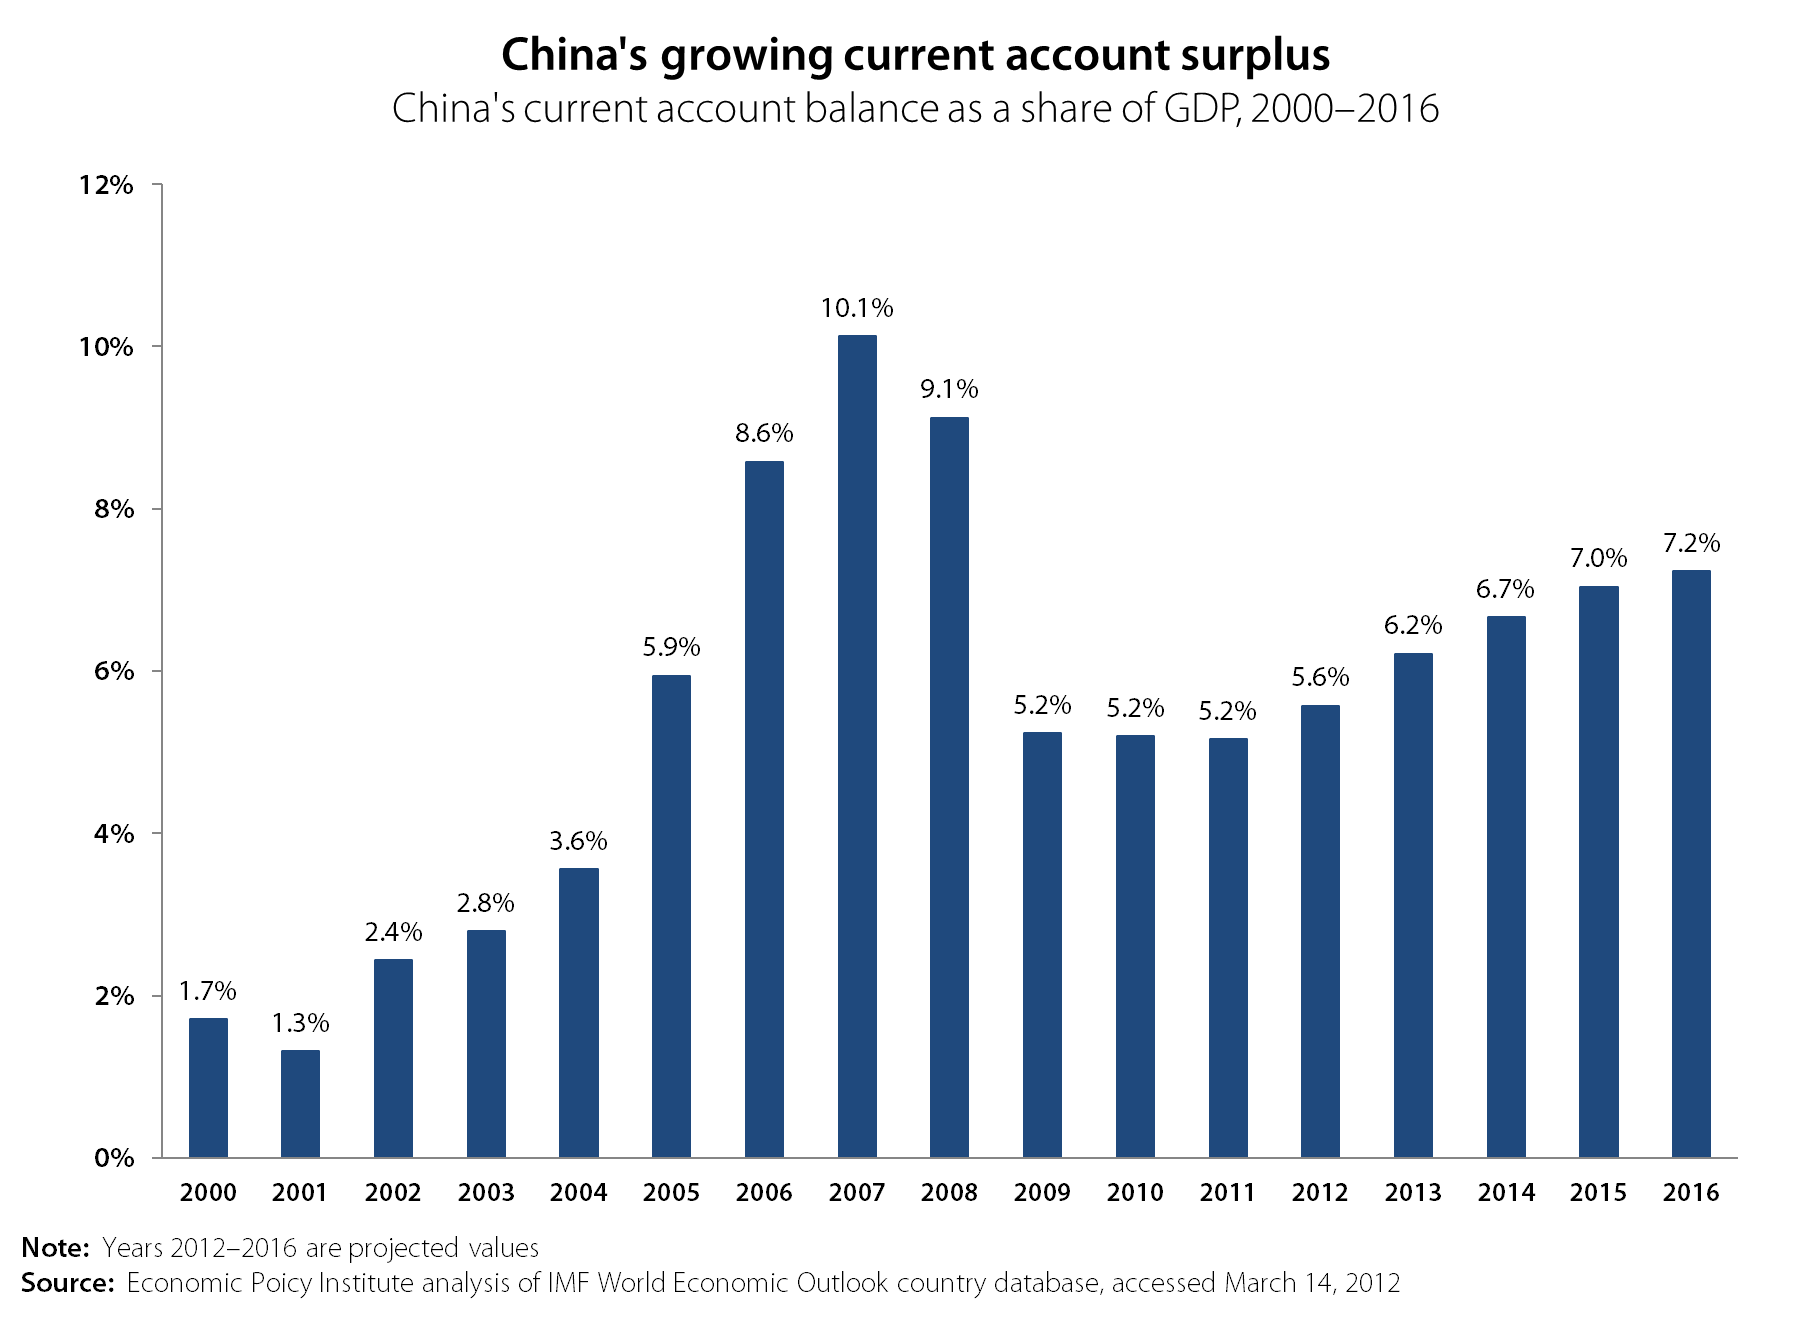
Chinese Premier Wen Jiabao claimed in remarks Wednesday that the yuan’s exchange rate may be close to an equilibrium level. Premier Wen claimed China has already achieved basic balance in international payment, which he defined as a current account surplus below 3 percent of gross domestic product. However, recent data and forecasts from the International Monetary Fund show that although China’s current account surplus is still recovering from the recession, it has never fallen below 5.2 percent of GDP. The IMF projects that China’s current account balance will increase to 7.2 percent of GDP by 2016.
Recent estimates by William R. Cline and John Williamson of the Peterson Institute show that China’s currency remains at least 24 percent undervalued relative to the U.S. dollar. Although China’s currency has been allowed to fluctuate against other currencies, China firmly controls the value of the yuan against the dollar, because the United States is the chief market for China’s exports. Recent appreciation in the yuan (also known as the renminbi) has not been sufficient to reduce China’s global trade surplus to a sustainable level. In 2011, the U.S. trade deficit with China reached $301.6 billion, 14.6 percent more than in 2010. In Jan. 2012, the monthly U.S. trade deficit with China increased again to $26.0 billion, an increase of 12.6 percent over levels in Dec. 2011.
China invested over $330 billion in purchases of new foreign exchange reserves in 2011, and historically about two-thirds of those reserves have been held in U.S.-dollar denominated assets. China is illegally intervening in foreign exchange markets to artificially suppress the value of its currency against the dollar and other currencies. This acts like a subsidy on all Chinese exports, and a tax on all U.S. exports to China. It also limits U.S. exports to every other country in the world because China is our top competitor in world export markets.
History demonstrates that China will not significantly revalue the yuan unless it is faced with threats of significant tariffs or other trade restraints. Congress threatened to impose tariffs in 2005, when the currency was even more undervalued, and China began to revalue but then stopped. Now, China is declaring the problem solved when in reality, it’s far from solved.
Paul Krugman has denounced China for its “predatory” trade policies. Fred Bergsten has described China’s currency intervention as the “largest protection measure adopted by any country since the Second World War – and probably in all of history.” Taking strong measures to end China’s currency manipulation will be good for Chinese consumers because it will lower prices of oil and other commodities in China. It will also create more jobs in the United States and other countries, because it will increase exports and shrink trade deficits. The time has come for the United States to declare China a currency manipulator and to threaten large, across-the-board tariffs unless and until they revalue enough to shrink their massive global trade surpluses.
U.S. sends the right message with WTO complaint on China’s illegal restrictions on rare earth exports
The Obama administration filed a complaint on Tuesday at the World Trade Organization challenging China’s restraints on its exports of rare earth minerals. This much-needed action will be good for both consumers and workers in the United States and other countries. China reacted immediately, promising to defend its actions and threatening that it could trigger further trade disputes. China’s export restraints are a clear violation of its WTO obligations, and it doesn’t have a leg to stand on in this dispute. Ending those restraints will lower prices for a wide range of high-tech products such as solar cells and hybrid and electric vehicles, and it will stimulate job creation in the United States.
The administration’s trade complaint covers tungsten and molybdenum (minerals used in steel production) in addition to rare earths, and includes over 100 specific products. Under the terms of its accession to the WTO, China was allowed to retain export duties at specified rates on 84 commodities. However, it maintains tariffs as well as quotas and other illegal restrictions on exports on rare earths and other metals. China controls 95 percent of the world’s production of rare earths minerals, which are critical ingredients in high-tech manufacturing of products ranging from smartphones to hybrid cars to missiles. None of the items covered in the administration’s WTO complaint are included in the list of 84 items that China is entitled to restrict with export duties.
Production of rare earths can be damaging to the environment. In 2009, China stopped issuing new licenses for rare earth mines, closed some illegal mines and set domestic production caps. If applied with equal effect to domestic and export sales, such restrictions would be legitimate under the WTO. Higher prices for rare earths will eventually encourage production in other countries that have large deposits, such as Australia, Brazil, Canada, Greenland, South Africa and the United States, but new mines will take five or more years to develop.
By restricting and taxing rare earth exports, China reduces the costs of these critical materials for their own domestic producers and raises the costs for producers in the rest of the world. Japan and the EU jointly filed the WTO case with the United States. Recent industry data show that the export price of a basket of rare earths from China was more than 120 percent higher than China’s domestic price for the same basket of minerals. Thus, China’s rare earth restrictions unfairly tilt the playing field in favor of its own domestic producers and raise the cost of high-tech products to consumers in the U.S. and other countries. Three U.S. manufacturers of photovoltaic cells, including Solyndra and Everygreen Solar, have recently declared bankruptcy in the face of cut-throat, subsidized competition from Chinese manufacturers who benefit from plentiful access to cheap rare earths.
China’s illegal policy of restricting rare earth exports is just one of many examples of its unfair trade practices. Massive subsidies to key industries such as auto parts, glass and paper are also hurting domestic industries, and currency manipulation by China and other Asian countries has cost the United States millions of jobs. We applaud strong action by the administration in these cases and look forward to continued strong enforcement of all U.S. fair trade laws by the administration’s planned Interagency Trade Enforcement Center.
–The author thanks Monique Morrissey for comments
The myth of the rich, hungry Chinese consumer
The lead article in Monday’s business section of the Washington Post on the reported “boom” in U.S. exports to China painted an inaccurate and distorted view of U.S.-China trade. Headlined by a photo of Chinese Vice President Xi Ping visiting an Iowa family farm in February, the article claimed that a “richer China” has a “growing appetite for … American soybeans, cars, airplanes and medicine.” While the article does acknowledge the soaring U.S. trade deficit with China, it claims that such exports are a “bright spot.” In fact, those exports are swamped by soaring imports and trade deficits with China, which displaced 2.8 million U.S. jobs between 2001 and 2010 alone.
Review of actual trends in U.S. exports to China paints a very different picture than the one described in the Post article. Waste and scrap were the fastest growing U.S. exports to China, increasing $3.0 billion in 2011 (25.8 percent). The growth in agricultural products ranked a distant fifth on this list, increasing $0.9 billion (6.0 percent). Of the 10 fastest growing exports to China, seven were unprocessed commodities (as indicated by the black bars), including paper products, because 61.0 percent of U.S. paper exports to China in 2011 were unprocessed wood pulp. The vast majority of such exports are used as inputs for making paper and other products for export, not for Chinese domestic consumption. Overall, although total U.S. exports to China increased $11.2 billion in 2011, imports increased by $34.4 billion and the trade deficit increased $23.3 billion. U.S. export of raw materials so that China, not the United States, can make higher value-added industrial products is an ongoing recipe for the decline of American manufacturing and for North American economic failure.
The Post cites unnamed experts who claimed that the main reason for the increased exports “is a booming China where wealthier tastes include an increased appetite for meat—and hence for soybeans used as livestock feed.” The growth in demand for grains pales in comparison to China’s voracious appetite for waste, paper and metal scrap, chemicals, minerals and ores and raw wood—commodities China turns into job-displacing exports. The rapid growth of Chinese exports to the U.S. and the world are the source of China’s growing wealth, and such wealth has not resulted in exports to China growing “exponentially” (e.g., faster and faster each year), another flawed claim from this report. Exports in 2011 increased at the third-slowest rate since China joined the World Trade Organization in 2001. Export growth was slower only in the recession years of 2008 and 2009. Sadly, our exports to China are more closely tied to China’s demand for U.S. raw materials for its own production and exports than to Chinese consumers’ appetites for our products.
This story would be a good candidate for review by the Post‘s Fact Checker. We give it three Pinocchios.

— The author thanks Ross Eisenbrey and Doug Hall for helpful comments and Hilary Wething for research assistance.
Charles Murray’s failure by design
It is not at all clear what problem Charles Murray is trying to solve in his New York Times piece Narrowing the New Class Divide. But it can’t possibly be the economic inequality that has been growing for the last 30 years. While it is important to equalize the opportunity to internships, no one serious about addressing economic inequality would put this as one of their top four policy recommendations. The same can be said about Murray’s other three ideas.
My colleague, Josh Bivens, presents real policies to address America’s economic inequality in his book Failure by Design. Any one of Biven’s policies listed below would have a larger impact on reducing inequality than all four of Murray’s “solutions.”
- A higher and indexed minimum wage
- Strengthening workers’ right to organize
- Guaranteed retirement and health security
- A national and more democratic response to globalization
- Restricting the excesses of the financial sector
- Managing international capital flows
- Investments in infrastructure, including educational infrastructure
- A national commitment to achieving full employment
- A national commitment to addressing racial inequality
These are the proposals of someone seriously concerned about economic inequality. Murray, on the other hand, selects policies which he admits at the outset “would not do much good.”
Murray’s last book, The Bell Curve, argued that nothing could be done about inequality because it was all genetic. That argument did not go over too well. He has repackaged his thesis, but he is still arguing that nothing can be done to address inequality. But we know better.
High-scoring, low-income students no more likely to complete college than low-scoring, rich students
In the New York Times on March 7, Charles Murray offers some solutions to the class divide, then dismisses them nearly as quickly as he mentions them on the grounds that they wouldn’t actually work or aren’t necessary. Whether his facts on the class divide are accurate is not the subject of this post, but rather a closer look at a couple of his “solutions.”
Murray makes some decent points about the problems with unpaid internships and the benefits they may afford only those who come from families wealthy enough to allow such experiences. Aside from offering children of well-off parents the ability to pad their resume with unpaid internships , my colleague Ross Eisenbrey argues further that illegal unpaid internships are a scourge on the labor market. Murray rightly states that, “Internships that pay the minimum wage are still much more feasible for affluent students than for students paying their own way through college.”
The part of his article that I take issue with are his arguments about access to higher education. Murray suggests replacing ethnic affirmative action with socioeconomic affirmative action (an argument for another day), then later dismisses it as unnecessary, because “a high proportion of academically gifted children from the working class already get scholarships to good schools.” Let’s take a look at the evidence.
The relevant issue is the quality of education accessible to children from families in different positions in the income scale. The figure below compares the family income of children in the entering classes at top-tier universities. Nearly three-quarters of those in the top-tier universities come from families with the highest incomes, while 3 percent and 6 percent of the entering class come from the lowest and second lowest income groups, respectively – or, the bottom 50 percent of families.

Still, Murray might argue that those findings represent meritocracy at work, as those from high-income families have, perhaps through their privileged positions, acquired the intellectual tools to succeed at top schools. The second figure belies this argument. This figure shows that even after controlling for academic ability, higher income children are still more likely to complete college. Each set of bars shows the probability of completing college for children based on income and their math test scores in eighth grade. For example, the first set of bars (for the students with the lowest test scores) shows that 3 percent of students with both low scores and low incomes completed college, while 30 percent of low-scoring children from high-income families managed to complete college.
The fact that college completion is higher for each successive income group among similar scoring students is evidence against a completely meritocratic system. The pattern implies that at every level of test scores, higher income led to higher completion rates. The key comparison in this figure is the fact that high-scoring students from low-income families complete college at nearly the same rate as low-scoring, high-income students (29 percent vs. 30 percent). In other words, high-scoring, low-income children are no more likely to complete college than low-scoring, rich children.

In no way do these data suggest that a high proportion of children (gifted or not) from low-income families achieve placement or completion at universities (and definitely not top schools).
Are Liberal Arts majors dragging college grads down?
James Pethokoukis responds to the Wall Street Journal coverage of my analysis of entry-level wages of recent college graduates by implying that the erosion of wages earned by new college graduates is because there are too many Liberal Arts majors. Here’s the chart the Journal published:

The remarkable thing about recent college graduates is that the wages they earn early in their careers fell over the prior business cycle, 2000-07, as well as in the recession. This is the case for both men and women. As usual with Pethokoukis, he does not really supply any data directly on point. Instead, he lists a number of random items about college enrollment and STEM (science, technology, engineering and math) degrees as reported by Alex Tabarrok in a recent Chronicle of Higher Education story. In the piece, Tabarrok asks, “If students aren’t studying science, technology, engineering, and math, what are they studying?”
Since Pethokoukis doesn’t supply it, here are data on the distribution of fields of study by young college graduates, ages 18-29, in 2001 and 2009 from the Census’ Survey of Income and Program Participation (SIPP):
| Degree field | 2001 | 2009 |
| Business | 17.9% | 19.6% |
| Engineering | 6.2% | 5.9% |
| Education | 9.5% | 8.8% |
| Math/Science/Computer/Architecture | 20.1% | 19.7% |
| Liberal Arts/Social Science/Philosophy | 12.4% | 11.4% |
| Literature/Communications/Language | 8.5% | 8.3% |
| Other | 17.9% | 19.7% |
| Misc* | 7.6% | 6.6% |
| Source: Analysis of Census SIPP data for 2001 and 2009 | ||
| *Population where highest degree is a bachelor’s degree | ||
There’s been no big change in the distribution of fields between 2001 and 2009 that could have led to the fall in wages of recent college graduates relative to those in entry-level jobs in 2001. There are somewhat fewer STEM graduates in 2009. However, wages should have been lifted by the expansion of business majors. To see how all of the changes in composition might have affected wages, I did a shift-share analysis of the field distribution in 2001 and 2009, asking, ‘How has the change in the composition of fields affected the average wage?’ If the 2009 composition (across 18 different majors) of employment across fields prevailed in 2001 at the wages of each field in 2001, then the average wage would have been … drum roll … 0.1 percent higher. That is, the impact of changes in the composition of fields over the 2001 to 2009 period was ABSOLUTELY NOTHING. The drop in entry-level wages happened within the particular fields of study, not because of the fields that students studied.
Are Liberal Arts majors dragging everyone down? The SIPP tabulations provided by Census do not have wage data by field for young workers but they do for all workers. The monthly earnings of full-time workers (using Table 4C in 2001 and 2009) with a Liberal Arts degree grew 19.8 percent in inflation-adjusted terms from 2001 to 2009. I suspect that Liberal Arts majors aren’t sabotaging America’s wages.
Oddly enough, I sort of agree with Pethokoukis’ bottom line. He says:
“And rather than pushing students to attend a four-year, brick-and-mortar college in pursuit of the BA, how about business-backed training and apprenticeship programs leading to a high-skill technical degree just like in Germany and some other northern European nations? … More education for all. But not college for all.”
As I wrote in the New York Times’ Room for Debate last week, College Is Not Always the Answer. My bottom line: “We need a nation that has and values all sorts of work and skills, which means providing decent pay and benefits for many types of jobs.”