Alan Simpson isn’t ‘saving Social Security’
Alan Simpson is at it again. Launching another off-color attack on people who oppose the Bowles-Simpson plan to bomb Social Security in order to save it, Simpson claims he is saving it for young people who would otherwise be “gutted.” In fact, Simpson’s overarching desire to protect rich Americans from paying their fair share of Social Security taxes (if wealthy earners paid FICA taxes on all of their income, most of Social Security’s solvency problems would be solved) leads him to propose cuts in Social Security almost as large as the automatic benefit reductions that will occur in 2033 under current assumptions.
According to an analysis of the Bowles-Simpson plan by Social Security’s chief actuary, middle-class workers with average earnings over the course of their careers (around $43,084 in 2010) would see a 22 percent cut in benefits by 2080, not significantly different from the 23.5 percent cut in benefits these workers would face if nothing were done to shore up Social Security’s finances. Our children and grandchildren will lose critical benefits under Simpson’s plan, while seniors like him are mostly protected.
Notwithstanding Simpson’s crocodile tears for young people, under the Bowles-Simpson plan, if someone who is born in 2015 retires at age 65 with a middle-class income in 2080, Social Security will replace only 28 percent of their pre-retirement earnings. By contrast, a 65-year old who retired in 1980 replaced 49 percent of pre-retirement earnings. It is Simpson himself who wants to gut the Social Security of coming generations.
Latinos and the good jobs crisis
This post originally appeared in the Huffington Post
If Latinos are to fully recover from the ravages of the Great Recession, they will need not simply jobs, but jobs that lead to increased earnings over time and that also have good benefits. In short, they will need what we call “good jobs.” Recent evidence from EPI research on state and local public sectors portends that getting good jobs will continue to be a major challenge for Hispanic workers.
From 2007 (the year the recession started) to 2011, Latinos workers’ wages in state and local public sectors declined more than the wages of whites and African Americans. The median wage of Hispanic employees declined 5.2 percent, compared with a decline of 1.9 percent for African Americans, and 0.7 percent for whites.
Since the 1970s, the rich have been getting richer as the rest of America has been suffering from a good jobs crisis. Wages have declined or stagnated and benefits have been cut. Just about everyone on Main Street has been hurt by the decline in the share of good jobs, but Hispanic men have been hit the hardest. From 1979 to 2008, the share of Hispanic men in good jobs declined 15.5 percent. For white and black men respectively, the declines were 12.8 percent and 9.3 percent.
Without a good job, it is very hard to keep one’s family out of poverty. A third of Hispanic children are living in poverty, nearly three times the rate for white children. Since the start of the recession, Latino child poverty has increased the most of the major racial and ethnic groups. To lower this high rate of poverty, we need to increase the wages of Hispanic workers. Unfortunately, Hispanics lead in the share of workers earning wages that cannot lift a family out of poverty.
In terms of benefits, Latinos are also in a dire situation. Hispanics have the lowest share of workers with employer-sponsored health insurance. Given that Latinos are underrepresented in good jobs that provide a retirement plan and overrepresented in jobs that do not provide enough for savings, it is not surprising that Latinos are very weak on measures of retirement security. The fact that Latinos have lost a significant amount of wealth over the recession does not improve the situation.
What can be done to produce more good jobs in the American economy and more good jobs for Latinos specifically? I discuss several policies in Getting Good Jobs to America’s People of Color, but here I will only address one: unions.
Recently, Knowledge@Wharton, the online business journal of the Wharton School of Business, published State of the Unions: What It Means for Workers — and Everyone Else (May 9, 2012). This article provided information about how a strong union movement helps provide good jobs.
Good jobs require good wages. Knowledge@Wharton cited recent research that has shown that the decline in union membership since the 1970s has played a significant role in the growth in income inequality. The journal quoted the sociologist Jake Rosenfeld, who observed, “It is hard to think of a way to tackle income inequality without a vibrant labor movement.”
Unions also help create good jobs by fighting for worker’s rights and for worker benefits. Wharton Professor Janice Bellace noted, “If you think of major pieces of legislation that have been very important to working persons, you will often see that the legislation was pushed by unions. The Employee Retirement Income Security Act of 1974 (ERISA) . . . was pushed by the unions and almost no one else. And the Pregnancy Discrimination Act of 1977 . . . was brought by the International Union of Electrical Radio and Machine Workers.” She added that unions are truly the “national voice for the average working person.”
Without a strong union movement, and without increasing Latino unionization, it will be difficult, if not impossible, to reverse the decline in good jobs in America. While all racial and ethnic groups are hurting from this decline, Latinos have been hurt the most.
Don’t let Congress fast-track another tax cut
House Speaker John Boehner’s (R-Ohio) high-profile speech at last week’s 2012 Fiscal Summit garnered much attention for its pledge to again hijack the debt ceiling; less noticed was his announcement that the House of Representatives will establish a fast-track process for expediting “tax reform.” Comprehensive tax reform could add much needed revenue and balance to a long-term deficit “grand bargain,” but that’s not what Boehner is talking about:
“If we do this right, we will never again have to deal with the uncertainty of expiring tax rates. We’ll have replaced the broken status quo with a tax code that maintains progressivity, taxes income once, and creates a fairer, simpler code. And if we do that right, we will see increased revenue from more economic growth.” (Full text here.)
Anything resembling the tax plan recommended by Ways and Means Committee Chairman Dave Camp (R-Mich.) and included in Budget Committee Chairman Paul Ryan’s (R-Wis.) fiscal 2013 budget resolution—Boehner’s chief fiscal policy deputies—is going to have a devilishly hard time meeting this laundry list of talking points. That’s because conservatives falsely equate a “simpler” tax code with cutting and consolidating tax brackets, which would confer big tax cuts to upper-income households in the top tax brackets. This is the bedrock of the Camp-Ryan tax plan: “Consolidate the current six individual income tax brackets into just two brackets of 10 and 25 percent.” Short of unspecified offsets, this would sap progressivity from the tax code and deprive the Treasury of $2.5 trillion over a decade—accounting for more than half of the $4.5 trillion of unfunded tax cuts proposed in the Ryan budget. Combined with the other major tenants—repealing the alternative minimum tax (AMT), cutting the corporate tax rate to 25 percent, exempting foreign profits from taxation, and repealing health care reform—the tax code would be markedly flattened at the top of the income distribution, as seen in the Tax Policy Center’s (TPC) analysis of the Ryan budget, again short of unspecified offsets:

The red bars show what regressive upper-income tax cuts and lower-income tax increases look like, not what tax reform looks like. The missing element is how the tax cuts would be financed—i.e., which unspecified tax expenditures would be eliminated in “broadening the tax base.” House Republicans object to eliminating or even scaling back the preferential tax rates on capital gains and dividends—the tax expenditures most disproportionately benefiting upper-income households—which would be the only feasible way to maintain progressivity at the top of the income distribution with a top rate of 25 percent and no AMT. Repealing exclusions—like that for employer-sponsored health insurance—would hit middle- and upper-middle class households a lot harder than upper-income households, and repealing refundable tax credits would wallop only lower- and middle-income households (see Table 2 of this TPC report). Itemized deductions are more regressive, but nowhere nearly as regressive as the preferential treatment of capital income. If substantial base broadening were added to the Camp-Ryan tax plan without raising rates on capital income, either substantial progressivity or revenue (likely both) would be lost relative to current policy. Many lower- and middle-income households would effectively foot the bill, subsidizing more upper-income tax cuts.
With respect to the budget, relying on “economic growth” for more revenue translates to, at best, revenue-neutral tax reform relative to the inadequate levels raised by current policy. Official scorekeepers—the Congressional Budget Office and Joint Committee on Taxation—rightfully reject the kind of “dynamic scoring” (i.e., changing economic projections and budget scoring based on potential macroeconomic effects of tax cuts) Boehner and others would cite to show more revenue. Economic growth is the only source of “increased revenue” that would not violate Grover Norquist’s Taxpayer Protection Pledge—signed by 236 members of Boehner’s caucus—because it’s a gimmick, not a revenue source, as my colleague Ethan Pollack recently explained.
Lastly, Boehner’s implied objectives of revenue and distributional neutrality—which guided the Tax Reform Act of 1986—are now wholly inappropriate benchmarks, as they would lock-in the past decade’s unaffordable and regressive Bush-era tax cuts and exacerbate Gilded-Age levels of income inequality. Much of our structural budget deficit and the ad hoc state of temporary tax cuts’ pending expiration stem from the 2001 and 2003 Bush-era tax cuts, which were, in a sense, “fast-tracked” with reconciliation (around the filibuster). Financing an extension of the Bush tax cuts with spending cuts (essentially maintaining revenue around 18 percent of GDP), as the Ryan budget effectively proposes, would require draconian spending cuts. Reducing revenue below current policy levels—the more likely outcome of the Camp-Ryan plan—would require implausibly deeper cuts and exacerbate the unsustainable long-run fiscal trajectory, grossly contradicting purported concern about budget deficits.
If Congress really is heading toward comprehensive tax reform in the next few years, policymakers need to be kept honest about what amounts to reform versus a tax cut. The United States simply can’t afford to let Congress fast-track another tax cut disguised as “tax reform.” And House Republicans are currently $4.5 trillion shy of proposing even revenue-neutral tax reform.
What happens if you tighten your belt …
… but don’t lose any weight? You get unsightly bulges elsewhere and can’t breathe well enough to exercise.
That’s essentially the House Republican solution to the long-term budget challenge of escalating health care costs: Shift costs to individuals, and do it in a way that impedes measures that could actually help control costs in the long run.
Nevertheless, belt-tightening is the latest weight-loss fad to hit Washington, prompting Robert J. Shiller to ask in yesterday’s New York Times, “Why is there such strong political support for fiscal austerity, for government cuts and layoffs, at a time of widespread unemployment?”
Shiller thinks the reason austerity has caught on (at least inside the Beltway) is that the other side has better metaphors, like belt-tightening. His proposed alternative—”winter on the family farm“—may not resonate in a non-agrarian economy, but his point is a good one: When there’s no planting, fertilizing or harvesting being done, it’s time for infrastructure projects to make productive use of idle labor.
It’s not even necessary to increase the deficit, though this would be the quickest way back to full employment. Raising taxes to pay for infrastructure and education would still create jobs, because all the money would be spent, whereas some of the income that was taxed would have been saved. This is especially true if the taxes fall on higher-income households. These investments would also pay off in the form of a more productive economy in the long run.
Alas, Shiller notes that despite the fact that a balanced-budget stimulus was endorsed in the International Monetary Fund’s 2012 World Economic Outlook, politicians espousing such measures, such as France’s François Hollande, aren’t taken seriously. Meanwhile, extreme and counterproductive measures put forward by House Budget Chairman Paul Ryan (R-Wis.) have shifted the window of policies considered to be within the political mainstream in the United States, even though Ryan would actually reduce taxes on the wealthy and slash public investment. The House Republican budget may be a non-starter, but so too—for the time being—are balanced-budget measures to get the economy moving again.
Speaker Boehner pledges to hijack the debt ceiling and jeopardize recovery again
At this week’s Peter G. Peterson Foundation 2012 Fiscal Summit, an event dedicated to avoiding the merest possibility that the United States could ever find itself in a sovereign debt crisis, Speaker of the House John Boehner (R-Ohio) was invited to address the assembled crowd, wherein he pledged … to try to maximize the possibility of a sovereign debt crisis.
Specifically, he pledged a repeat of last summer’s showdown over the statutory debt ceiling, when congressional Republicans concocted an artificial crisis of epic proportions, by refusing the historically pro forma task of raising the debt ceiling—done 73 times between 1940 and 2010—unless deep spending cuts were made. This time around, Boehner literally suggested that it would be more responsible to default on the full faith and credit of the United States than to increase the statutory debt ceiling without first hijacking the U.S. credit rating to extract spending cuts:
“Yes, allowing America to default would be irresponsible. But it would be more irresponsible to raise the debt ceiling without taking dramatic steps to reduce spending and reform the budget process… When the time comes, I will again insist on my simple principle of cuts and reforms greater than the debt limit increase.” (Full transcript here.)
Rather than indulge the revisionist histories of last summer invoked by Boehner and others at the Fiscal Summit, here’s a refresher on what happened with the last episode of economic and fiscal “responsibility.” First, Republican leaders demanded policy concessions before agreeing to raise the debt ceiling; after the Obama administration conceded to this, Republican leadership walked away from negotiations over a deficit reduction “grand bargain,” first with Vice President Biden, then from negotiations with President Obama. Republican leadership demanded a dollar in spending cuts for every dollar increase in the debt ceiling, refused any revenue increases accompanying spending reductions, and refused any compromise. Obama and Boehner formally negotiated a variation of these demands on July 31, two-and-a-half months after the Treasury Department declared a “debt issuance suspension period” of unconventional cash-management tools to avoid a sovereign default. The resulting Budget Control Act (BCA) cleared the Senate and was signed into law August 2, the last day Treasury could avoid defaulting.
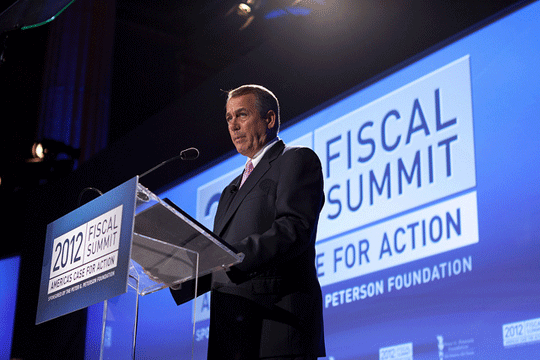
(From Flickr Creative Commons via SpeakerBoehner)
Shortly thereafter, rating agency Standard & Poor’s exercised “responsibility” in the Boehner sense of the word—i.e., trying to leverage the political debate over debt ceiling into concrete economic damage—by downgrading the U.S. “AAA” credit rating for the first time in history based on a judgment about dysfunctional politics (their economic justification was dropped after the Treasury Department found a $2 trillion error in their budget math). As for the “compromise” that ended the standoff, the BCA solidified Congress’ pivot from prioritizing job creation to prioritizing austerity measures like those that have pushed much of Europe back into recession, even though near-term cuts are largely to entirely self-defeating while the Federal Reserve keeps short-term rates at zero. My colleague Ethan Pollack and I estimated that the first phase of spending cuts would shave 0.3 percentage points from real GDP growth in 2012 and lower employment by 323,000 jobs; the second phase of front-loaded, automatic “sequestration” cuts scheduled for fiscal 2013 and beyond pose graver risks to growth and joblessness.
There are only two theoretical ways in which long-term deficit reduction can accelerate economic recovery. First (and actually plausible), a long-term deficit reduction “grand bargain” could include substantial near-term fiscal stimulus and gradually phase-in deficit reduction after some macroeconomic trigger is met (e.g., EPI proposed a “6-for-6” trigger: unemployment at or below 6 percent for six consecutive months). Second, deficit reduction could lower the premium on government borrowing, and thus private interest rates. This second channel actually has no hope of actually working today, as longer-term Treasury yields are already at historically low levels. Making all future increases in the debt ceiling completely uncertain and chaotic, however, will almost certainly impede both channels in the future.
And this strategy of promising to hold the full faith and credit of the United States hostage in exchange for spending cuts seems entrenched as the GOP strategy. This should not be mistaken simply for excessive zeal for cutting deficits; this is playing chicken with a self-induced sovereign debt crisis. Informed deficit hawks (and they exist—they just put vastly insufficient weight on solving the actually existing jobs crisis, in our view) endorse long-term deficit reduction as a means to avoid a sovereign debt crisis, not cause one.
The statutory debt ceiling has devolved from a pro forma vote into a global economic liability that Congress should put to rest. It seems clear that anybody interested in a sane economic policy regime should be looking for ways to repeal the debt ceiling, either in law or in practice. Time to bring on the $1 trillion coin?
Social Security advocates go on the offensive
In March, the AFL-CIO issued a call-to-arms on Social Security, saying, “We have to stop playing defense, because we have nothing to be defensive about.”
Advocates have taken up the challenge, coalescing around a strategy centered on eliminating the cap on taxable earnings, raising the cost-of-living adjustment (COLA) to reflect the higher out-of-pocket medical expenses faced by seniors, and increasing benefits across the board in ways that provide larger percentage increases for low-income beneficiaries. Building on a bill introduced in 2010 by Congressman Ted Deutch (D-Fla.) that included the first two of these measures, Senator Tom Harkin (D-Iowa) made them the centerpiece of the retirement provisions in his Rebuild America Act.
The three measures were also among the recommendations of a blueprint released last Friday by the Institute for Women’s Policy Research, the National Committee to Preserve Social Security and Medicare Foundation and the NOW Foundation that focused on women; and two of these measures (minus the COLA increase) were among the recommendations of the 2011 Commission to Modernize Social Security that focused on people of color. The Center for Community Change and the Task Force on Older Women’s Economic Security, who are expected to issue their own set of recommendations in the near future, will also include some of these measures.
It goes without saying that advocates are not just making a strong case for increasing benefits, but also pushing back against proposed cuts—hence the focus on the need for a higher COLA when many are arguing for a lower COLA based on a “chained” consumer price index.
The progressive blueprints also include provisions that target particularly vulnerable groups, such as caregivers, very low-income retirees receiving the special minimum benefit, and college and vocational school students whose dependent benefits were cut in 1981. There’s significant overlap among the recommendations, with relatively minor variations reflecting the groups’ constituencies and different strategic approaches to dealing with the revenue side of the equation (the Commission to Modernize Social Security presented a package that included sufficient revenue to close the projected 75-year shortfall and pay for all recommended benefit increases).
Advocates must balance the impulse to make the system more progressive and help under-served groups with the need to preserve its role as a universal, contributory, and work-based social insurance system. While it’s tempting to attach many items on the progressive wish list to such a popular program (and, admittedly, this is a good way to grow a coalition), progressives also need to resist deficit hawks’ attempt to re-brand Social Security as a safety net program for the poor, which would doom the program in the long run.
One way to do this is to focus on policies that help everyone, but especially matter to low-income groups, such as replacing 95-100 percent of the first $767 in average indexed monthly earnings rather than 90 percent (one of several variations on the across-the-board benefit increase mentioned earlier). Another is to focus on proposals that can be framed as tweaks or extensions of the existing system, such as equal benefits for same-sex couples as proposed by Rep. Linda Sanchez (D-Calif.) (an issue also flagged in the progressive blueprints). Though this generally argues against major changes or additions to the system, some proposals to take Social Security in new directions—such as providing for paid family leave—could conceivably enhance Social Security’s popularity rather than weigh it down.
All of this is to say that there is a shared resolve among Social Security advocates—many of whom attended Tuesday’s protest at the “Fiscal Summit”—to fight cuts in the program while pushing for needed improvements. The one potential outlier is a certain 1000-pound elephant that sometimes thinks it wise to make nice with the poachers.
Misguided views of Social Security emerge at fiscal summit
Yesterday, I attended the third annual Peterson Fiscal Summit, a gathering sponsored by the Peter G. Peterson Foundation. The event brought together a number of inside-the-beltway folks to speak on the fiscal challenges facing this country, ranging from the fairly reasonable to the rather unreasonable. Speakers included Treasury Secretary Tim Geithner, President Bill Clinton, House Speaker John Boehner (R-Ohio), Rep. Paul Ryan (R-Wis.), and many others.
The focus this year, somewhat strangely, seemed to be on the wholesale acclamation of the Bowles-Simpson deficit commission report from Dec. 2010, The Moment of Truth. This represented somewhat of a departure from the previous year’s summit, when a fair deal of attention was paid to six very different long-term budget plans from organizations spanning the political spectrum (including this plan from EPI). While Bowles-Simpson was certainly present in 2011, it dominated the 2012 summit.
One rather startling moment came when President Clinton said the Bowles-Simpson proposals “[make] the Social Security system more progressive.” This statement alone—rather misguided—makes it worth revisiting the exact impacts Bowles-Simpson would have had on Social Security benefits, had it been adopted (or should it be adopted). First of all, in fairness, The Moment of Truth doesn’t hide its Social Security reform impacts, publishing a full distributional table on page 55 of the report. But back to Clinton. In calling Bowles-Simpson “progressive,” he is most likely referring to the fact that the provisions within would provide a very marginal bump (as seen in their distributional tables) to the very poorest Social Security recipients while significantly reducing benefits for the vast majority of recipients, including cuts for most low-income beneficiaries.
Clinton is relying on a technical definition of “progressive,” where even deep cuts to a critical government program can be called “progressive” as long as the cuts are larger for higher-income beneficiaries. But progressives should be wary to support this Social Security plan, even with the token bump for some of the lowest earners. Not only does it include draconian cuts for middle-class recipients through a change in the benefit formula and an increase in the full retirement age (this is equivalent to an across-the-board cut because benefits are reduced at any given retirement age), but it would also reduce the cost-of-living adjustment by about 0.3 percentage points per year, lowering lifetime benefits for recipients by about 3 percent on average. This last cut would disproportionately affect the oldest beneficiaries, who are also among the poorest beneficiaries. These cuts would be on top of the 13 percent cut that is gradually being implemented as the full retirement age increases from 65 to 67, a change dating to the early 1980s that takes full effect with the generations born in 1960 and later. Lastly, it’s worth noting that the “progressive” description of this plan only works if one looks at the dollar-value of the Social Security cuts. If one instead scales the cuts as a share of a household’s total income, it is far from clear that even this forced definition of “progressivity” would hold. The chart below, from StrengthenSocialSecurity.org, illustrates estimated impacts to benefits under Bowles-Simpson.

What was also disappointing was hearing some in the room speak to the fact that raising the retirement age for Social Security was an easy and appropriate way to improve Social Security’s finances just because people are living longer these days. In reality, not all people have the luxury of working in positions where it is realistic to maintain employment as one ages. Aside from those who must quit work due to health issues or to care for an ill spouse or family member, many older workers have jobs where they stand a good portion of the day, or engage in even more physically-demanding activities. Nor is everyone living that much longer; recent gains in life expectancy have been concentrated among those with high incomes and more education. The figure below (reproduced from the EPI paper, Beyond ‘normal’: Raising the retirement age is the wrong approach for Social Security) illustrates that between 1982 and 2006, life expectancy increased by one year for men in the bottom half of the earnings distribution, and five years for those in the top half of the earnings distribution. Lower-income workers would also be the most hurt by an increase in the retirement age, or any other across-the-board benefit cut, because they rely most heavily on Social Security benefits in old age.

Bernard ‘B’ Rapoport remembered
Last night’s memorial service for Bernard Rapoport at the St. Regis Hotel in Washington brought together hundreds of his family members, friends, and colleagues. Everyone in attendance treasured his enthusiasm, generosity, and thirst for economic justice and fairness. “B,” as he was affectionately known, founded American Income Life Insurance and was one of EPI’s longest-serving board members. I was privileged to attend a service that mixed politics, religion, and humor in a celebration of a life well lived.
MORE: EPI statement on Rapoport’s passing
President Bill Clinton topped a list of past and current Democratic politicians who spoke of B’s loyalty, persistence, and progressive values. As Sen. Tom Harkin (Iowa) remarked, B was the rare political donor who pushed politicians and the government to demand more from the rich, rather than to cater to them. B was born poor (unlike most rich people), yet he never deluded himself into thinking that he was a self-made man. He knew that the government and our system of laws, the education he received, and his employees were all critical to his success.
Despite being a millionaire and a CEO, B never bought into the notion that as a “job creator” he was entitled to a lower tax rate than the folks who worked for him. He never thought that the government owed him anything. He also vehemently rejected the belief that the nation would be better off if the rich got continually richer at the expense of the many. As President Clinton said, B never tuned in to the message of greed and egotism that has characterized the last 35 years of politics in Washington.
Instead, B learned and subsequently taught a very different lesson: “As I grew up I realized when too few have too much and too many have too little, we do not have a sustainable society.”
Addressing unfair expectations for the next wave of educators
I regularly encounter, as I travel around the country, teachers who are dispirited by what they feel is an unrestrained contempt for their calling and career. These teachers feel that this contempt, initially expressed by politicians and “experts” with no classroom experience, has been repeated so frequently that it has spread to the public at large. They feel they are being blamed for all the inequities in American society, and are expected to rescue children from impoverished families and communities with no support from others in society. They feel abused by demands that they discard curriculum it has taken them years to develop, curriculum they are convinced has inspired children who had little prior interest in school, to love learning and inquiry. They do not believe that requirements that they focus on preparing students for standardized tests is respectful of the educational process or their own expertise, because such tests reflect only a tiny part of the knowledge and skills children need. These teachers are embittered and feeling put upon by those who claim to represent the interests of poor children but express this interest by trying to destroy the public education system that is the only institution attempting to serve these children. The teachers I meet all consider some colleagues to be inadequate and would like to see them leave. But the teachers I meet insist that poor performers are a small minority in their schools, and resent the now-popular and, they feel, indiscriminate witch hunt to cleanse schools of incompetents.
Last week, I addressed the 2012 graduates of the School of Education of Loyola University–Chicago. Anticipating (correctly, as it turned out) that these young people shared many of the feelings of the experienced teachers I have described, I urged these students to have the confidence to resist the now-conventional attack on public education and their teachers. Here is what I said to them:
Thank you, Dr. Fine, President Garanzini, Dean Prasse, faculty, parents, and guests.
Congratulations to the graduates.
Good luck as you embark on new responsibilities in one of the most important enterprises with which our society can entrust you – the preparation of the next generation.
Yet you leave here in a national climate of mistrust for all government, including public education. You are entering a highly politicized field where facts are too easily ignored.
In medicine, and in all fields, we know you can’t design proper treatment if your diagnosis is factually flawed.
Yet in education, conventional and widely shared diagnoses are based on fantasy, with little relation to facts.
Understanding these fantasies requires you not only to be good educators, but sophisticated citizens, capable of questioning data and penetrating the relationships between schools and the society that they reflect.
Politicians of both parties, leading educators, and philanthropists like Bill Gates who increasingly influence education policy, repeat incessantly that our schools are failing, especially for disadvantaged children. Past efforts at improvement, and vast increases in spending, have accomplished little or nothing, they say. Achievement gaps between disadvantaged and middle class students have narrowed little, so as the proportion of white children declines, this failure of our schools weakens our nation, rendering it unable to compete internationally.
In truth, this conventional view relies upon imaginary facts.
You may be surprised to learn that African-American elementary school student achievement, in Illinois and nationwide, has been improving so spectacularly that in math, the average black student now performs better than about 90% of all black students performed less than a generation ago.
What’s more, black elementary school math performance is now better than white performance was in the previous generation.
Let me repeat: black elementary school students today have better math skills than white students did only twenty years ago.
These data come from the National Assessment of Educational Progress, a federal sample that is the only reliable source on student achievement over time in this country.
The gains have been almost as great for middle-schoolers in math, and for elementary school students in reading,
Most gains were posted in the 1990s, before the test-obsessed accountability system called “No Child Left Behind,” a law whose flawed premise was that it was necessary to force educators to pay attention to minority students. Read more
Video: Cambridge Forum discussion on the U.S. and globalization
The Cambridge Forum hosted a videotaped mini-conference on the impact of global engagement on the U.S. and world economies on April 16. Speakers and topics included University of Massachusetts Amherst economic professor Robert Pollin on the “Globalization of Labor: Is a Race To the Bottom Inevitable?”; Economic Policy Institute Director of Trade and Manufacturing Policy Research, Robert Scott, on the “Globalization of Capital: The Rise of the Multinationals”; editor-at-large of The American Prospect and Washington Post columnist Harold Meyerson on the “Globalization of Markets: Do Corporations Need American Consumers?”; and Harvard Kennedy School of Government Professor of International Political Economy Dani Rodrik, who delivered the keynote address on his book, The Globalization Paradox (New York: W.W. Norton & Company, Inc.).
Each participant delivered brief remarks and engaged in wide-ranging question-and-answer sessions with the audience that were moderated by Robert Kuttner, co-founder of The American Prospect (Note: Kuttner is an EPI co-founder and board member). You can watch videos of all four speakers below:
