The myth of rising domestic spending strikes again!
I happen to love Kevin Drum’s blog, so I hope he takes this as a helpful correction. In a post yesterday, he echoed the very important point from the Center on Budget and Policy Priorities that there hasn’t been an “explosion of government’s size,” but rather that over the last few decades, health costs and demographics have driven primary (i.e., non-interest) spending trends. But then he went on and veered toward an issue very near and dear to my heart: domestic spending. Quote:
“Assuming I did my sums properly, federal spending on ‘everything else’ — that is, everything except Social Security, Medicare, and interest on the debt — has indeed gone down from 15.2% of GDP in 1962 to a projected 11.3% of GDP in 2017. (That’s from Table 3.1 here.) However, the national defense piece of that has declined from 9.2% to 2.9%, while the nondefense piece has increased from 6.0% to 8.4%. There are some arguments to be had about whether the defense piece of the budget is calculated correctly (it doesn’t include veterans benefits, for example), and it’s worth noting that healthcare costs are part of the nondefense picture too (mostly due to rising Medicaid expenditures). Still, the basic shape of the river doesn’t change much. Most of the downward slope in spending is due to lower defense spending. Domestic nondefense spending hasn’t gone up a lot, but it has gone up.”
Actually, the shape of the river changes pretty significantly if you take Medicaid, veterans benefits, and other security spending (i.e., homeland security, international affairs, and nuclear weapons security, which oddly enough is embedded in the Department of Energy) out of the domestic spending category. Throw Medicaid in with Medicare and Social Security (all part of the “health care costs and demographics” thesis) and include veterans benefits and other security spending in with the defense budget, and you get a very different picture. Yes, defense/security fell from nearly 11 percent of GDP in 1962 to 5.7 percent in 1979, but guess where it’s at now? About 6 percent of GDP. Domestic spending climbed from a little more than 4 percent in 1962 to about 7.7 percent in the late ’70s, but over the last few decades it’s actually fallen: Before the recession, domestic spending had actually declined to under 5 percent. It’s risen a bit because of the recession (e.g., more people qualifying for food stamps and unemployment insurance) and the Recovery Act, but by 2017 it is projected to fall to a near 40-year low.

In other words, there was a story to tell of defense/security spending falling and domestic spending rising, but all that happened before 1980. Since then, defense/security went up a bit during President Reagan’s Cold War build-up, down in the aftermath of the Soviet Union’s dissolution, and up again post-9/11 (wars aren’t cheap). As for domestic spending? It’s been pretty flat.
Nation, you’ll want to watch this
Update (2/29 10:18 a.m.): Watch video of Eisenbrey’s appearance on Colbert below.
***
Original post: Tonight’s episode of Comedy Central’s Emmy and Peabody Award-winning The Colbert Report will feature EPI Vice President Ross Eisenbrey. In what is sure to be a memorable and entertaining exchange, host Stephen Colbert and Eisenbrey, a labor and employment law expert, will talk about the troubling proliferation of unpaid internships in the workforce. Tune in at 11:30 p.m./10:30 p.m. CDT (check local listings) to watch Eisenbrey discuss the negative impacts of this growing labor practice.
Over the past decade, the illegal use of unpaid interns has exploded with little protest. Unpaid internships don’t fairly reward hard work, block economic mobility and leave young workers in danger of exploitation.
EPI has highlighted the inadequate regulation of student internships and detailed why it is wrong, particularly with respect to for-profit employers not paying interns for their work. Serving as a crucial voice, our research and advocacy has garnered attention from government enforcement agencies, universities, and multiple major media outlets.
MORE: EPI’s work on unpaid internships
Rein in the debt tax preference, raise some revenue
As a follow-up to my earlier post on the revenue implications of the Obama administration’s corporate tax reform framework, there is a major escape valve for turning at-best revenue-neutral tax reform into appropriately revenue-positive reform. In its framework, the administration singled out the deductibility of interest payments as one of the key imbalances in the tax code, along with distortions across industries’ effective tax rates, distortions among businesses’ organization (i.e., pass-through entities versus C-corporations), and distortions favoring offshoring. (The Center on Budget and Policy Priorities’ Chuck Marr has a good overview of this part of the framework.) These are all key areas for improvement in the tax code, but the deductibility of interest payments also has serious potential for raising revenue and curbing systemic financial risk.
This feature of the tax code distorts corporate financing decisions by pushing the effective tax rate on debt-financed investment well below the effective tax rate on equity-financed investment. The Treasury Department estimates that the effective marginal tax rate on debt-financed corporate business investment is -4.4 percent (a subsidy), versus a 36.8 percent for equity-financed investment – quite the tax wedge. Profits from equity-financed investment will be taxed at the effective corporate rate (26 percent on average), and after-tax profits will be taxed when disbursed to shareholders as dividends or realized as capital gains, both at the 15 percent rate. Conversely, Treasury notes that “profits from the same investment funded by debt will only be taxed to the extent they exceed the associated interest payments” and the interaction with the accelerated depreciation deduction results in a big tax subsidy. This is a huge boon to industries reliant on debt, notably the highly leveraged financial sector, although the value of the so-called “debt tax shield” weighs against the costs of financial distress associated with indebtedness.
We previously proposed limiting the deductibility of interest payments in our budget blueprint Investing in America’s Economy, with emphasis on reining in financial sector leverage. (This progressive budget report was a collaboration of Demos, EPI, and The Century Foundation.) The tax code should not subsidize systemic financial risk in the form of high leverage ratios (in balance-sheet terms, the ratio of assets to net worth). Emerging from the worst financial crisis since the Great Depression, curbing the debt tax shield should be a no-brainer: Lehman Brothers was leveraged 30-to-1 when it collapsed in Sept. 2008. This concern should have been addressed after hedge fund Long-Term Capital Management went bust in Sept. 1998 with a balance-sheet leverage ratio over 50-to-1. (LTCM was deemed systemically important, and the New York Fed organized a bailout by private investors.)
The administration proposed “reducing the bias toward debt financing,” which, while lacking specificity, could be a major revenue source. The deductibility of interest payments is not considered a “tax expenditure” (it’s not a deviation from the tax code, it is the tax code) so this isn’t included in the Joint Committee on Taxation’s estimate that revenue-neutral tax reform could only lower the corporate rate to 28 percent rate. (As I noted, the administration wants this 28 percent rate and permanent tax breaks for manufacturing, drawing into question whether these tax changes will result in reform or a tax cut.) Broadening the tax base into interest payments could help lower the corporate rate to the targeted 28 percent, fund the proposed continuation of the research and experimentation credit, level the playing field across financing decisions, and contribute to deficit reduction. There is a huge sum of money at stake here.
The Federal Reserve’s Flow of Funds data show $11.5 trillion in outstanding non-financial business debt and $13.7 trillion in outstanding domestic financial-sector debt as of the third quarter of 2011. It doesn’t take a leap of the imagination to conclude that there is real revenue potential in curbing the tax code’s debt-financing preference. Doing so could ensure that tax reform helps restore revenue adequacy while mitigating the subsidization of systemic financial risk.
Arne Duncan’s policies have yet to match his rhetoric
In a recent speech, U.S. Secretary of Education Arne Duncan rejected “either-or” approaches, saying support was essential for both in-school reforms, and for improvements in the social and economic conditions that bring so many disadvantaged children to school unprepared to learn. For example, Duncan said he is a “huge fan” of programs like school-based health centers.
Yet his rhetoric has not been supported by his policy. To qualify for Race to the Top funds, and for waivers from No Child Left Behind requirements, states have been required by the Obama administration to change laws and policies so that teachers could be evaluated by their students’ test scores, and so that more charter schools would be authorized. States faced no similar requirements to change laws and policies to remove impediments for school-based health centers.
This can be fixed. Duncan can rescue his reputation as a “both-and” leader by using his powers to leverage an increase in children served by school-based health centers. For example, states could remove requirements for children to get pre-authorization from managed care organizations for routine and preventive visits to their school clinics. States could permit school-based health centers to bill Medicaid directly for services. Some states already have such policies, so it not unreasonable to expect all states to have them.
For more, read my commentary from yesterday morning.
Post editorial criticizes Md. schools, public pensions, school boards, teacher unions, and Gov. O’Malley — but misses all targets
An editorial in the Washington Post today caught my attention. Entitled The buck stops nowhere and subtitled Gov. O’Malley’s teachers’ pension plan would hurt counties without curing fundamental problems, the editorial suggests teachers get paid too much, pension costs are too high, and government is irresponsible. No evidence is provided for the first two propositions, and the editorial attacks a reasonable attempt by Maryland Gov. Martin O’Malley to bring about greater accountability.
Instead of evidence that teacher pay and pensions are too rich, the Post slides from complaining about how sympathetic school board members are to teachers unions to a complaint that “those pensions have become a crushing burden, amounting to about $1 billion annually.” Well, teacher pensions don’t cost nearly that much; that’s the cost of all state employee pensions, including state police, highway department, the parks department, etc. Does the Post not know that or was the writer just trying to throw dust in our eyes?
The editorial makes things worse in the next sentence: “That’s more than Maryland spends on the state police, housing, economic development or many other government functions.” This makes no sense. State employee pensions are a fundamental part of the cost of all of those state functions. Employees get deferred compensation – a promise of retirement benefits in the future instead of higher pay now. The Post apparently wants its readers to think that teacher pensions are stealing money that could have funded more police or economic development staff, but they are precisely what that $1 billion annual pension contribution pays for.
Are Maryland’s teachers overcompensated? The Post insinuates that it must be so because the school boards have no reason to restrain teacher salaries, but the editorial doesn’t cite a shred of evidence, and EPI research shows otherwise. The Post has talked endlessly about the need for better public school teachers and claims to believe in the magic of the free market, but the thought that you get what you pay for doesn’t seem to have occurred to them.
The investments are paying off. Maryland students’ performance on the National Assessment of Educational Progress has steadily improved over the last decade. In 2000, 35 percent of 8th graders tested below basic in math; last year, it was only 26 percent. Only 28 percent were proficient or advanced in 2000, but 41 percent tested at these higher levels in 2011. As recently as 2005, 31 percent of 8th graders tested below basic in reading. Last year, that number fell to 20 percent, an achievement by teachers and administrators the Post should celebrate.
The O’Malley plan that the Post attacks would transfer some of the cost of teacher pensions to the counties where the compensation decisions get made, rather than passing it on automatically to the state. The local residents who want to increase teacher pay and benefits will have to assume direct responsibility for more of those costs. If the Post is narrowly concerned about cost and accountability, it should be applauding. But the Post isn’t satisfied because the county in which each school board resides will be responsible for the cost, but the school boards are separate political entities. So what? Both are elected bodies, and voters can balance their preference for lower taxes against a desire for good schools and vote accordingly.
The Post never says it clearly, but accountability isn’t really its concern. The paper won’t be satisfied until education spending is cut. Maryland, in the Post’s view, spends too much on its schools. What is their evidence? Other unnamed programs have been cut “by $456 million while increasing aid to schools by an almost identical amount.” Unless the Post provides evidence that these programs were more critical or less well funded than schools, this is a meaningless point.
If education is crucial to the nation’s future, we should all be grateful that the Post’s editors are only criticizing the government and not running it.
CBO shows ARRA’s continued positive impact
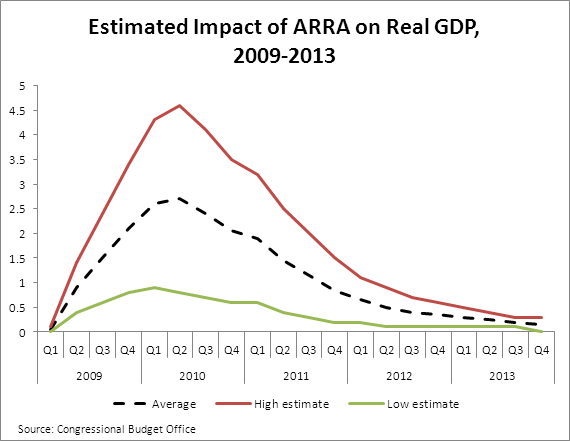
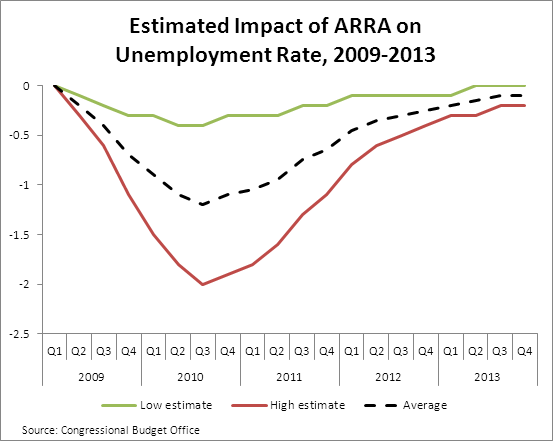
Last week, I wrote a blog post marking the third anniversary of the American Recovery and Reinvestment Act (ARRA) and highlighting ARRA’s pivotal role in turning the economy around. Numbers crunched for the Congressional Budget Office’s (CBO) latest report on the legislation emphasize the same takeaway. Since ARRA was enacted in Feb. 2009, CBO has published periodic reports on the macroeconomic impact of ARRA; their latest looks at employment and economic output from Oct. 2011 through Dec. 2011. CBO finds that in the fourth quarter of calendar year 2011, ARRA’s successes included:
- Raising real GDP by between 0.2 percent (low estimate) and 1.5 percent (high estimate);
- Lowering the unemployment rate by between 0.2 and 1.1 percentage points;
- Increasing the number of people employed by as low as 300,000 and as high as 2 million; and
- Increasing the number of full-time equivalent jobs (which assume a full-time schedule worked by employees) by between 400,000 and 2.6 million.
Furthermore, CBO projects that ARRA will raise real GDP by between 0.1 and 0.8 percent and will increase the number of people employed by between 200,000 and 1.1 million in 2012, compared to the counterfactual without passage.
The two charts below show ARRA’s quarterly impact (both low and high estimates, as well as midpoints) on real GDP growth and the unemployment rate. The data include projections through 2013. Note that the majority of the impact occurred between Q3 2009 and Q4 2011. The subsequent waning is due to the fact that around 90 percent of ARRA’s budgetary impact was realized by the end of December 2011.
Where is the ‘shared sacrifice’ in this framework for corporate tax reform?
Earlier this week, the Obama administration and Treasury Department unveiled a “framework” for corporate tax reform. Like the rest of the tax code, the corporate income tax has been riddled with ever-more loopholes since the Tax Reform Act of 1986—the last significant scrubbing of the tax code. Here’s my distilled version of their five-point framework:
- Eliminate loopholes to broaden the tax’s base, coupled with a cut to the statutory corporate rate from 35 percent to 28 percent.
- Reinstate tax expenditures for domestic manufacturers, lowering their effective tax rate from 28 percent to 25 percent.
- Establish a new minimum tax on foreign earnings.
- Ever-present nod to small businesses concerns.
- “Restore fiscal responsibility and not add a dime to the deficit.”
To lower the tax rate to 28 percent and yet keep the corporate income tax changes revenue-neutral, the framework proposes eliminating a handful of specific business tax expenditures—oil and gas subsidies, carried interest, last in, first out inventory accounting, special depreciation rules—repeatedly proposed in budget requests (summary of most of these can be found here). But the Joint Committee on Taxation recently estimated that revenue-neutral corporate tax reform could only be consistent with a top statutory rate of 28 percent if all major tax expenditures were eliminated.
The administration framework falls shy of that mark, and instead proposes new manufacturing tax incentives and a permanent extension of the research and experimentation credit (which is renewed annually as part of the “business tax extenders”). In the president’s FY13 budget, these “incentives for manufacturing” totaled $121 billion in revenue loss over a decade. The administration claims their plan will raise $250 billion—beyond offsets for the rate reduction—to pay for the permanent extension of these tax credits. JCT’s math, however, implies this figure may come from a current policy baseline assuming some of the “business tax extenders” (tax breaks which are not part of the permanent tax code but which are allegedly temporary yet extended by Congress like clockwork every year) are continued. Full continuation would reduce revenue by a hefty $839 billion over a decade.
On one hand, using this baseline seems odd; scoring any “savings” relative to current policy appears to give businesses credit for 25-plus years of successful lobbying. The bill of tax extenders includes the alcohol fuel credit, special depreciation rules for favored industries (e.g., restaurants, ethanol, race horses), special expensing rules for favored industries (e.g., film and TV production), and special foreign income deferral for the financial sector (e.g., Subpart F exception for active financing).
On the other hand, ending annual budget gimmicks (the extenders) does constitute a step toward responsible budgeting, and the depressing politics of tax reform suggests that these extenders will only be vanquished in some sort of bargain like that proposed by the administration.
But relative to current law (which does not assume the annual extension of these targeted tax breaks), Citizens for Tax Justice Director Bob McIntyre estimated that the president has proposed $1.2 trillion in tax cuts and only $0.3 trillion in offsetting loophole closers, leaving a gap of $0.9 trillion. This is hard to square with the administration’s professed intent not to add a dime to the deficit. And since when does restoring fiscal responsibility mean not adding a dime to the deficit?
Broadening the tax base and eliminating egregious preferences that have been lobbied into the tax code is good policy. But there is no reason a priori that tax reform be revenue-neutral. Indeed, the clearest flaw in the current tax system is that it simply doesn’t raise enough revenue to pay for government’s commitments. As CTJ spells out, it would be much more appropriate for corporate tax reform to be revenue-positive, relative to the much more stringent current law baseline.
Purported concern about the budget deficit always seems to vanish when it comes to tax cuts and vested business interests. “Shared sacrifice” is all the rage when it comes to reducing Medicare, Medicaid, and Social Security benefits, or raising taxes on the individual income side; where is the “shared sacrifice” in this framework for corporate income tax overhaul?
A closer look at Asian-American income
In her blog post on the earnings differences among interracial couples, the New York Times‘ Catherine Rampell concludes: “So basically, what these numbers are reflecting is that Asians earn more money, period, which is generally true across the population of Asian-Americans and has been the case for a while.” This is true when looking at household and family income, but there is a different and more complicated story underneath these numbers.
It is important to recognize that many more Asian Americans have college degrees than whites. This 2010 EPI report found that nearly 60 percent of Asian American workers have a bachelor’s or higher degree compared to about 40 percent of white workers. College-educated workers tend to earn more than less-educated workers and this pulls up the median Asian American earnings.
When one compares the annual personal income of Asian Americans and whites of the same gender and educational level, Asian Americans do not always come out on top. The figure below shows these comparisons for workers with a high school diploma and with a bachelor’s degree. In 2010, among workers with a high school diploma, white men earned about $11,000 more than white women and Asian American men and women.
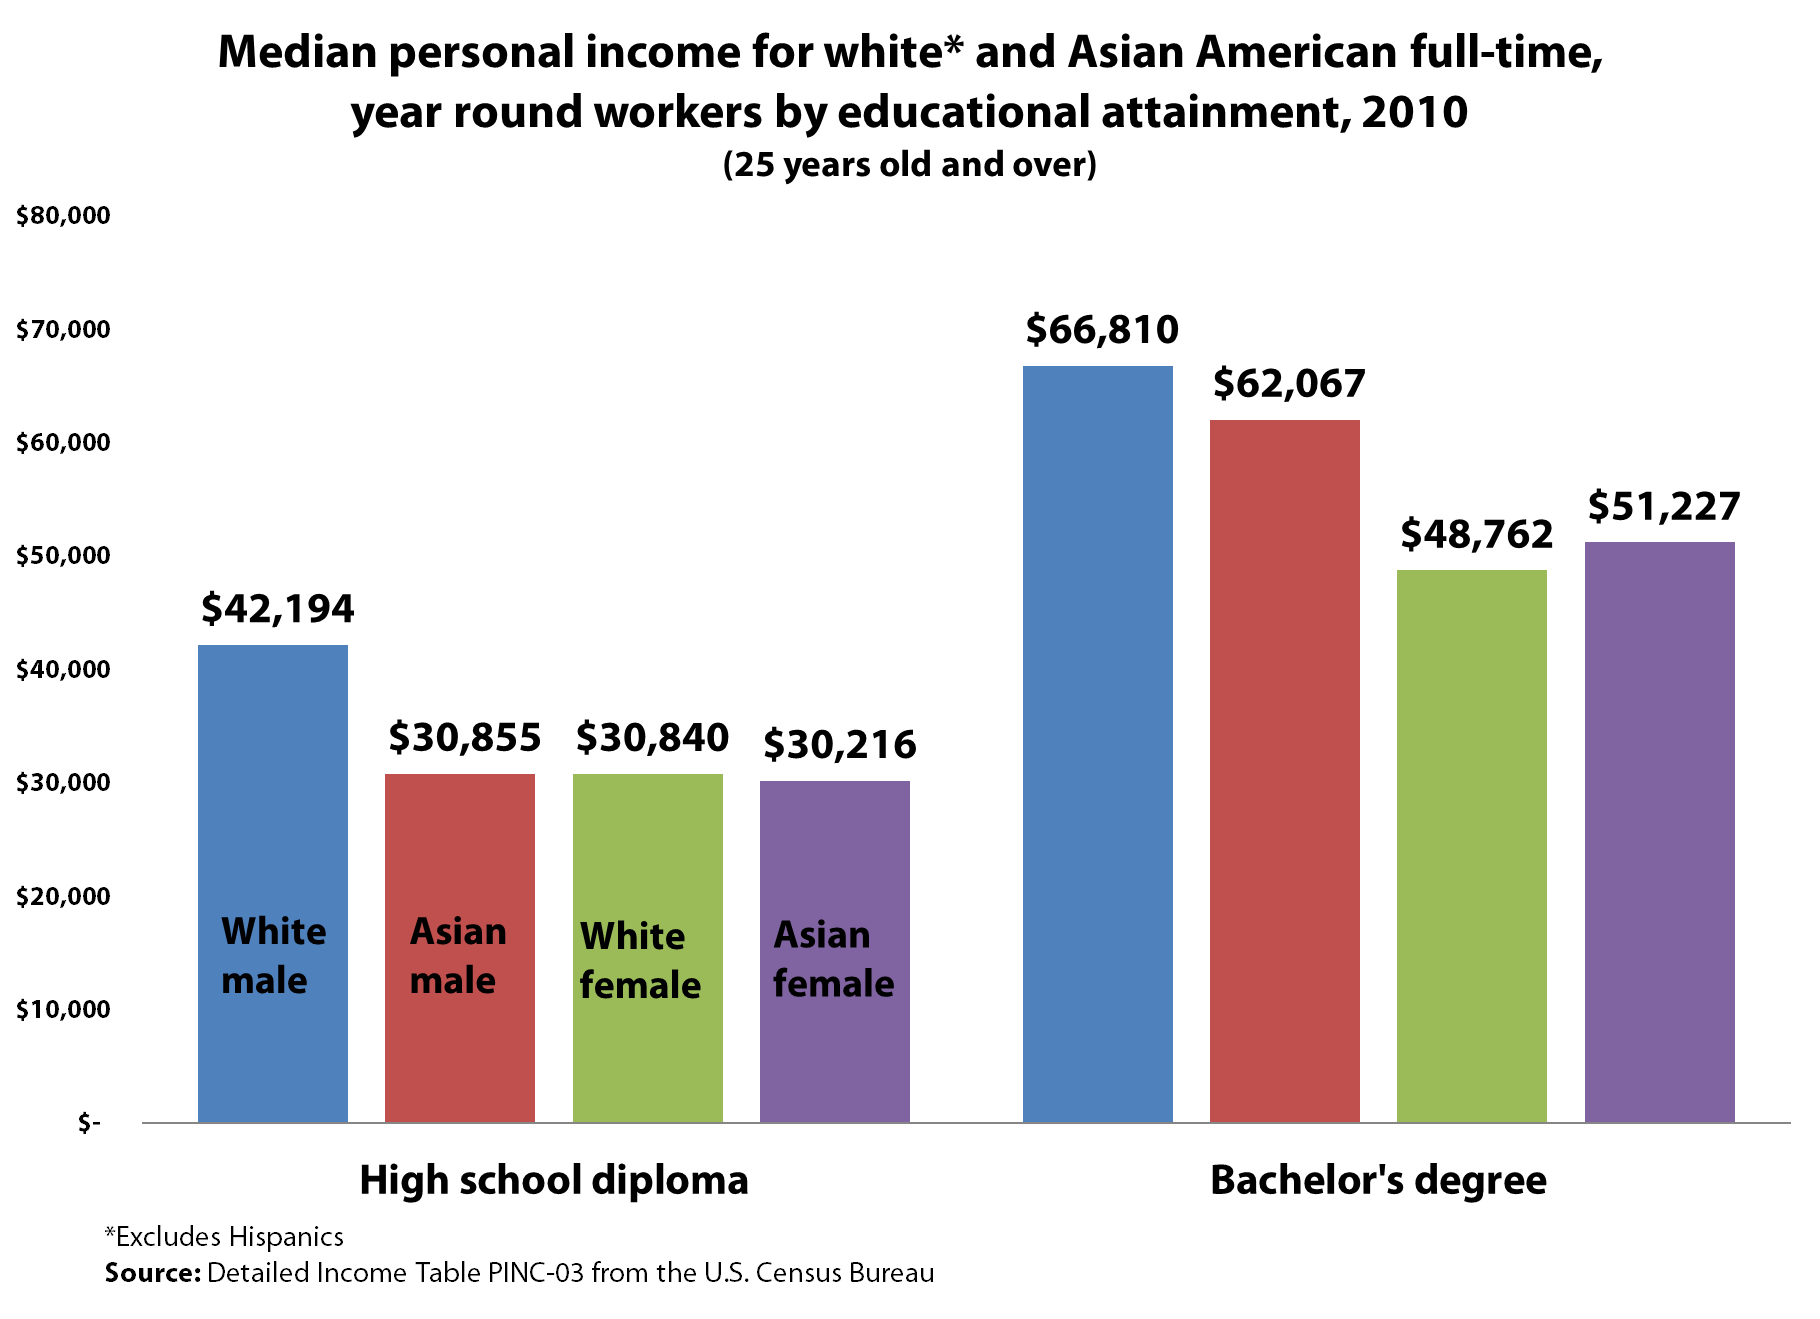
Among workers with a bachelor’s degree, white men remain the highest earners, but their earnings advantage over Asian American men is only about $5,000. In this comparison, Asian American and white women earn significantly less than Asian American men. Asian American women earn about $11,000 less than Asian American men, and white women earn about $13,000 less than Asian American men. This puts Asian American and white women at about $16,000 and $18,000 behind white men, respectively.
Another issue to consider is that Asian Americans are more concentrated than whites in high-cost-of-living areas. Asian Americans are overrepresented in expensive metropolitan areas like Los Angeles, New York, San Francisco, and Honolulu. Given this fact, controlling for educational attainment, Asian Americans should earn more than whites, but as the figure illustrates, they often don’t.
Coordinated investment as an alternative to doubling down on austerity’s failure
Former British Prime Minister Gordon Brown has a terrific piece in today’s Washington Post on European policymakers’ “fundamental miscalculation: a wrong-headed conviction, widely held across Europe, that if austerity is failing, it is because there is not enough of it.”
The failure of the “expansionary austerity” hypothesis has been growing increasingly apparent for quite some time, most recently highlighted by the euro zone economy falling back into contraction in the fourth quarter of 2011. More and more countries—including Italy and Spain—are projected to slide back into full-blown recessions. Via Ezra Klein, it’s clear to see that industrial production indices in the U.S. and the euro zone were closely tracking one-another until starkly diverging in the summer of 2011: U.S. production has continued to rebound and European output has fallen markedly.

But beyond this fiasco, Brown’s policy prescription is worth highlighting. Along the lines of advanced economies’ central banks coordinating monetary loosening and liquidity infusions during the financial crisis, Brown proposes coordinated fiscal expansion: “Europe and America should expand investment in infrastructure.” Now that would actually begin to address the global aggregate demand slump. This isn’t just Brown taking cheap political shots at Prime Minister David Cameron; this is sound macroeconomics. A massive U.S. public infrastructure project ($1.2 trillion) is also favored by prescient economist Nouriel Roubini, who similarly pegged “a front-loaded fiscal austerity that will sink us in a severe recession,” as the worst economic policy idea currently being floated.
Congress should be learning from Europe’s experience before we stray too far down the austerity path, as federal fiscal policy is all too set to do (state and local governments have already been down this path for years).
The Recovery Act: Evidence of success three years out
Today marks the three-year anniversary of the American Recovery and Reinvestment Act (ARRA). Despite overwhelming evidence of ARRA’s pivotal role in turning the economy around and boosting employment (including reports from the Congressional Budget Office, economists Alan Blinder and Mark Zandi, and the Federal Reserve Bank of San Francisco, among others), a vocal—mostly politically motivated—minority continues to misinform the debate, trying to convince the public that the stimulus failed.
That couldn’t be further from the truth.
As this recent video from the Center for American Progress nicely depicts, ARRA kept our economy from swerving over the cliff’s edge. In the video, Michael Linden of CAP uses three measures to demonstrate that the stimulus stopped the economy’s bleeding: He looks at annualized GDP growth, the monthly change in non-farm payroll employment, and monthly private-sector layoffs. As the housing collapse and financial crisis spread to the rest of the economy, these three indicators all grew dramatically worse, culminating in a dire situation in the fourth quarter of 2008—when GDP was plunging at an 8.9 percent annual rate—and the early months of 2009. After ARRA was enacted in mid-February, things started to turn around. In fact, here is what happened:
- In the second quarter of 2009—the first full quarter after the stimulus was passed—GDP declined at a much slower pace (0.7 percent), and growth resumed in the third quarter;
- Job losses slowed dramatically throughout 2009 and the economy started adding jobs in early 2010; and
- Private sector layoffs, which had peaked in Feb. 2009, began a rapid decline and returned to pre-recession levels by early Feb. 2010.
Now don’t get me wrong, ARRA wasn’t a cure-all (nor was it designed to be). The $831 billion 10-year cost of ARRA was smaller than the 2009 output gap and nowhere near the $3.0 trillion cumulative output gap since the start of the recession (which would be even bigger without ARRA). Unemployment remains unacceptably high, long after the official end of the recession. The economy needs 11 million more jobs to return to its pre-recession unemployment rate and the job seekers ratio has been higher for the last three years than it was at any point during the downturn of the early 2000s. Still, the stimulus prevented the situation from arguably being much worse than it otherwise would have been. Critics of the stimulus fail to recognize just how big of a hole ARRA was up against. As my colleague Josh Bivens explains in Failure by Design:
“The unemployment rate without the Recovery Act would have reached nearly 12%, not the 9% foreseen by the Obama administration. A good metaphor for this controversy is the temperature in a log cabin on a cold winter’s night. Say that the weather forecast is for the temperature to reach 30 degrees Fahrenheit. To stay warm, you decide to burn three logs in the fireplace. You do the math (and chemistry) and calculate that burning these three logs will generate enough heat to bring the inside of the cabin to 50 degrees, or 20 degrees warmer than the ambient temperature.
But the forecast is wrong—and instead temperatures plummet to 10 degrees outside and burning the logs only results in a cabin temperature of 30 degrees. Has log burning failed as a strategy to generate heat? Of course not. Has your estimate of the effectiveness of log burning been wildly wrong? Nope—it was exactly right—it added 20 degrees to the ambient temperature. The only lesson from this one is a simple one: since the weather turned out worse than expected, you need more logs.”