High cost and high debt for students at for-profit colleges
For-profit colleges tend to enroll students who are not familiar with traditional higher education. They are more likely to be low-income, African American or Latino. Significant numbers of veterans also enroll in these schools. The Senate Committee on Health, Education, Labor, and Pensions found that recruiters “were trained to locate and push on the pain in students’ lives.” Additionally, undercover recordings by the Government Accountability Office and other sources show that many for-profit college recruiters “misled prospective students with regard to the cost of the program, the availability and obligations of Federal aid, the time to complete the program, the completion rates of other students, the job placement rate of other students, the transferability of the credit, or the reputation and accreditation of the school.”
This combination of naïve students and misleading information allows for-profit colleges to set tuition in line with their profit goals (many of these colleges are publicly-traded companies) rather than in line with the cost of education. Figure A shows that the average cost of a certificate program at a for-profit college is 4.7 times the cost of an equivalent program at a public community college. The average cost of an associate degree is 4.2 times what it would cost at a typical community college. Bachelor’s degree programs average 19 percent higher at a for-profit college than at a flagship state public university.

Investment, employment trends belie claims that regulation and ‘too much government’ impede recovery
The claim that an excess of regulatory activity is stifling the economy and jobs growth continues to ignore the roots of the economy’s problems (the collapse of the housing and financial sectors) and the reality of current economic trends. We will save discussion of the causes of the downturn for a different day, except for noting the irony that regulatory opponents are fighting implementation of the stronger financial rules that could help prevent future collapses. Instead, we will update key information from a previous EPI analysis of whether business decisions, specifically investments, are consistent with the excessive regulation story. The earlier report documented that “what employers are doing in terms of hiring and investment” was inconsistent with business claims that regulatory uncertainty under the Obama administration was impeding job growth. The new data include four additional quarters of results and also take into account revisions to the earlier data that were made available in late July (the Bureau of Economic Analysis annual benchmarking of the National Income and Product Accounts data leads to some revisions). Altogether, we are now able to compare investment trends during the first 12 quarters (or three years) of this recovery to the first 12 quarters of the three prior recoveries.
Of particular interest is whether businesses are holding back from investing in equipment and software because of fears of new or potential regulations. This investment category leaves out residential investment and investments in business “structures”—because those types of investments are clearly faltering as a result of the bursting of the residential and commercial real estate bubble (and not because of regulatory activity).
As a share of the economy, the data show that equipment and software investment has increased more in this recovery than in the three prior recoveries. Indeed, three years into this recovery the growth of 1.6 percentage points in the share of GDP going to investment in equipment and software is more than twice as large as the growth during the first three years of either the George W. Bush or the Reagan recoveries. That means that this recovery, with the Obama regulatory approach, is far more investment-led than the recoveries under the generally deregulatory Bush and Reagan administrations.

Keep your government hands on my Medicare!
Celebrating Medicare and Medicaid’s 47th birthday this week, here are some quick thoughts on government’s role in ensuring access to affordable health care:
- The United States spends nearly double what other countries spend. Americans spent a total of around $7,600 per person on health care in 2010, compared with around $3,900 on average for countries with similar standards of living, according to the Kaiser Family Foundation. Despite this higher spending, health outcomes are no better than in other developed countries.
- Government picks up nearly half the tab. As fewer Americans are covered by employer-sponsored insurance, government has taken up the slack. State and federal programs now directly or indirectly cover 45 percent of health care costs in the United States.
- High and rising health care costs are the biggest fiscal challenge our country faces. The Congressional Budget Office (CBO) projects that federal spending on major health programs will increase from 7.4 percent of GDP in 2022 to 10.4 percent in 2037 if current policies remain in place. Nearly two-thirds of this increase is due to the assumption that per capita health care expenditures will grow faster than per capita GDP. In the absence of this excess cost inflation, spending on these programs would increase to a more manageable 8.6 percent of GDP in 2037, largely reflecting the long-anticipated baby boomer retirement. Read more
The folly of the GOP’s ‘tax reform’ agenda
Mitt Romney and House Budget Committee Chairman Paul Ryan (R-Wis.) are both pushing “tax reform” plans that would lower marginal tax rates while broadening the base (curbing tax deductions, credits, and exclusions). Romney’s plan, for example, would reduce all individual income tax rates by a fifth—e.g., the top 35 percent rate would fall to 28 percent—and the revenue loss would be made up by limiting or eliminating unspecified tax expenditures. And he says he would do this without cutting taxes for high-income households (beyond continuing their Bush-era tax cuts), meaning that he would more or less preserve the progressivity of the current tax code (i.e., tax burden distribution).
For the moment, let’s leave aside the fact that these plans neglect to raise a dollar in additional revenue at a time when we need more revenue to put the government on a sustainable fiscal path. Why are these proposals pure folly? First, because they’re obviously not serious—if they were, the plans would lead with the tax expenditure reform rather than the rate cuts. Instead, they’re sold in manner suggesting that Romney and Ryan wanted to propose big across-the-board tax cuts but didn’t want to be seen as blowing up the deficit, so they included vague language on base-broadening in order to ignore the monumental cost of slashing tax rates.
But most importantly, these plans aren’t serious because their stated intent isn’t mathematically possible. In an analysis released Wednesday, researchers at Brookings and the Tax Policy Center analyzed a plan that is consistent with Romney’s proposal, including lowering rates by a fifth and eliminating the Alternative Minimum Tax. The researchers then attempted to construct a base-broadening approach to both make up the revenue lost from the rate cuts and maintain the progressivity of the current tax code. Read more
Potential failure
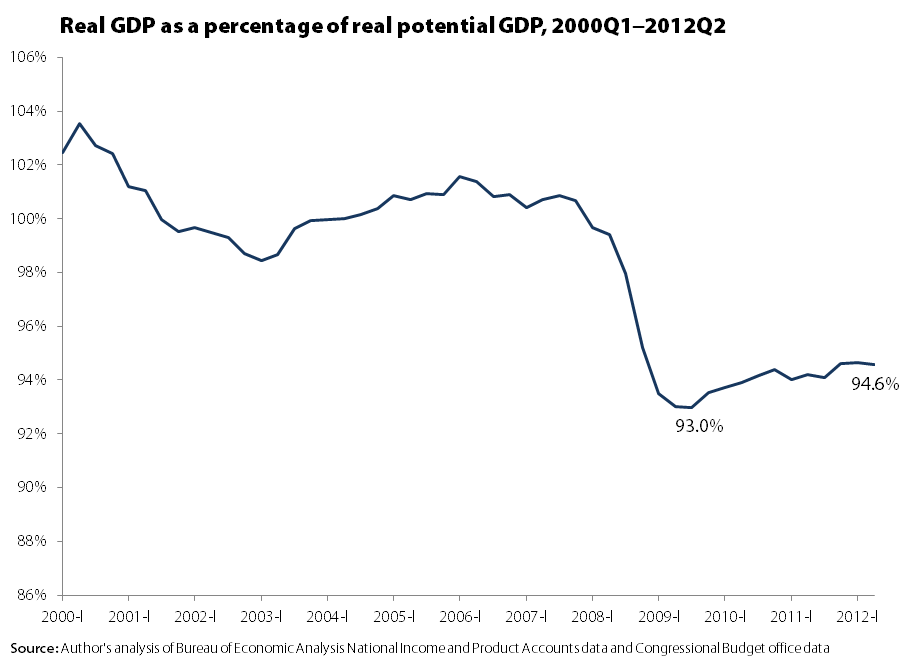
Today’s report on gross domestic product (GDP) came with more news of disappointing growth. The economy has grown at an average rate of 1.75 percent so far this year. While the economy is growing and we are not in a recession (and there’s no sign a recession is imminent), it is important to note that this slow growth is not moving the economy much closer to full health, and may even be doing real damage to that long-run health.
This problem can be highlighted by looking at actual GDP as a percentage of “potential ” GDP, a figure provided by the Congressional Budget Office. Potential GDP can be thought of as a capacity utilization rate for the whole economy: If we were utilizing all of our resources, including labor and capital, how much economic output would we be able to produce?
You can see that in 2000, actual and potential were roughly similar (actual slightly exceeds potential, in fact, because the CBO has a too-conservative view of what is the lowest sustainable rate of unemployment), but then this ratio crashes as the Great Recession hits.
At the trough of the recession in the third quarter of 2009, the U.S. economy was operating at only 93 percent of potential. In the nearly three years since, we’ve only recouped an additional 1.6 percent of potential output. Although GDP has been growing in that period, potential has been growing too (and faster), because of our increasing potential labor force and productivity growth.
Investigations reveal forced labor of immigrants but Congress won’t allow the Labor Department to combat it
Congress holds the keys to fixing many of the problems in one of the main temporary foreign worker programs used by employers to displace U.S. workers, depress wages, and exploit foreign workers. The Department of Labor has already issued the important fixes, but they’ve been temporarily enjoined by a federal court. However, going forward, Congress is considering nullifying the rules entirely by denying funding for their implementation.
The program in question is the H-2B guest worker program. On Tuesday, I joined the Southern Poverty Law Center (SPLC), the AFL-CIO, and two H-2B guest workers from Central America at the National Press Club to call on Congress to help unemployed workers have increased access to jobs in a number of occupations—including landscaping, hospitality, forestry, and seafood processing—by allowing the DOL’s new rules governing the H-2B program to come into force. The new rules would require employers to first recruit unemployed workers before turning to foreign workers, ensure that U.S. and foreign workers are not underpaid, and protect guest workers from becoming victims of forced labor and human trafficking, as well as from being retaliated against if they attempt to assert their labor and employment rights.
Although the new rules include common sense protections for U.S. and foreign guest workers, they are far from extreme or burdensome. If anything, the rules and requirements on employers are quite basic and modest.
Recently, the scandalous side of the H-2B program received some well-deserved attention from the media. A few weeks ago, a New York Times editorial, “Forced Labor on American Shores,” offered a powerful and depressing reminder that the days of forced labor (also known as slavery) are still with us. In fact, the H-2B guest worker program helps facilitate it, and in the editorial’s case, forced labor was occurring for the benefit of Walmart, the largest private employer in the world, by C.J.’s Seafood, one of its suppliers. Walmart’s size and purchasing power give it leverage to demand the lowest prices possible from its vendors and manufacturers. This in turn, can motivate suppliers like C.J.’s in Louisiana to exploit and abuse their workers in order to bring down labor costs. Read more
Confirming the further redistribution of wealth upward
A new Congressional Research Service report by Linda Levine is the first update on the distribution of wealth (including that of the top 1 percent) I’ve seen based on the recently released Federal Reserve Board (FRB) data on wealth for 2010. Levine’s analysis (see two of her tables below) shows a large upward change in the distribution of wealth over 2007-2010, with losses in the bottom 90 percent and large gains for the top 10 percent. Specifically, the bottom 90 percent in 2010 had just 25.4 percent of all wealth, down from 28.5 percent in 2007. The gainers were primarily those in the 90-to-99th percentiles (up 2.3 percentage points) of wealth, though the top 1 percent saw gains (up 0.7 percentage points) too. Levine’s data goes back to 1989 and show the wealth share of the bottom 90 percent to be at its lowest in 2010, far lower than the 32.9 percent share in both 1989 and 1992.
Levine reports data directly from the FRB showing that average wealth is down from 2007 but still far greater in 2010 ( $498,800) than in 1989 ($313,600) or 1992 ($282,900). In contrast, the wealth of the median household (wealthier than half of households but less wealthy than the other half) in 2010 was $77,300, not much different than in 1989 ($79,100) or 1992 ($75,100). In other words, wealth grew 59 percent from 1989 to 2007, but the typical household’s wealth was actually 2 percent less.
This is yet another dimension of the same old story about the economy being able to provide for most people but failing to do so, a story that will be told more fully in the forthcoming State of Working America (being released in late August). The new edition will include a more detailed report on wealth distribution from 1962 to 2010, based on an analysis by New York University’s Edward Wolff (see the last report, written by Sylvia Allegretto).


Happy birthday, CFPB
Tomorrow, the Consumer Financial Protection Bureau completes its first year of operation. Created under the Dodd-Frank Act, we’re starting to see the benefits of a strong federal agency that protects consumers from the dangers posed by an unchecked financial industry.
The CFPB notched its first enforcement action—and hopefully, the first of many—yesterday with the announcement that Capital One will pay up to $210 million to settle federal charges that it violated consumer protection requirements. According to CFPB charges, Capital One used “deceptive practices” to sell unnecessary add-ons to credit card holders. Between $140 million and $150 million will be paid to the two million customers affected. Capital One will pay another $60 million in fines, with $25 million going to the CFPB and $35 million to the bank-regulating Office of the Comptroller of the Currency.
Today, the CFPB followed up this victory with the release of a report on the private student loan industry, to which American consumers owe more than $150 billion in debt. The extensive report identifies several consumer protection issues in the private student loan marketplace. Importantly, though, the report doesn’t just stop there: It includes strong congressional policy recommendations by CFPB Director Richard Cordray and Secretary of Education Arne Duncan.
These actions by the CFPB are encouraging, but the history of financial regulation teaches us that the real challenge is maintaining vigilance over time. This means keeping up with financial intermediaries’ attempts to arbitrage between different regulatory agencies, bypass current regulatory structures, and capture regulating agencies. The CFPB had a good first year, but the real challenges will appear in the years to come.
Nearly 3 years, and counting: Minimum wage increase helps working families and the economy
At the end of March, Iowa Sen. Tom Harkin introduced the Rebuild America Act, a bill that contains important provisions to strengthen the economy and improve the well-being of working Americans. Among the many worthy elements of this bill is a proposal to increase the federal minimum wage to $9.80 by July 1, 2014. Next week will mark the third anniversary of the most recent increase in the federal minimum wage. Rather than increase the federal minimum wage annually to allow low-income workers to maintain their standard of living and share in the fruits of their ever-more productive labor as should be the case, Congress too often raises the minimum wage and then puts the well-being of low-wage workers on the back burner for years at a stretch.
As my colleague David Cooper wrote in April, increasing the federal minimum wage to $9.80 by July 1, 2014 would benefit over 28 million workers and increase national GDP by over $25 billion, in the process creating over 100,000 jobs. Given the lackluster recovery that continues to cast a pall over the nation, this positive step should be embraced by all those who care about the well-being of working families.
In a forthcoming paper, I’ll be detailing the demographic characteristics of those affected by increasing the minimum wage as proposed by Harkin (a proposal that has been mirrored in Conn. Rep. Rosa DeLauro’s Rebuild America Act and in a bill for which Calif. Rep. George Miller is currently gathering support). This paper will also highlight the state level impact of the proposed increase, breaking out state-specific demographic impacts and also highlighting the economic and employment impacts.
Here are a few graphs to whet your collective appetites:

Figure 1: Educational attainment
As seen in Figure 1, over three-quarters of those affected by the proposed increase to $9.80 have completed high school or more, including 42.3 percent who have completed some college, have an associates degree, a bachelor’s degree, or more. Read more
80% of jobs created since the recession’s end have gone to men?
The U.S. economy has created 2.6 million net jobs since the end of the Great Recession in June 2009. According to a Los Angeles Times analysis of Bureau of Labor Statistics data, men have filled 2.07 million of these new jobs. There are several possible explanations for this, and a couple of important points to keep this disparity in context:
- Men suffered higher levels of job loss during the recession than women, and their level of employment today relative to pre-recession levels is still lower than women’s.
- Women hold the majority of jobs in the public sector, which is by far the sector that has seen the worst performance since the recovery began.
- Male-dominated manufacturing is recovering, albeit slowly.
- Men are taking jobs in sectors that women have traditionally been the majority in.
The construction sector suffered the largest job losses of any industry during the recession, followed by manufacturing. These sectors are overwhelmingly male, meaning that their initial losses in the recession outpaced losses for women. Even today, unemployment among men is 8.4 percent, while for women it’s 8.0 percent.
Because women have historically filled the majority of public-sector jobs, they’ve been disproportionately affected by state and local governments’ decisions to cut positions in the wake of state fiscal troubles—a phenomenon that has largely occurred since the recession’s end. An EPI report from May found that of the 765,000 public-sector jobs lost between 2007 and 2011, 70 percent were jobs held by women. While the private sector has slowly recovered some of the jobs it lost during the recession, the public sector is still cutting them at a rapid rate; 2011 was the worst public-sector job decline on record. This public-sector employment loss is almost surely the single largest reason for women’s comparative struggles since the recovery began. Read more