China responsible for bulk of the U.S. trade deficit in non-oil manufactured goods
The U.S. Census Bureau recently reported that the U.S. goods trade deficit increased from $645.9 billion to $737.1 billion in 2011 (an increase of $91.2 billion, or 14.1 percent). Crude and refined petroleum products were responsible for $61.3 billion, or 67.2 percent of the increase in the total goods trade deficit, as reported by the Census Bureau. The U.S. trade deficit in non-oil manufactured goods increased by $48.9 billion, or more than the residual.¹ The U.S. has a small, growing trade surplus in agricultural goods which increased from $36.2 billion in 2010 to $43.1 billion in 2011. We are, in effect, trading energy and capital intensive cash grains and other farm products for labor intensive manufactured goods.
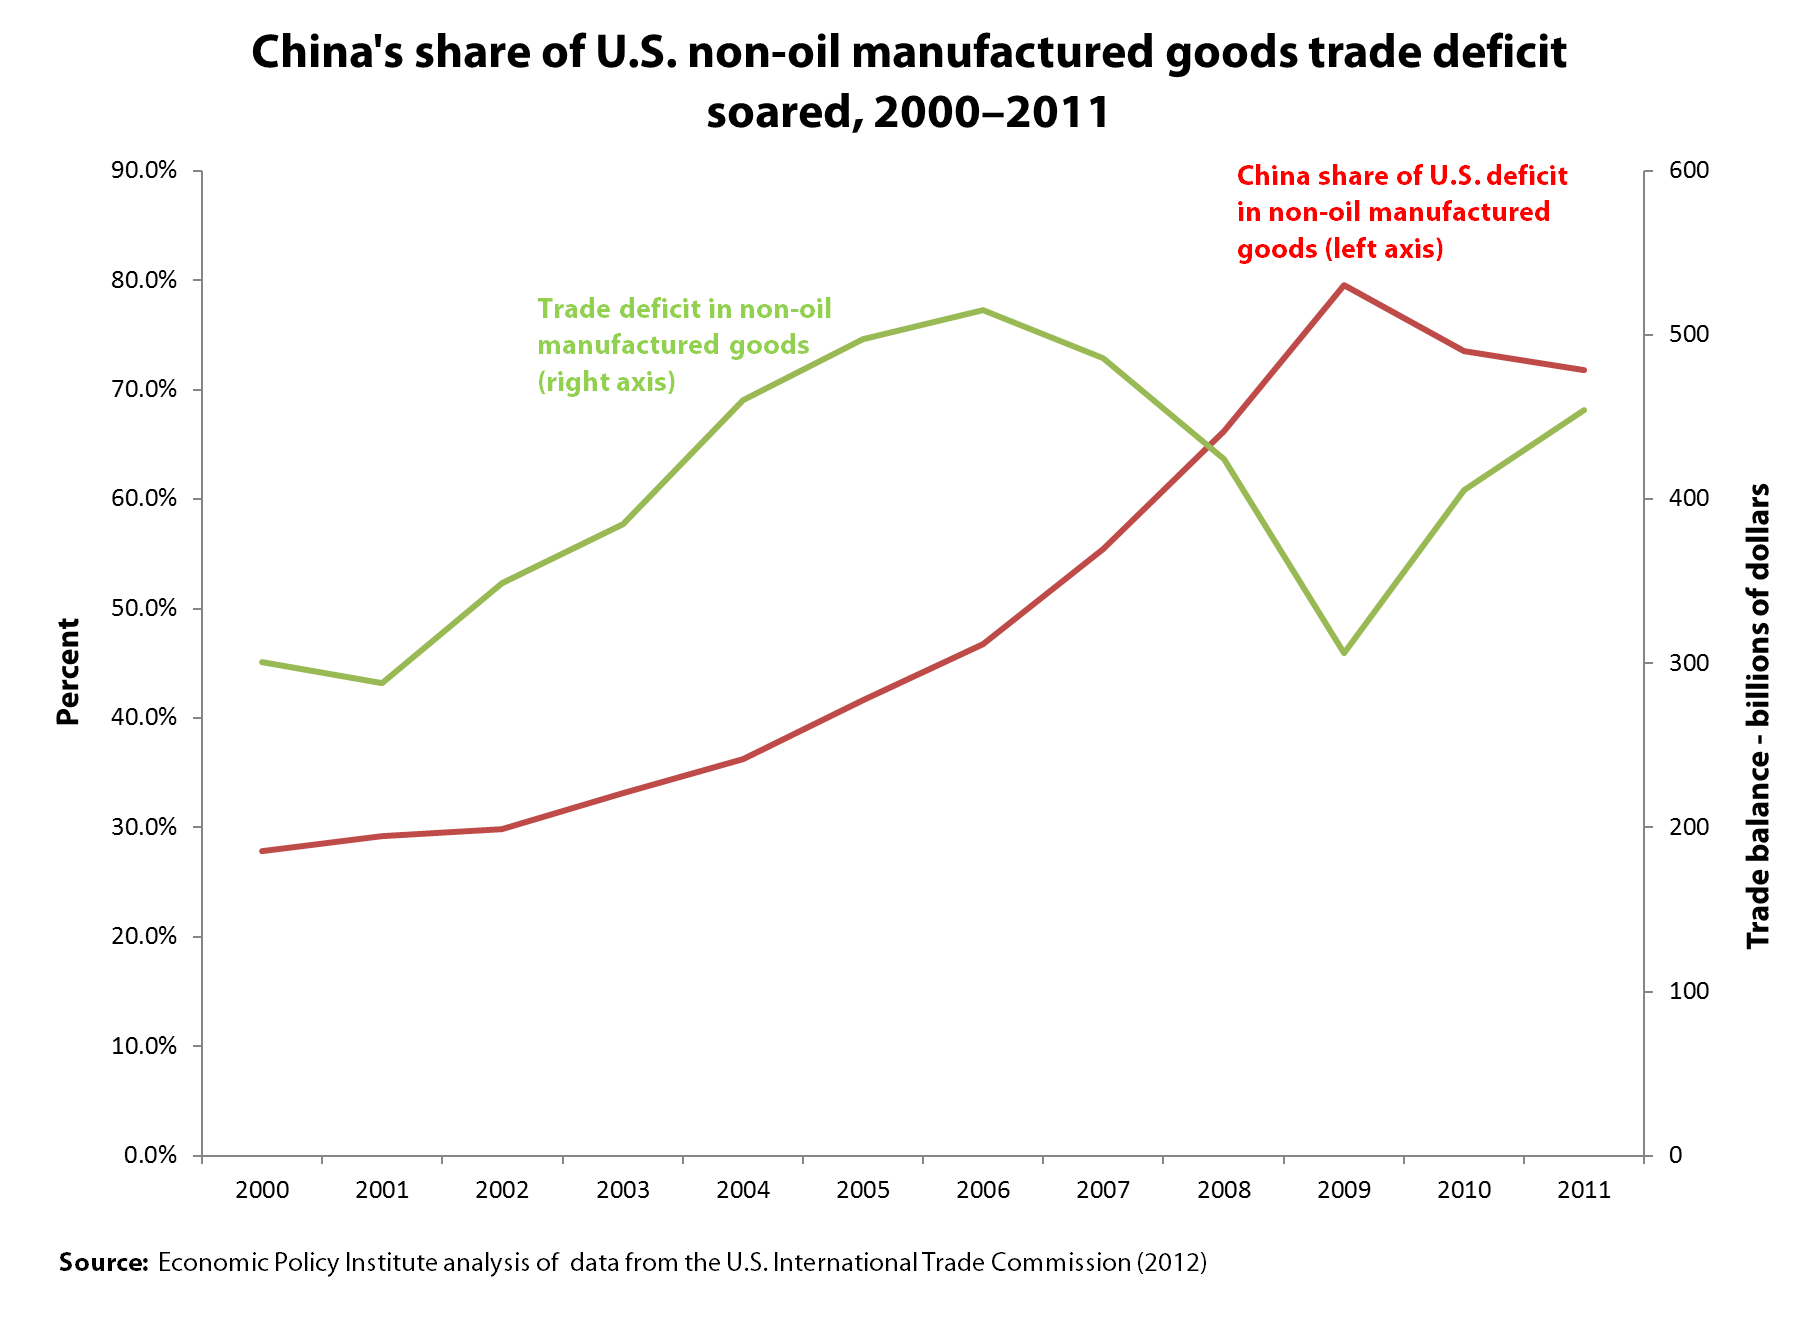
The U.S. has a large and rapidly growing trade deficit in non-oil manufactured goods, as shown in the figure below. This deficit reached a peak of $515 billion in 2006 (shown on the right axis), improved slightly in 2007 and then collapsed during the recession in 2008 and 2009 as employment, consumer incomes and demand for manufactured goods—especially durable products like automobiles—fell sharply. As a result, imports and the non-oil manufacturing trade deficit also declined in the same period.
The U.S. trade deficit in non-oil manufactured goods has been growing rapidly since 2009, as shown in the figure, which has contributed to the slow growth of manufacturing employment since the Great Recession. The U.S. lost 2.3 million manufacturing jobs between Dec. 2007 and the employment trough in Jan. 2010. Only 354,000 manufacturing jobs were added through Dec. 2011, an increase of 3.1 percent (BLS 2012). Manufacturing output, on the other hand, which reached its nadir earlier, in June 2009, has recovered much more strongly, up 16.0 percent since the trough. The difference is due, in part, to the rapid growth of the manufacturing trade deficit shown in the figure.
Throughout this period, imports of manufactured goods from China have continued to grow rapidly. Their share of the U.S. non-oil trade deficit in manufactured goods trade deficit rose steadily and more than tripled between 2000 and 2009 as shown on the red line in the figure (measured on the left axis). The U.S. trade deficit with China in these products increased in every year between 2000 and 2008. They fell only briefly in 2009, and hit new, record levels each year in 2010 and 2011, peaking at $326.1 billion in 2011. The U.S. trade deficit with China in non-oil manufactured products exceeded the overall bilateral deficit because the United States had a small trade surplus with China in raw agricultural products.²
Although China’s share of the manufacturing trade deficit has declined slightly in the past two years, as shown in the figure, China and five other Asian trading partners have been responsible for 80 percent or more of the U.S. trade deficit in non-oil manufactured products for the past three years. These trading partners are South Korea, Hong Kong, Taiwan, Indonesia and Malaysia. These countries have been forced to manipulate their currencies and compete with China on unfair trade practices to avoid loss of market share and falling behind.
Each of these countries has engaged in substantial currency manipulation and four of the six (China, Hong Kong, Taiwan, and Malaysia) have been identified as maintaining heavily undervalued currencies, relative to the dollar. The share of these six countries in the U.S. manufacturing trade deficits ranged from 92.4 percent in 2009 to 81.0 percent in 2011.
What China has in common with most, if not all, of its Asian trading partners are a set of illegal trade practices including currency manipulation and subsidies and other markets barriers. As noted by the Alliance for American Manufacturing’s Scott Paul, China’s unfair trade policies “are now the single largest impediment to job growth in America.” It is time for the United States to get tough with China and other unfair traders and put an end to these policies. The first and most important step is to get tough with currency manipulators.
¹Detailed data on product and industry trade by country in this post were all based on EPI analysis of data from the U.S. International Trade Commission (2012).
²Note, however, that China has sustained a small trade surplus in processed food and beverage products with the United States for the past four years; this surplus was $386 million in 2011 (U.S. International Trade Commission 2012).
References
U.S. International Trade Commission (U.S.I.T.C.). 2012. USITC Interactive Tariff and Trade DataWeb. Washington, D.C.: U.S.I.T.C. Available at: http://dataweb.usitc.gov/scripts/user_set.asp (registration required). Accessed December 9, 2012.
No, NYT, there’s been no expansion of government benefits, no ‘entitlement society’
There was a very interesting story on the front page of the Sunday New York Times, “Even Critics of Safety Net Increasingly Depend on It,” detailing a range of views of people who have an anti-government political orientation yet depend heavily on government supports.
I want to strongly object to one part of the story that seems to support the notion that we’re becoming an “entitlement society.” The story claims that there’s been a major “expansion of government benefits,” which it says “has become an issue in the presidential campaign.” The Center for Economic and Policy Research’s Dean Baker sees some of the same problems.
Many of the facts presented in the story do not support that conclusion and the ones that do seem to support it are misleading. Here’s the key portion:
In 2000, federal and state governments spent about 37 cents on the safety net from every dollar they collected in revenue, according to a New York Times analysis. A decade later, after one Medicare expansion, two recessions and three rounds of tax cuts, spending on the safety net consumed nearly 66 cents of every dollar of revenue.
The recent recession increased dependence on government, and stronger economic growth would reduce demand for programs like unemployment benefits. But the long-term trend is clear. Over the next 25 years, as the population ages and medical costs climb, the budget office projects that benefits programs will grow faster than any other part of government, driving the federal debt to dangerous heights.
There are two things problematic with the comparison between 2000 and 2010. One is that the denominator is revenue when it should be expenditures since revenue has eroded because of tax cuts (acknowledged in the article) and because revenues fall in a recession (2000 had 4.0 percent unemployment, 2010 had 9.6 percent) since the fall in economic activity and income reduces revenue. Revenue as a share of GDP hit a 60-year low in 2010. Here’s what you find when you look at federal budget data: Entitlements (i.e., mandatory spending) as a share of federal expenditures were the same 53 percent of total outlays in 2007 as they were in 2000, so there was no trend towards expansion, at least before the recession hit. The mandatory share rose to 55 percent in fiscal year 2010 and 56 percent in 2011, a small increase.
The second problem is that the article suggests it is describing a situation of expanded benefits when, in actuality, the 2010 endpoint largely reflects that response of existing programs to the recession – more people do get unemployment insurance, Medicaid, food stamps and so on but once unemployment returns to low levels the expanded benefit rolls will retreat. (The American Reinvestment and Recovery Act and subsequent legislation also temporarily expanded the earned income tax credit, child tax credit, unemployment insurance, and food stamp benefits, among other programs – all cost effective fiscal stimulus and prudent economic policies but unlikely to be continued indefinitely.) It is easy to see that the bump up between 2007 and 2010 or 2011 was due to the greater income supports that are generated in a recession; if you take out the “income security” portion of mandatory outlays, which includes unemployment insurance and food stamps, then the mandatory share of outlays was roughly the same 45 percent of outlays in 2011 as its 46 percent share in 2000.
So, there’s no evidence to show we’re becoming an “entitlement society,” just that we’re low on revenues and the economy remains depressed. The citation of the safety net going from 37 percent to 66 percent (of revenues) has nothing to do with permanently expanding program eligibility or higher benefits, but much to do with cyclical factors and revenue erosion.
What about the future path of entitlement spending? Well, the article itself notes that the rise is due primarily to rising medical costs and an older population (i.e., more old people). This is an old story and given that the bulk of the increase is the fast-rising cost of medical services, the answer needs to be controlling the growth of health care costs. It is also the case that these rising health care costs will be a major burden to private-sector employers, so we are not facing a government problem but a national economic challenge. If we were to limit federal health expenditures, a la House Budget Committee Chairman Paul Ryan (R-Wisc.), then the burden of this problem would fall on the elderly, their families, state and local governments, and private-sector employers. This doesn’t solve the problem, it just shifts the costs, likely exacerbating national health care expenditure in the process.
More lessons from testifying: Must explain that one person’s income is another’s cost
I’ve written one blog post already about my testimony this week on the EPA’s new standards for power plants and about how repeating near-universally held views about the economy flummoxed many of the subcommittee members to whom I was testifying.
Here’s another one that puzzled them: my claim that “one person’s income is another’s cost.” This one really buffaloed Rep. Mike Pompeo (R-Kan.), who seemed to think it was an idiosyncratic belief taught only where I went to graduate school.
The context is that I noted that the EPA’s new standards (sometimes referred to as the “toxics rule”) would create some jobs because firms would have to install and purchase pollution abatement and control equipment (scrubbers for smokestacks, for example). I noted that the need to undertake this pollution abatement investment was a cost from the perspective of the power plants, but would end up as income in the hands of workers doing the building and installation of the equipment and owners of firms in the pollution abatement sector.
Pompeo went on a strange tear about setting money on fire (yeah, I didn’t really get it either), but, just to prove that my “one person’s income is another’s cost” formulation is not some liberals-only shibboleth, check out the third slide in this PowerPoint presentation, based on the textbook of Greg Mankiw, an economic official in George W. Bush’s administration. Or this blog post on Freakonomics. Or this, from self-described libertarian Arnold Kling:
“It means that one person’s spending is another person’s income. When I buy a meal at a restaurant, the money I spend ends up as income for restaurant owners, cooks, wholesale food distributers, farmers, and so on.”
Is basic economics really this hard to get?
Anyway, in case Pompeo would like an honest-to-goodness businessman to make the same case, check out this from a story in Bloomberg Businessweek:
Meanwhile, Thermo Fisher Scientific in Waltham, Mass., is building emission monitors that power plants will need to measure toxins under the new rules. The regulations “could easily add $50 million to $100 million dollars in revenue in a year or two years,” says Chief Executive Officer Marc Casper, “which is significant for a company like ours.” The Institute of Clean Air Companies, a trade association representing businesses that make products to reduce industrial emissions, forecasts the industry will add 300,000 jobs a year through 2017 as a result of the EPA rules.
Lessons from testifying before the GOP House: Don’t assume people know basic economic principles
I testified before the House Subcommittee on Energy and Power yesterday regarding the economic impact of new EPA rules regulating toxic air pollution emitted by power plants. I made the simple point that when the economy is stuck in a “liquidity trap,” such regulatory changes can actually shrink the output gap and create jobs in the short-run by mobilizing idle savings into productive investments – a mobilization that today isn’t occurring through the traditional mechanism (falling interest rates) because we’re at the zero interest rate bound. The argument is far from revolutionary, but nobody else really seemed to be making it, so off to the Hill I went.
What really seemed to flummox some on the subcommittee, however, was when I stated the near-universally held view among macroeconomists that in the long run and if (and only if) the economy begins functioning well again, the unemployment rate a decade from now would best be estimated as “whatever the Federal Reserve wants it to be,” regardless of how many regulatory changes pass through Congress.
Why do I say this? Well, when the economy is working right, the Fed can cool down an overheating economy (man, to have that problem would be nice) by raising policy interest rates or can provide support to a flagging economy by lowering rates. While today’s extraordinarily weak economy has largely disarmed the Fed’s ability to provide a boost by lowering rates (the short-term policy rates the Fed manages have been stuck at zero since the end of 2008), if the economy begins functioning more-normally again then the unemployment rate will revert to pretty much what the Fed wants it to be because the tools at its disposal will be working again.*
This is neither necessarily good nor bad – the Fed may well “want” an unemployment rate much higher than is good for American workers (it’s happened before), but if that’s what they want, then they’ll get it. It’s a little hard to over-emphasize how widely held a view among economists this is. In an academic symposium (sorry, subscription required) on unemployment and monetary policy, not a single participant argued that the Fed doesn’t generally aim for an unemployment target nor did they argue that the Fed normally would not be able to hit it. Instead the argument was about the desirability of the Fed’s actual targets and/or how well the target was being estimated.
Given this consensus, it was a little odd to hear GOP representatives express slack-jawed disbelief about this statement. But it was extremely odd to hear a Ph.D. economist on the panel implicitly agree with them. And even odder was that the economist invoked a macroeconomic model run by a consulting firm, National Economic Research Associates (NERA) in their testimony arguing that that the “toxics rule” would cause economic harm.
But I’ve read the documentation of their study and their model assumes full-employment always and everywhere.** Which, (1) is why they’re wrong about the job-impacts of the rule in the short-run, when unemployment is clearly above any long-run “natural” rate and new investments will shrink the output gap and (very modestly) lower unemployment, and (2) makes it strange that they would deny that unemployment is not driven by regulatory changes. After all, their own model doesn’t admit that anything, regulatory change or anything else, can push the economy off of full-employment.
Myths of structural unemployment: The construction dimension
After feedback from readers, I think it would be useful to provide some context for the Economic Snapshot we released yesterday, What does construction have to do with it? The snapshot showed that very little of the rise in overall unemployment between 2007 and 2011 was due to unemployed construction workers (see the graph below). The data presented are the rise in unemployment compared to the rise in “unemployment other than construction.” In the early aftermath of the housing collapse in 2007, the overall unemployment rate was 4.6 percent, just 0.1 percent higher than if there were no construction sector. By 2011, the overall unemployment rate had risen to 8.9 percent and would have been 8.6 percent without construction. Thus, overall unemployment from 2007 to 2011 increased by 4.3 percentage points (going from 4.6 percent to 8.9 percent) and would have risen 4.1 percentage points without any construction sector (from 4.5 percent to 8.6 percent). Just 0.2 percentage points of the overall 4.3 percentage-point rise in unemployment can be explained by higher than average unemployment within the construction sector.
Unfortunately, some readers interpreted this analysis as denying either the real hardship faced by construction workers or the role of the bursting of the housing bubble on the economy. Neither was the case, so let me provide some context.
There has been persistently high unemployment for many years and a debate about what can and should be done about this. There are some prominent policymakers who believe that there is nothing that monetary or fiscal policy can do to address this high unemployment because the unemployment is mostly “structural,” meaning that there are sufficient job openings but the skills of the unemployed do not make them qualified for those jobs. That means it will take education and training of the unemployed and/or a long period of adjustment until we work our way through a structural change. In this view, neither monetary nor fiscal policy can successfully lower unemployment. One of the main narratives associated with this point of view focuses on construction, an intuitively plausible story (though not actually true): We built up substantial employment in construction during the housing boom, employment that went to relatively “unskilled” workers, and now that the bubble has burst and substantial job losses have resulted, we are left with a large pool of unemployed construction workers who have not yet found themselves new jobs in other sectors.
Consider the interview in the Wall Street Journal last year with Charles Plosser, the president of Philadelphia’s Federal Reserve Bank. After asking Plosser whether monetary policy can change the high unemployment picture, the interviewer, Mary Anastasia O’Grady, paraphrased his unequivocal response: This mess was caused by over-investment in housing, and bringing down unemployment will be a gradual process. Plosser said:
“You can’t change the carpenter into a nurse easily, and you can’t change the mortgage broker into a computer expert in a manufacturing plant very easily. Eventually that stuff will sort itself out. People will be retrained and they’ll find jobs in other industries. But monetary policy can’t retrain people. Monetary policy can’t fix those problems.”
In 2010, Narayana Kocherlakota, president of the Federal Reserve Bank of Minneapolis, said that “a lot” of our unemployment was structural and not subject to influence by Federal Reserve Board monetary policy, specifically:
“Firms have jobs, but can’t find appropriate workers. The workers want to work, but can’t find appropriate jobs. There are many possible sources of mismatch—geography, skills, demography—and they are probably all at work. Whatever the source, though, it is hard to see how the Fed can do much to cure this problem. Monetary stimulus has provided conditions so that manufacturing plants want to hire new workers. But the Fed does not have a means to transform construction workers into manufacturing workers.”
So, the snapshot addresses the structural unemployment issue these observers raise and shows that the unemployment problem goes way beyond the pool of unemployed construction workers. This in no way diminishes the importance of the bursting of the housing bubble in generating the recession nor the severe employment losses in construction. As I wrote in an earlier paper, “It is true that construction has lost many jobs in this downturn, losing nearly 2 million jobs from the start of the recession through the second quarter of 2010. This accounts for about 25% of all private-sector jobs lost. Is this what’s fueling the unemployment problem? The answer is “No, not at all.””
There were severe job losses in construction and construction has very high unemployment, as it did in 2007. Construction unemployment, however, did not fuel the rise of unemployment to 10 percent and it does not explain why it currently exceeds 8 percent. We do know that those who lost their construction jobs exited unemployment by either taking jobs in other sectors, leaving the labor force (i.e., giving up) or leaving the country, though we do not know how many chose the particular exit paths. We also know that there would be very high unemployment even if we could set aside the very high and troubling unemployment of construction workers. Solving our unemployment problem is not really about turning construction workers into manufacturing workers (as Kocherlakota suggests) or into nurses (as Plosser suggests). Rather, we need to have more job openings and more jobs in nearly every sector. And a wide array of policies can make that happen, including monetary policy, housing policy, fiscal policy and exchange rate policy. One such federal policy would be to undertake infrastructure projects in transportation and in modernizing schools that would employ construction workers and also generate jobs in related industries as well as throughout the economy as newly employed construction and other workers spend their wages.

Auto industry roars back, everyone cheers (except anti-government conservatives)
I’d like to add some thoughts to Charles Blow’s entertaining and informative blog post about Karl Rove and Chrysler’s “It’s halftime in America” Super Bowl ad. The little dust storm over the commercial is fun to watch, and the public’s reaction—which has been overwhelmingly positive—tells me that Americans might be ready, at long last, to appreciate the single most effective economic intervention of the Obama administration, the rescue of the domestic auto industry.
For those who missed it, the commercial (watch below) has Clint Eastwood narrating scenes of the rebirth of Detroit, both the city and its industry, which were weak from decades of decline and, as Eastwood says, knocked down, but not out, by the Great Recession.
Today, the city’s in worse shape than the industry, but the automakers’ new plants, new models, sales revival and new jobs have created a sense of hope for a lot of people who have seen rock bottom. Against all the odds, Chrysler Corporation, which was not just knocked down, but was declared clinically dead by most experts five years ago, had the strongest year-over-year U.S. sales increase in January and continues to gain market share. Ford and General Motors both posted huge profits last year, and GM regained its place as the world’s auto sales leader.
This nearly miraculous, feel-good story has made conservatives dyspeptic. Mitt Romney and most Republicans in Congress opposed the federal government’s loans and restructuring of GM and Chrysler. They were happy to saddle President Obama with the catastrophic job losses that would have resulted. The Center for Automotive Research forecast the loss of 2.5 million jobs and EPI’s Rob Scott estimated the losses would range between 2.5 and 3 million jobs, while Moody’s Analytics’ Mark Zandi estimated the damage at about 1.5 million jobs.
Conservative opponents like Sen. Richard Shelby (R-Ala.), and even Zandi, who supported the rescue plan, predicted that the rescue would end up costing taxpayers upwards of a hundred billion dollars. They assumed the initial loans would not be repaid and would lead to additional loans when the companies failed to meet their sales and revenue targets.¹ They were wrong. Totally, absolutely wrong. Zandi has, at least, been forthright that things turned out far better than he feared.
Nevertheless, because TARP funds were used to save the auto companies, and because TARP is still widely reviled, most Americans opposed the rescue as just another corporate “bailout.” It didn’t help that the Big 3 were unpopular and their executives were tone deaf and overpaid. Add to this mix a right-wing effort to discredit the United Auto Workers and blame it for the industry’s woes, and it’s easy to see why President Obama has had trouble making people understand what a dramatic success his (and George W. Bush’s) policy has been. What should have been a huge re-election asset has been viewed as a liability, even in Michigan and Ohio!
But maybe the public does get it now. If they do, Rove and Fox News will have every reason to choke on a commercial that never mentions the government or Obama but celebrates the fact that a key U.S. industry just might win the second half.
¹As EPI’s Robert Scott points out, the rescue made both fiscal and policy sense, even if the loans were never repaid.
A cheaper dollar is not enough
My colleague Josh Bivens is right to call Christina Romer on her failure to note the importance of currency manipulation on the plight of U.S. manufacturing. But, he leaves us with the impression that the story ends there, and that a targeted manufacturing policy is simply a poor second-best reaction to the governing class’ refusal to deal with our overvalued dollar. It’s not. Even if Romer had acknowledged the currency problem, she still wouldn’t have been, as it were, on the money.
Romer dismisses the notion of “special treatment” of manufacturing (a euphemism for industrial policy – the policy that still dare not say its name), as a sentimental effort to turn back the tide of history, which conventional economics wisdom tells us has thrown American goods production into its trash heap. In the same news cycle, Larry Katz of Harvard tells the New York Times that an increase in manufacturing jobs is “implausible.”
But what is really implausible is the notion that America’s creditors will continue to finance our current account deficit forever. The mills of macroeconomic adjustment may grind slowly, but sooner or later—with or without a change in U.S. dollar policy—they will grind away the dollar’s inflated position in the world. Assuming an eventual global recovery, foreign investors will eventually find more profitable ways to invest their money (in their own economies, for example) than to keep lending it to American consumers at low rates and with the increasing risk that they will be paid back in devalued dollars.
At that point, the market will force the dollar down, making us more price competitive. But this will not be costless. Given that a large chunk of what we buy—including most of our oil—comes from abroad, the initial impact will be to raise the cost of living here, undercutting real incomes.
Moreover, time has not stood still. After 30 years of surrendering markets and off-shoring production, Americans no longer dominate the upper reaches of the global supply chains. The world is now full of competitors whose governments will use every possible policy tool to keep, and expand, their share of high value-added markets. So, in the absence of something similar here, our workers will be competing on the basis of cheaper labor costs.
It’s already happening. Two tier wages systems, in which younger workers get paid much less are now standard practice in many American factories. As Rich Trumka said to me a few months ago, “What makes you think that two-tiers could not turn to three?” The Obama administration plays up the General Electric decision to bring the production of a water heater back from China to a plant in Kentucky. What it plays down is that the hourly wage went from $20 to $13 per hour.
Some have criticized President Obama’s proposals as cynical election-year half-measures. They may be right. Still, it is, finally, a step in the right direction. Even with a cheaper dollar, laissez-faire domestic policy is not going to bring back the American Dream.
‘Nonsense fact’ about union workers used in Super Bowl ad
That’s how the Washington Post fact checker, Glenn Kessler, put it in his review of the following assertion used in the Super Bowl ad (watch below) by the Center for Union Facts*: “Only ten percent of people in unions today actually voted to join the union.”
Kessler dug in to see where that came from and apparently it is an “estimate [of the] the proportion of employees who both would have voted for the establishment of a union at their companies and were still in their jobs.” As Kessler points out, this has no bearing on the extent to which workers currently covered by collective bargaining would vote to maintain collective bargaining. It is as relevant, as Jared Bernstein points out, as “saying Virginia isn’t a state because none of its current residents voted for statehood.”
What are the facts? Richard Freeman (Harvard University) and Joel Rogers (University of Wisconsin) report on page 69 in their book, What Workers Want, that 90 percent of union workers wanted to keep their union based on their answer to the question, “If a new election were held today to decide whether to keep the union at your company, would you vote to keep the union or get rid of it?”
Union workers have many special legal rights and protections. For instance, union workers by law have the right to vote for union officers and any dues increase, initiation fee or assessment. The laws protecting internal union democracy are far stricter than those for corporate governance and shareholder rights. Plus, workers also have clear rights to decertify unions. This ad and this “fact” do not capture what union worker rights are nor even attempt to reflect what union workers’ views are of collective bargaining.
In fact, a much larger share of the non-managerial workforce wants a union than has a union. Freeman wrote in 2007:
“Given that nearly all union workers (90%) desire union representation, the mid-1990s analysis suggested that if all the workers who wanted union representation could achieve it, then 44% of the workforce would have union representation.”
So, if workers could freely have a union when they wanted one, union representation in the United States would be on par with that of Germany.
*By the way, the CUF is just a small part of an array of misleading public relations efforts conducted by Richard Berman on behalf of special interests.
The tax expenditure of the 1%
The Tax Policy Center’s new report on the distribution of tax expenditures strengthens the case for increasing tax progressivity and raising needed revenue by ending the preferential treatment of capital income (subject to a 15 percent tax rate versus a top marginal income tax rate of 35 percent). TPC’s analysis looks at seven broad categories of individual income tax expenditures: exclusions, above-the-line deductions, the preferential treatment of capital gains and dividends, itemized deductions, nonrefundable tax credits, refundable tax credits, and other miscellaneous tax expenditures. Guess which category of tax expenditure provides by far the most lopsided benefit to upper-income households?
That would be the way the tax code preferences capital income over wage and salary income, compounded by the heavy concentration of capital income at the top of the earnings distribution. In 2011, the top 1 percent of households by cash income received a whopping 75.1 percent of the benefit from the preferential treatment of capital gains and dividends. The broad middle class—defined here as the middle 60 percent of households by cash income—received only 3.9 percent of that benefit. Upper-income households also do well by tax exclusions and itemized deductions, but the share of these tax expenditures accruing to the top 1 percent of households—at 15.9 percent and 26.4 percent, respectively—don’t come close to the windfall afforded by a 15 percent rate on capital income.
This should come as no surprise if you’ve read about the Buffett Rule and former Massachusetts Gov. Mitt Romney’s 13.9 percent effective tax rate: Capital income is terribly concentrated at the top of the earnings distribution and the preferential tax treatment of capital income even allows some millionaires and billionaires to pay lower effective tax rates than many middle-class households. Indeed, a recent Congressional Research Service report suggested that the tax reforms most consistent with implementing the Buffett Rule would be raising tax rates on capital gains and dividends. Additionally, TPC’s distributional analysis of taxes on long-term capital gains and qualified dividends shows that the top 1 percent of households by cash income (with income above $533,000) will pay 70.5 percent of capital gains and dividends taxes in 2011, contrasted with just 2.3 percent for the broad middle class (with incomes between $17,000 and $103,000).
Recently, the increasing concentration of capital income at the top of the earnings distribution has been the biggest driver of income inequality, followed by changes in tax policy. Since the mid-1990s, the biggest swing in tax rates has been dropping the top capital gains rate from 28 percent to 15 percent and slashing the top rate on qualified dividends from 39.6 percent to 15 percent. Today’s preferential treatment of capital gains is often considered the most regressive feature of the tax code; taxing capital income as labor income would be an extremely progressive way to raise revenue and push against after-tax income inequality. Eliminating the preferential treatment of capital gains and dividends would raise effective tax rates by 4.5 percentage points for the top 1 percent of households, while raising effective tax rates by 0.1 percentage points or less for the middle class, according to TPC. Doing so would raise substantial revenue from those households best able to contribute to deficit reduction. Measured with interactions, TPC estimates that the preferential treatment of capital gains and dividends cost $77.7 billion in 2011.
Comprehensive tax reform will have to raise more revenue and restore a greater degree of progressivity to the tax code, so that effective tax rates continue to rise with ability to pay. Equalizing the tax treatment of ordinary income and capital income would substantially advance both objectives.
Unpaid internships: A scourge on the labor market
I was happy to see the New York Times‘ online debate about unpaid internships, sparked by the latest lawsuit against a major corporation for exploiting an unpaid workforce. A recent graduate of Ohio State University, Ms. Xuedan Wang, is suing the Hearst Corporation for its failure to pay her during four months of work at Harper’s Bazaar, work that allegedly included directing the work of other interns, in addition to record-keeping and overseeing the pick-up and delivery of fashion samples.
As Steven Greenhouse reported in April 2010, it has become common for profit-making businesses to ignore the minimum wage and overtime laws and employ young workers without compensating them and, as Ms. Wang’s lawyers point out, without paying Social Security taxes, unemployment taxes, or worker’s compensation premiums. This not only deprives the so-called interns of coverage under these important programs, it deprives the trust funds of needed revenue. Four months of minimum wage work would cost a New York employer more than $400 in payroll taxes and several hundred dollars in worker’s compensation premiums.
Despite the magnitude of the tax losses nationwide, few state governments have tackled these illegal unpaid internships, and the federal government has failed to litigate a single enforcement case, although it might have settled enforcement actions without litigation or publicity. Given the hostile budgetary and oversight environment in Congress, I suspect the Labor Department has decided to avoid taking on the corporate interests that profit from this tax avoidance and unpaid labor. The chronically underfunded Wage and Hour Division still does not have a Senate-confirmed administrator, and the Republican members of the House Education and the Workforce Committee have made it clear that they frown on zealous enforcement of the law.
An earlier lawsuit against Fox Searchlight, another profit-making enterprise that exploited unpaid interns while making the movie Black Swan, reveals just how pernicious this practice really is. One plaintiff was a 2009 Wesleyan University graduate, but another was a 42-year old accountant with an MBA. The lesson? Once businesses get away with exploiting young people, it isn’t long before they treat older workers just as badly.
I first saw signs that the unpaid internship had slid far down the greasy slope when the Times and Wall Street Journal reported several years ago that adult dislocated workers, 30-somethings who had held jobs for many years, were reduced to doing significant, skilled work for free as “interns” in for-profit businesses while surviving on unemployment insurance. Everything was wrong with this: there was no educational component, the “interns” worked for several months without pay, and the employers escaped all of their normal obligations to pay wages and taxes.
Back in 2006, Anya Kamenetz nicely summarized the key ways that unpaid internships damage the labor market and the ability of the 99 percent to earn a decent living. They undermine the meritocracy that allocates jobs and rewards people for their skills and gumption rather than for the wealth of their parents; they depress wages by creating an oversupply of people willing to work not just for low wages, but literally for nothing; they depress expectations and create an over-identification with employers; and – as compared with paid internships — they damage the career prospects of the young people who take them. More recently, Kamenetz argued that the responsible institutions need to drag the unpaid internship mess out of the shadows and clean it up: “It’s time for employers, in cooperation with the government and colleges, to step up and create higher-quality apprenticeships, paid jobs, and co-op programs to replace the ill-defined, unpaid internship.” Given that many colleges and universities reportedly require students to take an internship before graduation, they do bear some moral responsibility for the educational content and legality of the experience. Apparently, however, they will be reluctant partners in this effort. When the Labor Department issued guidance on the six principles for a legal unpaid internship, a group of university presidents fired off a protest letter to Secretary Hilda Solis. The universities have a cozy deal collecting tuition for semesters in which their students get farmed out as free labor to employers, and they don’t want the government to interfere, no matter what the law requires.