Five Years of Lilly Ledbetter and Still More Work Needs To Be Done
Today marks the fifth anniversary of the Lilly Ledbetter Fair Pay Act. Named after Lilly Ledbetter, who worked for a production plant for years without knowing she was getting paid less than her male counterparts, the bill protects workers against pay discrimination. The Supreme Court had previously ruled that Ms. Ledbetter had filed her case too late, as the company’s decision on her case had been made years earlier. The law now says that pay discrimination on the basis of sex, race, origin, age, religion and disability occurs whenever an employee receives a discriminatory paycheck, when a discriminatory pay decision is adopted, or when a person is affected by a pay decision or practice. It is a great first step in giving women the tools to be economically secure in today’s workplace. But it’s not enough.
At a time when both women and men face the lingering effects of the Great Recession and stagnating wages at all education levels, a crucial step to improve women’s labor market success is to ensure a full recovery from the Great Recession. While it is true that women have regained pre-recession employment levels—contrasted with men, who are still 1.5 million short—women’s comparable return to 2007 employment is largely because the industries that have taken the biggest employment hits since 2007 also have a disproportionately larger share of male workers. However, within the majority of industries, women’s job growth has trailed men’s. Additionally, these numbers fail to address the fact that the working-age population (and with it the potential labor force) is growing all the time. Accounting for the growth in the potential female labor force, women are still 3.5 million jobs in the hole.
In this economy, it is clear that women need more jobs (as do men), but they also need pay equality. Women who work full time, year round still only earn 77 percent of what men earn, a pay gap that accumulates over time. For a 40-year working career, the average woman loses $431,000—no small amount. And, women with a college degree are no exception. Over their lifetime, women with at least a bachelor’s degree earn approximately $713,000 less than similarly educated men over their lifetime. Additionally, over half of women workers make poverty-level wages over half of the poverty-level wage workers are women (poverty-level wage workers are defined as workers who earn wage below what a full-time, full-year worker needs to give a family of four enough income to reach the poverty threshold). Fully, 32.0 percent of workers in 2011 earn poverty-level wages.
Good Eric Schmidt vs. Evil Eric Schmidt
Things are good for Google Executive Chairman Eric Schmidt. With $8.3 billion in his bank account, he’s the 49th wealthiest person in America. And he spent the week at the Davos World Economic Forum to celebrate.
During Schmidt’s Davos fireside chat, which was reported on by Henry Blodget at Business Insider, Schmidt had this to say, in the context of a discussion of income inequality:
“The stagnation in middle-class wages is not just a middle-class problem. It’s an economic problem. And it’s one of the main reasons that global economic growth is so lousy.
Why do stagnant middle-class wages hurt the economy?
Because the middle-class folks whose wages are stagnant are the global economy’s biggest spenders.”
He hit the nail right on the head. Wages for the vast majority of Americans have been basically flat for the last 40 years. To be specific, wages for the median worker have increased by just 5.0 percent between 1979 and 2012. During that time, workers gained a lot of education, and the economy as a whole became 75.4 percent more productive—we now produce more per hour worked than we ever have. Yet the typical American worker is being paid almost no more than his or her counterpart a half century ago.
The Tight Link Between the Minimum Wage and Wage Inequality
A higher minimum wage is an important way to address wage inequality, as the erosion of the minimum wage is the main reason for the increase in inequality between low-and middle-wage workers (in particular the 50/10 wage gap, that between the median and the 10th percentile earner). This is particularly true among women, the group for whom the wage gap in the bottom half grew the most. As the figure below shows, two-thirds of the increase in the 50-10 wage gap can be attributed to the erosion of the real value of the minimum wage. [The 50/10 wage gap grew 25.2 (log) percentage points between 1979 and 2009 and that two-thirds of this increase (16.5 percentage points, or 65 percent of the total) can be attributed to the erosion of the minimum wage.] The paper this figure draws on usefully and appropriately captures the spillover impact of the minimum wage—the impact on those earning above the legislated rate. This finding makes sense, since it was in the 1980s that the minimum wage eroded the most, and that was the same time period when the 50/10 wage gap among women expanded greatly. The erosion of the minimum wage explains over a tenth (11.3 percent) of the smaller 5.3 (log) percentage point expansion of the 50/10 wage gap among men. For workers overall more than half (57 percent) of the increase in the 50/10 wage gap was accounted for by the erosion of the minimum wage.

Life Is Worse In Right-To-Work States
University of Oregon labor scholar and EPI research associate Gordon Lafer often points out how relatively poor the quality of life is in right-to-work states, on average, compared to states that don’t restrict union contract rights.
Politico just came out with a new ranking of the 50 states, on a combination of 14 different measures of quality of life, including “high school graduation rates, per capita income, life expectancy and crime rate.” Then they average those 14 to create one overall ranking of the states.
The outcome suggests the opposite of corporate assertions that “right-to-work” states are doing better than others. According to Politico, 4 of the 5 best states to live in are non-right-to-work. In order, they are New Hampshire, Minnesota, Vermont, Utah, and Massachusetts.
Right-to-work states account for 8 of the 10 worst states, and all 5 of the 5 worst states (in order, from 46th-50th: Alabama, Tennessee, Arkansas, Louisiana, Mississsippi). The majority of RTW states are not only in the bottom half of the country, but in the bottom 20 of the 50 states.
Lafer’s home state, Oregon, where corporate backers are trying to pass a public sector right-to-work law, is ranked 23rd, outperforming nearly 2/3 of the states that currently have RTW laws.
The Federal Government Shouldn’t Directly Contribute To America’s Job-Quality Problem
As President Obama searches for ways to improve the wages of American workers by giving them a boost in bargaining for better job quality with their employers, he is limited by the dysfunctionality of Congress, which because of Republican opposition is unlikely to help even with a minimum wage increase. But the president, who manages the vast amount of work the government does through private contractors, should consider what he can do to set reasonable standards for the pay and compensation of the millions of employees of those federal contractors.
As EPI has estimated again and again, far too many people working for private firms— but for the benefit of the federal government, with their wages ultimately paid by the taxpayers—are likely working for poverty wages. This is unacceptable; it is damaging to those workers and their families, and it hurts the economy by reducing demand for goods and services—currently a problem of crisis proportions.
In November 2000, an EPI briefing paper by Chauna Brocht, The Forgotten Workforce, estimated that 162,000 federal contract workers earned less than the then-poverty level wage of $8.20 an hour (by poverty-level wage, we mean a wage for a full-time, full-year worker that would not lift a family of four out of official poverty). Most of the low-wage employers were large businesses and most were defense contractors.
What to Look for in the State of the Union
President Obama will deliver his State of the Union this coming Tuesday, the 28th. It seems obvious that no big new policy initiative that requires action from Congress will pass in the next year, given DC gridlock. This is a real shame, because the crisis of joblessness and failure to fully recover from the Great Recession remains the single largest economic challenge facing the country, and solving it would require a serious course correction on policy. The most reliable fix for this crisis of joblessness would be simply allowing public spending to rise to levels that characterized every other recovery since World War II. Even better would be to allow this spending to rise to levels characterizing the recovery from the similarly steep early 1980s recession. In short, what is needed is not some historically unprecedented stimulus program, but simply an end to the historically unprecedented austerity program now underway.

And it’s pretty easy to specify where the first $25 billion or so of this spending should be allocated: extending the Emergency Unemployment Compensation (EUC) program for long-term unemployed workers—a program begun in June 2008 when the unemployment rate was significantly lower than today and when long-term unemployment was literally half as high. I’d be shocked if the president did not issue a forceful call to pass EUC for the upcoming year.
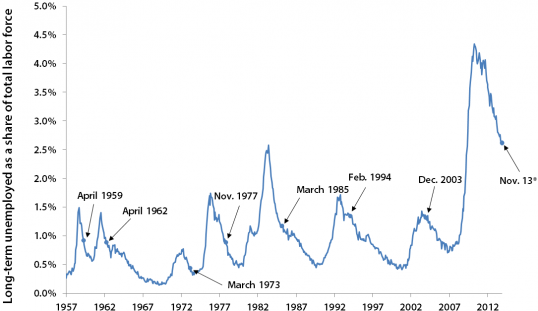
After this, a substantial program of public investment would be most welcome, boosting job-growth and economic activity in the short-run and boosting productivity in the longer-run. The talking point mobilized in favor of infrastructure investment—that it once was a bi-partisan priority—has the rare virtue of being true even today, so long as one listens to policy analysts and not politicians. For example, Martin Feldstein, Chair of the Council of Economic Advisors under Ronald Reagan, has endorsed a deficit-financed increase in infrastructure investment (granted, he endorses plenty of other things in that column that I’m not on board with, but the point remains). And Ken Rogoff, an economic adviser to John McCain in 2008, has also noted that infrastructure investment would be hugely beneficial in the current economic climate.1
Are House Republicans Sore Winners?
Treasury Secretary Jack Lew sent a letter to Congress yesterday warning that the federal government probably will breach the statutory debt limit in late February. To remind those who may have forgotten, there is no credible evidence that the U.S. economy is running up against any genuine economic constraint on debt. Interest rates remain historically low and federal budget deficits are actually closing historically rapidly. Yet because the United States (almost alone among advanced countries) has an arbitrary limit on the amount of outstanding federal debt that must be periodically renewed through legislative action, approaching the statutory debt limit provides members of Congress the chance to flirt with severe economic damage simply by refusing to raise the limit.
The House GOP leadership claimed that they did not want to get “even close” to a default. However, a spokesperson for House Speaker Boehner said a clean bill to raise the debt limit would not pass the House without some concessions to Republicans in order for them to “save face.” These concessions presumably would be more spending cuts. Given what should be considered a GOP “win” in the recent Murray-Ryan budget deal, one wonders what more do they want? It is worth taking a closer look at the GOP win in the budget deal and compare it to what might have been.
The chart below displays nondefense discretionary budget authority from fiscal year 2006 to fiscal year 2021 (when funds are appropriated by Congress, agencies are given budget authority to incur financial obligations—i.e., spend money). Nondefense discretionary spending includes spending for public investments such as roads, bridges, sewage systems, basic scientific research, and education—all the things that boost long-term economic growth. The Budget Control Act (BCA), the law that gave us the sequester, along with other steep cuts that have attracted less attention, specifies the limits on discretionary spending until 2021. It is specified in nominal dollar amounts, which rise over time. In inflation-adjusted terms, however, the spending is constant. But a better way to measure public spending is as a percentage of GDP—basically looking at public spending in relation to income available to pay for that spending.
The Robots Are Here and More Are Coming: Do Not Blame Them for our Wage or Job Problems
The “robots are coming” narrative dominating discussions of the economy was popularized by Erik Brynjolfsson and Andrew McAfee in their 2011 book, Race Against the Machine. They have built on that theme in the richer, deeper The Second Machine Age (W.W. Norton, 2014). The first half of the book provides a valuable window, at least for a non-technologist like me, into past developments and the future trajectory of digitization. Their claim is that digitization will do for mental power what the steam engine did for muscle power—that is, quite a bit, transforming our lives at work and play.
The remainder of the book dwells on the role of digitization in generating both bounty (more consumer choice and greater output, wealth, and income) and spread (greater inequalities of wages, income, and wealth). In treating these topics, they heavily rely on the work of others. As in their last book, they do not provide much direct evidence of the connection between technological change and wage inequality. I study these issues and believe they are wrong to tightly link digitization and robots to wage inequality and the slow job growth of the 2000s. Although the authors claim “technology is certainly not the only force causing this rise in spreads, but it is one of the main ones” my fear is that this book, like their last one, will fuel the mistaken narrative that technology is responsible for our job and wage problems and that we are powerless to obtain more equitable growth.
Let me start where we agree and where I very much appreciate their argumentation. Brynjolfsson and McAfee are very clear that we are experiencing a dramatic growth in wage, income, and wealth inequality; that living standards have faltered for a significant share of the population; and that these are challenges that must be addressed. They rightly fear that current inequities will generate greater future inequity: They argue that current wealth solidifies and expands inequality through the political process and worry that inequality impedes social mobility—the degree to which a child’s chances are linked to his or her parents’ current station. Inequality begets greater inequality. I appreciate their refutation of denialism and ‘so whatism’.
Their weakest case is that digitization is associated with the slow job growth of the last 15 years. The authors review all the reasons why economists find such a claim untrue, including 200 years of history disproving a link between technology and slow job growth. They propose a few reasons why things may be different now. However, their only evidence is that employment and productivity grew in tandem for many decades but became decoupled in the late 1990s and offer their “reading of technology” as an explanation. In fact, there’s a simple answer to the riddle of slow job growth: slow economic growth resulting from the collapse of two asset bubbles and inadequate policy responses. Job growth occurs when economic growth exceeds productivity. Simply put, if workers can produce 2 percent more this year than last year, the economy can grow 2 percent without adding any employment. Thus, the economy must grow faster than productivity to create jobs, something that has not happened in the unique circumstances of the 2000s.
Recommitting to Dr. King’s Goals Would Help All Working Families
Monday’s celebration of Dr. Martin Luther King Jr.’s legacy presents the perfect opportunity to reflect on how far the country has come and to acknowledge the undeniable advancements African Americans have made, and to consider the goals that remain unmet. Last year, EPI released the Unfinished March, a series of reports that detailed the remaining steps to fully achieve the goals of the March on Washington for Jobs and Freedom, the setting for King’s “I Have a Dream” speech. Yet to be achieved are the hard economic goals, critical to transforming the life opportunities of African Americans. They include decent housing, adequate and integrated education, full employment, and a national minimum wage that can realistically lift a family out of poverty.
The employment trends for African Americans over the past decade, as seen in this week’s Economic Snapshot, show just how much work remains to be done just to achieve the goal of full employment. While the economic woes of the past few years have worsened labor market prospects for all workers, for African American workers the employment situation is significantly worse, akin to depression-level conditions. An estimated 19.6 percent of black workers (nearly one in five) were unemployed at some point in 2013. Furthermore, given unemployment projections for 2014, it is likely that 17.4 percent of black workers will be unemployed at some point this year.
Needless to say, it doesn’t have to be this way. Recommitting ourselves to achieving Dr. King’s goals means implementing policies that would aid all U.S. workers, including large-scale ongoing public investments, the restoration of public services and public-sector employment cut in the recession and its aftermath, and the renewal of federal unemployment insurance benefits. Passing these policies would not only celebrate Dr. King’s legacy, but also help working families, of all races, across the country.
New Analysis of the Labor Market Outcomes of Employment- and Family-Based Immigrants Can Improve Policymaking
Unlike other developed countries such as Australia and Canada, the U.S. government simply does not collect and analyze enough information on the labor market outcomes of immigrants who are issued visas that grant them legal permanent resident (LPR) status. Especially when it comes to longitudinal data that track the same immigrants over time in order to see how their situation has changed. This dooms policymakers to make uninformed decisions based on assumptions or that are influenced by lobbying from interest groups. That’s why new (and as-of-yet unpublished) research from Professors Mark Rosenzweig (Yale University) and Guillermina Jasso (New York University) is groundbreaking: it analyzes data from Princeton University’s New Immigrant Survey (NIS) and offers a glimpse at how immigrants in the United States are performing in the labor market over time and by visa category.
The NIS “is a nationally representative multi-cohort longitudinal study of new legal immigrants and their children to the United States,” and one of the most useful data sets available on U.S. immigrants. The first cohort of immigrants participating in the NIS were interviewed in 2003, and follow-up interviews were conducted from 2007 to 2009. Rosenzweig recently presented their research based on these survey data at an informative conference on family immigration hosted by the U.S. Department of Homeland Security and the Organisation for Economic Cooperation and Development (OECD). He showcased some of the first analyses of the NIS’s longitudinal data on the labor market performance of immigrants who came to the United States through the Diversity Visa (DV) lottery and the employment-based (including spouses) and family-based immigrant visa categories; the latter of which represent two-thirds of all immigrant visas issued (by far the highest share in the OECD), and allow foreign citizens to join a spouse or parent who is a U.S. citizen or LPR, or to join the son, daughter, or sibling of a citizen already in the United States. (Lindsay Lowell of Georgetown also presented notable new research and findings documenting the growth of the family-based visa category in the United States since the 1970s.)