November 2000 Briefing Paper
THE FORGOTTEN WORKFORCE
More Than One in 10 Federal Contract Workers Earn Less Than a Living Wage
by Chauna Brocht
The living wage movement was born out of frustration with Congress’ failure to enact a minimum wage that lifts families out of poverty.1 Initially, living wage activists focused their efforts on passing ordinances at the local level to ensure that the workers employed with government funds were paid above a poverty-level wage. After claiming victories in over 50 localities around the country, the living wage movement is now turning its attention to a group of workers laboring behind the scenes of federal government: those people who work on federal contracts yet earn only poverty-level wages. Recent legislation introduced in Congress would require businesses to pay workers employed on federal contracts a living wage, that is, the amount a full-time worker would need to earn to support a family of four at the poverty line (i.e., $17,050 a year or $8.20 an hour in 2000).
This examination of federal living wage legislation finds that:
- According to data from fiscal year 1999, an estimated 162,000 federal contract workers earn less than $8.20 an hour2 and thus would potentially be covered by proposed living wage legislation. These workers represent 11% of the total 1.4 million federal contract workers in the United States. An additional 59,000 workers earning as much as a dollar an hour more than the poverty-level wage could also benefit from the spillover effect of living wage legislation. Note that, because the federal government does not collect data on federal contract workers, this study uses data from the General Services Administration to estimate the number of these workers earning less than $8.20 an hour.
- The majority of federal contractors paying poverty-level wages are defense contractors (62%). Most contractors are large businesses (59%), not small businesses or nonprofit organizations.
- Private-sector workers earning less than a living wage are mostly female, adult, full-time workers, and they are disproportionately minorities.
- In 1999, only 32% of federal contract workers were covered by some sort of law requiring that they be paid at least a prevailing wage, which is usually defined as the median wage for each occupation and industry. But even this minority of covered workers are not guaranteed a living wage under current laws. For example, the Department of Labor has set its minimum pay rate at a level below $8.20 an hour for the workers covered by the Service Contract Act in 201 job classifications.
Most federal contract workers employed by private business do not enjoy wages and benefits comparable to their counterparts in the federal workforce. In fact, the federal government currently does nothing to ensure that contract workers employed with federal funds are paid a living wage.
Recent legislation introduced by Rep. Luis Gutierrez (D-Ill.)3 would require businesses to pay workers employed on federal contracts a living wage, defined as $8.20 an hour.4 If federal living wage legislation is expanded to include direct federal employees, an additional 274,000 federal workers would also receive a wage increase.
The lack of data on federal contract workers and who these workers are makes providing a profile of these low-wage earners difficult. Further research, such as a survey of contracting firms, is needed in order to know more about these workers and their economic circumstances.
What is a living wage law?
Living wage ordinances are based on the principle that anyone who works full time should be able to support a family above the poverty line. The rationale behind the ordinance is that local governments, which are responsible for developing anti-poverty programs, should not contract with or subsidize employers who pay poverty-level wages.
A living wage ordinance requires certain employers to pay wages that are above federal or state minimum wage levels. Only a specific set of workers are covered by living wage ordinances, usually workers employed by businesses that have a contract with a city or county government, or who receive economic development subsidies from the locality. Living wage ordinances have been enacted in over 50 localities around the country (Table 1).
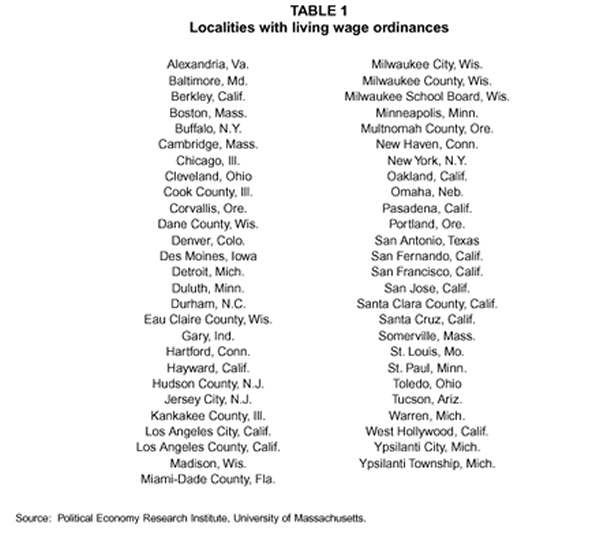
The living wage level is usually set between 100% and 130% of the wage a full-time worker would need to earn to support a family of three or four above the federal poverty line. The wage rates specified by living wage ordinances range from a low of $6.25 in Milwaukee, Wis. to a high of $12.00 in Santa Cruz, Calif. In addition to setting wage levels, many ordinances also have provisions regarding benefits (such as health insurance and paid vacation), labor relations, and hiring practices.
The living wage of $8.20 an hour in the legislation introduced by Rep. Gutierrez is based on the wage a full-time worker would need to earn in order to support a family of four above the poverty line ($17,050 annually in 2000). This proposed legislation would apply only to workers employed on contracts for goods or services and would not cover direct federal employees. The proposed legislation also excludes workers employed by small businesses or nonprofits; this exclusion would reduce the number of covered workers to about 122,000.
The wages and benefits of private sector and federal workers
The federal government saves money by contracting work to employers who pay less than a living wage. Even the federal government jobs at the low end of the pay scale have historically paid better and have had more generous benefits than comparable private sector jobs. As a result, workers who work indirectly for the federal government through contracts with private industry are not likely to receive wages and benefits comparable to federal workers.
As Table 2 shows, fewer direct federal workers are paid poverty-level wages than private sector workers – just 9% of the direct federal workforce earns less than $8.20 an hour, compared to 28% of workers in the private sector. Federal contract workers are helped somewhat by the Service Contract Act and the Davis-Bacon Act, but even with this existing legislation 11% of the federal contract workforce still earns less than $8.20 an hour.
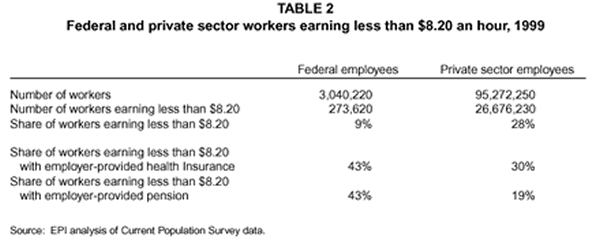
Moreover, the direct federal workers who do earn poverty-level wages are more likely than their private sector counterparts (including federal contract workers) to have health insurance and pensions through their employer. Table 2 shows that 43% of these federal workers receive health insurance and pension coverage through their jobs. By contrast, only 30% of low-wage private sector workers receive health insurance through their employer, and just 19% receive employer-provided pension coverage.
Characteristics and location of poverty-level workers
Table 3
shows the demographic characteristics of private sector workers (including federal contract workers) earning less than a living wage. The table shows that these workers are mostly female, adult, full-time workers, and they are disproportionately minorities.
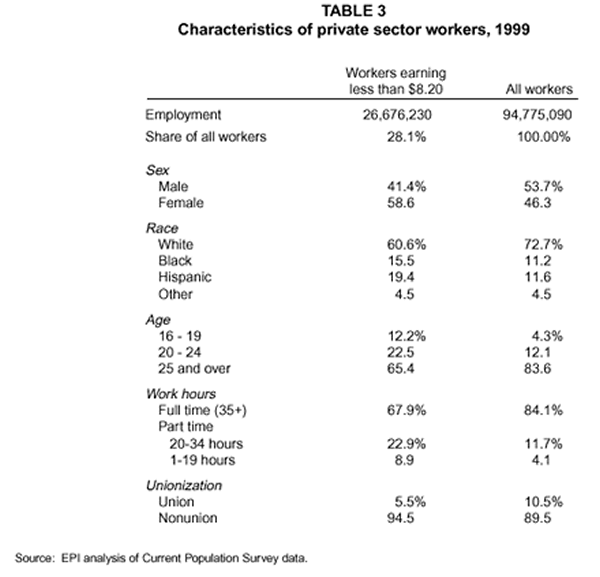
Women represent 59% of workers earning less than $8.20 an hour, even though they make up only 46% of the private sector workforce. Blacks and Hispanics are also over-represented. Blacks are 11% of the private-sector workforce but 16% of those earning less than $8.20; Hispanics are 12% of the private sector workforce but 19% of those earning less than a living wage.
An overwhelming majority (88%) of workers earning less than $8.20 an hour are adults aged 20 and older. About 68% are employed full time. Only a small 6% of these workers are union members.
Table 4 shows the distribution of low-wage federal contract jobs across the 50 states and the District of Columbia. Five states have a particularly high concentration of these jobs: California (15.6% of all low-paying federal contract jobs); Virginia (10.3%); Maryland (5.8%); Texas (5.1%); and the District of Columbia (4.3%).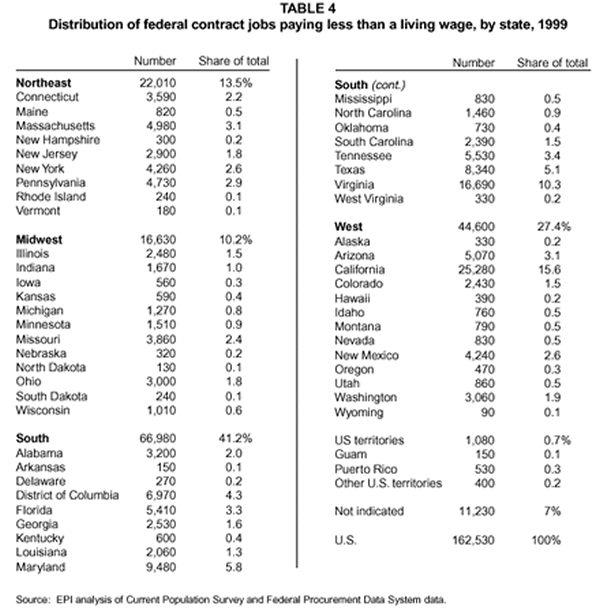
Low-wage federal contract jobs by industry
In 1999, the federal government contracted for $199 billion worth of goods and services (General Services Administration 2000) – roughly 25% of these federal contracts were for the purchase of supplies and equipment, and 75% were for the purchase of services (including research and development).
Table 5 shows the distribution of jobs paying less than $8.20 an hour by industry.5 The share of low-wage federal contract jobs in each industry is determined by the total dollar value of the contracts in the industry and the share of low-wage workers in that industry.6
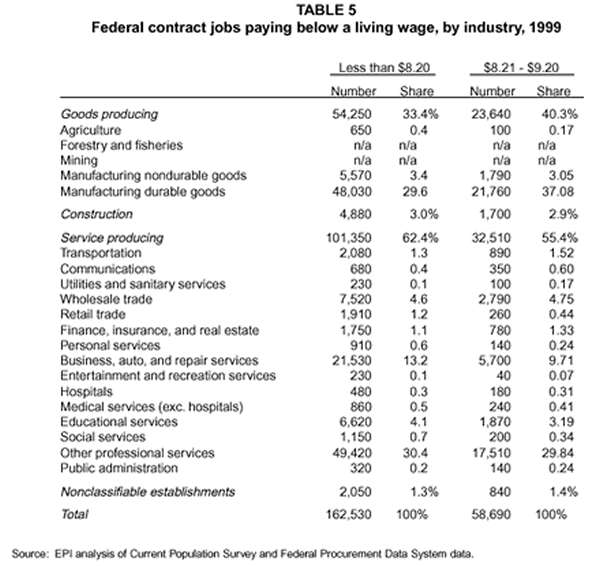
Over 62% of jobs paying below $8.20 were in service-producing industries.7 Among service-producing industries, most federally contracted low-wage jobs were in business, auto, and repair services and professional services. Low-wage occupations in the professional services industry include file clerks, welfare service aides, and teachers aides. Janitors are an example of a low-wage occupation in the business, auto, and repair services industry.
A third of the low-wage contract jobs were in goods-producing industries, such as manufacturing; examples of low-wage manufacturing occupations include hand packers and hand cutters. About 3% of low-wage contract jobs were in construction industries (3%);8 painters are an example of workers in this industry who might earn less than a living wage.
Employers paying less than the living wage
Federal agencies contract for goods and services from private sector companies, nonprofits, and state and local governments. In this section we report the types of contractors that directly employ these low-paid federal contract workers and the federal agencies for whom these workers indirectly work.
Table 6 shows the federal agencies that contract with businesses that pay workers less than $8.20 an hour. The share of low-wage federal contract jobs contracted by each agency is determined by the total dollar amount of the contracts and the share of low-wage workers in the industries.9
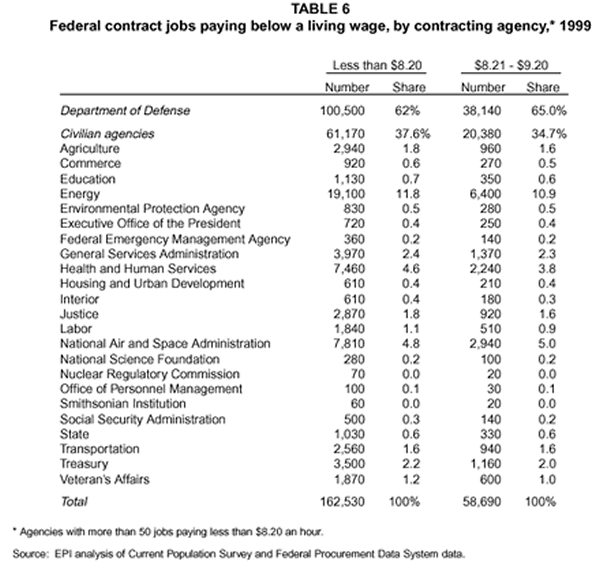
Over 100,000 (62%) of low-wage federal contract jobs are through the Department of Defense.10 The civilian agencies with the largest number of low-paid contract jobs are the Department of Energy (19,100 jobs), the National Air and Space Administration (7,810), the Department of Health and Human Services (7,460), the General Services Administration (3,970), and the Department of the Treasury (3,500). These agencies all have a slightly higher share of low-wage jobs compared to the share of contracts through their agency. For instance, the Department of Health and Human services accounts for 2.5% of federal funds spent on contracts, but accounts for 4.6% of jobs that pay below $8.20 an hour.
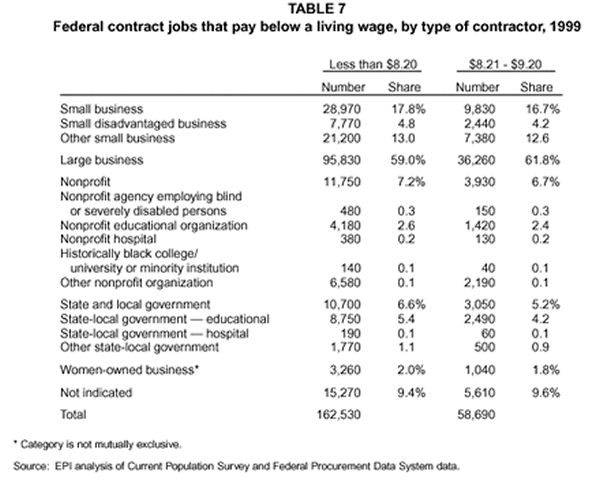
Table 7 lists the types of contractors paying below a living wage. A majority (59%) of these jobs are in large businesses. The next largest share (18%) of jobs are within the small business sector,11 followed by nonprofits (7%), and state and local governments (7%). If small businesses and nonprofits are exempted from the law, then the number of workers who would receive the wage increase is reduced to 122,000, or by about 25%.
The failure of current wage standards
Living wage ordinances were first created because local governments had been contracting out jobs without setting standards regarding pay. In the case of federal contract workers, some laws, such as the Service Contract Act and the Davis-Bacon Act, regulate wages for certain types of contracts. However, these regulations do not ensure that workers are paid above a poverty-level wage; many workers are excluded from coverage by these laws, and the prevailing wage can be set below $8.20 an hour.
Some service workers on federal contracts are covered by the Service Contract Act, which requires workers to be paid the prevailing wage. The prevailing wage is determined by the Department of Labor, and is usually defined as the median wage (the wage where half of all workers earn more and half earn less) or the average wage for each occupation and locality. The Davis-Bacon Act is a similar law that covers the construction industry.
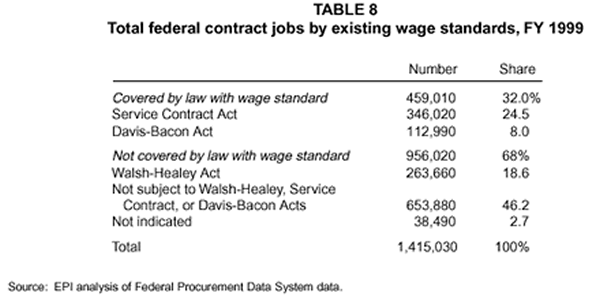
There are, however, many exemptions to these laws. For example, contracts for the maintenance and repair of computers are exempt from the Service Contract Act. In fact, as Table 8 shows, in 1999 only 32% of federal contract workers were covered by laws with wage standards; 25% were covered by the Service Contract Act, and 8% were covered by the Davis-Bacon Act.
One drawback to using a prevailing wage standard is that it can be set as low as the minimum wage. Thus, a prevailing wage law does not guarantee that workers will be paid a living wage. As a consequence, the Department of Labor has set the prevailing wage at a level below what is considered a living wage for 201 job classifications covered by the Service Contract Act.12 The job classifications for which wages are set below $8.20 in at least some areas of the country include accounting clerk, bus driver, child care attendant, corrections officer, court security clerk, food service worker, janitor, laundry worker, mail clerk, parking lot attendant, recepti
onist, and vending machine repairer.
Because we have excluded all workers covered by the Service Contract Act and the Davis-Bacon Act from this analysis, we actually underestimate the number of federal contract workers who earn less than a living wage.
Conclusion
Pressure on federal agencies to reduce the size of their workforce has created incentives for contracting for goods and services to private businesses. Most of the workers employed by these private businesses do not enjoy wages and benefits comparable to federal workers.
In fact, an estimated 162,000 federal contract workers don’t earn a wage sufficient to lift a family of four out of poverty. Just under 60% of these poorly paid workers work for large firms, and 62% work on Department of Defense contracts.
Most of these low-wage workers are women, adults, and work full time. While a majority of these low-wage workers are white, blacks and Hispanics are over-represented among those earning poverty-level wages.
Currently, the federal government does nothing to ensure that contract workers employed with federal funds are paid a living wage. Only one-third of contract jobs are covered by a wage standard, and even the standards that cover these workers don’t require that they are paid a living wage. Living wage legislation would ensure that all federal contract workers could support their families above the poverty line.
November 2000
Methodology
The federal government does not collect data on the number of federal contract workers or who these workers are.13 For some idea of the characteristics of federal contract workers, we looked at the characteristics of private sector workers in general (the majority of federal contract workers work for the private sector).
To estimate the number of low-wage workers covered by federal contracts, we combined General Services Administration (GSA) data on federal contracts with data from the Current Population Survey on the share of low-wage workers. We were able to use the dollar value of a contract to estimate the number of workers on that contract.
We then estimated the number of low-wage workers on the contract by using the proportion of low-wage workers among private sector workers in that industry. This assumes that the same proportion of contract workers earn poverty level wages as workers in the private sector. We could not make this assumption for workers covered by the Service Contract Act or the Davis-Bacon Act, because these workers are paid the prevailing wage (the location-specific median wage for their occupation). Under the conservative assumption that all workers on contracts covered by the Service Contract Act and the Davis-Bacon earn above $8.20 an hour, workers on these contracts were excluded from our analysis. Because there is evidence that some workers covered by these laws do earn less than $8.20 an hour (see below), our estimate of the number of contract workers who earn less than a living wage is conservative.
The GSA data provided information on where the work on federal contracts was performed, which federal agencies contracted for the work, and what types of businesses the contracts are with (see the data appendix for a more detailed explanation of the methodology).
Data Appendix
Data on contracts were obtained from the Federal Procurement Data System (FPDS), collected by the U.S. General Services Administration. The FPDS contains nearly 500,000 records of transactions over $25,000 that occurred during fiscal year 1999 (October 1, 1998 – September 30, 1999). Each record contains data on the dollar amount of the action, the location of the work performed, the contracting agency, the industry of the business doing the work, and other information on the type of business.
To estimate the number of jobs on each contract, we matched the Standard Industrial Classification (SIC) code for each contract in the FPDS to the industry codes used in the 1998 Domestic Employment Requirements Matrix from the Bureau of Labor Statistics (BLS). We used the number of jobs created per million dollars of sales14 from the matrix to estimate the number of jobs created15 on each contract action, based on the dollar value of the contracts.
For each broad industrial classification, we estimated the proportion of workers earning below $8.20 an hour and $9.20 an hour using the Current Population Survey. We then multiplied this proportion by the number of workers per contract in each industry to get the total number of workers that earned less than $8.20 an hour and $9.20 an hour. Because we use a national proportion of low-wage workers, this method may over-estimate the number of affected workers in high-wage states and under-estimate the number in low-wage states.
For example, for a firm in the building services industry with a contract worth $5 million, we multiplied 5 by 30 (the number of jobs per $1 million of sales for that industry). The result is an estimated 150 jobs. We then multiplied the number of jobs on that contract by the share of low-wage jobs in the building services industry (7%). Thus, our estimate was 10 jobs paying less than $8.20 for that contract.
This methodology assumes that the same proportion of contract workers earn poverty level wages as workers in the private sector. We could not make this assumption for workers covered by the Service Contract Act or the Davis-Bacon Act, because these workers are paid the prevailing wage (the median wage for their occupation). Thus, we excluded workers covered by the Service Contract Act and Davis-Bacon Act from our analysis.
Using the data collected in the FPDS on each contract, we were able to generate Tables 4-9. To determine the characteristics of workers earning less than $8.20, we used Current Population Survey ORG data. (See the data appendix of Bernstein and Schmitt (1998) for more details.)
Endnotes
1. The last minimum wage increase went into effect in 1996-97, when the minimum wage was raised from $4.25 to $5.15. Congress is currently considering legislation to increase the minimum wage to $6.15. Without another increase, the real value of the minimum wage will fall to $4.67 (1999 dollars) by the year 2003 (according to inflation projections by the Congressional Budget Office).
2. We estimated the number of jobs, regardless of whether the jobs are full time or part time (in other words, these jobs are not expressed as “full time equivalent” jobs).
3. Senator Paul Wellstone (D-Minn.) has also announced plans to introduce federal living wage legislation.
4. However, as the legislation is currently written, some of these workers would be exempt because they work for small businesses or nonprofits.
5. We are unable to report the number of jobs by occupation.
6. For the total dollar value of contracts by each industry, see the Federal Procurement Report (General Services Administration 2000).
7. The share of low-wage workers in service industries is potentially larger. We excluded workers covered by the Service Contract Act because these workers are paid the prevailing wage, but there are some job classifications under that act that pay less than $8.20 an hour.
8. The share of low-wage workers in the construction industry is also potentially larger. We excluded workers covered by the Davis-Bacon Act because these workers are paid the prevailing wage, but there are some job classifications under that act that pay less than $8.20 an hour.
9. For the total dollar value of
contracts by each agency, see the Federal Procurement Report (General Services Administration 2000).
10. This is below the share of total federal funds spent on Department of Defense contracts (67%).
11. The definition of a small business varies by industry. The following are the most common small business size standards: fewer than 500 employees for most manufacturing and mining industries; fewer than 100 employees for all wholesale trade industries; less than $5 million for most retail and service industries; less than $17 million for most general and heavy construction industries; less than $7 million for all special trade contractors; and less than $0.5 million for most agricultural industries.
12. Department of Labor memo to Rep. Gutierrez dated March 24, 2000.
13. Legislation introduced earlier this year – the Truthfulness, Responsibility, and Accountability in Contracting Act (S. 2841 and H.R. 3766) – would, among other things, require all agencies to track the size of their contractor workforces, for specific contracts as well as for all contracts combined, and would require the Office of Personnel Management and the Department of Labor to report to Congress on how contractor wages and benefits compare to those earned by federal employees.
14. We included only jobs created in the industry where the sales occurred.
15. Because some dollar amounts on the contract actions were negative (when contractors refund unspent money), some actions were associated with negative job creation.
References
Bernstein, Jared, and John Schmitt. 1998. Making Work Pay: The Impact of the 1996-97 Minimum Wage Increase. Washington, D.C.: Economic Policy Institute. General Services Administration. 2000. Federal Procurement Report, FY 1999 Through Fourth Quarter. Washington, D.C.: General Services Administration.
