In Memoriam: Lynn Williams
Lynn Williams—president of the United Steelworkers of America from 1983 to 1994—died on May 5 at the age of 89.
Lynn was an extraordinary union leader—smart, compassionate, and a visionary. His strength and creativity helped protect and expand his union through the crisis years of mass layoffs, bankruptcies, and industry consolidation. He was also an enthusiastic and loyal supporter of EPI from the very beginning.
I first met Lynn in the mid-1970s when he was USWA’s Secretary-Treasurer. I was involved in an effort to revive a shut down steel mill in Youngstown, Ohio under worker and community ownership. The Steelworkers in Youngstown were of course totally supportive, but there was skepticism and even some hostility from the international union in Pittsburgh. But Lynn saw something important in the effort, and he helped steer me through some political land mines.
The Youngstown project failed, but the idea did not. And when Lynn became union president he aggressively and successfully used worker ownership—including seats on company board of directors—to negotiate agreements that kept at least 25 steel companies from disappearing.
The President Has This One Exactly Right: Cutting Corporate Taxes Should Not Be a Priority, but Extending Unemployment Insurance Should Be
Today (or possibly tomorrow) the House of Representatives will vote on H.R. 4438, which would permanently extend and expand the research and development tax credit. But unlike every other piece of legislation sponsored by the House GOP, this bill does not offset the $156 billion 10-year price tag. Apparently, tax cuts for corporations are such a high priority that passing them does not require the sacrifice elsewhere in spending or taxes that the House GOP demands for every other fiscal change. This flies in the face of everything the House GOP has done in this Congress. Last month, for example, House Republicans themselves passed a budget resolution that required offsetting with other revenue measures any tax extenders that were made permanent.
H.R. 4438 will cost 15 times more than the proposed extension of emergency unemployment benefits, which House Republicans insist be offset. And it is more than double the discretionary funding increases in the Bipartisan Budget Act of 2013, all of which were offset. President Obama has rightfully issued a statement that he would veto this bill if it passes.
House Republicans are making their priorities clear by rushing to make business tax cuts permanent without offsets and calling for raising taxes on millions of working families and students by letting important improvements to the Earned Income Tax Credit, Child Tax Credit, and education tax credits expire. Not to mention failing to reverse the cut-off of extended unemployment benefits at a time when long-term unemployment remains higher than it has ever been in the past when extended benefits were ended. If the House GOP were truly concerned about long-term fiscal challenges, then they would offset tax breaks by permanently closing other tax loopholes.
No Sign of Labor Shortages in Construction: There are Seven Unemployed Construction Workers for Every Job Opening
The National Association of Home Builders wants you to believe their members face a serious shortage of construction workers, even though construction employment is more than 1.7 million jobs below its pre-recession peak, and unemployed construction workers outnumber job openings in construction by well over seven-to-one. More and more news stories, even in respected sources like NPR and the Wall Street Journal, repeat the builders’ talking points and toss around wage figures with very limited resemblance to reality. (A healthy dose of skepticism is in order when employers complain about high wages. How many tile setters make “$100,000 a year,” which the WSJ story suggests is now the pay for experienced workers in Denver? Not many. The median hourly wage for tile setters in Denver is less than $18 an hour, and nationally, even the 90th percentile wage for tile setters is only $73,510 a year.)
The best way to identify a tight labor market, let alone a market beset by actual labor shortages, is to examine wages. Basically, if wages aren’t rising, the labor market isn’t tightening; if they don’t rise strongly, there are no shortages. As Adam S. Posen and David Blanchflower argue in a recent paper, if wages aren’t rising, it’s a sign of labor slack, weak demand, and a weak economy.
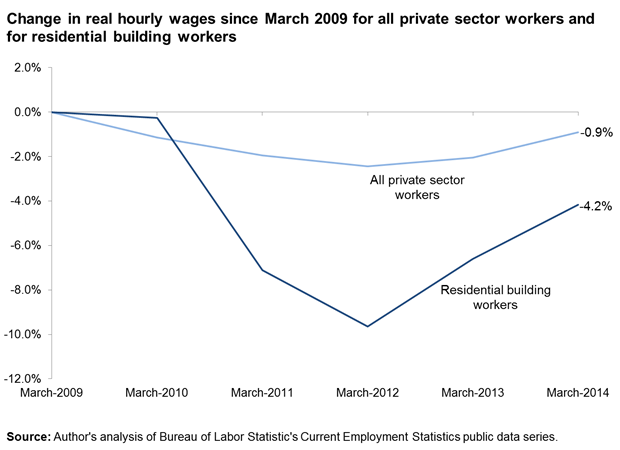
So what’s happening in residential construction? The Wall Street Journal describes a frenzied search for skilled labor, causing pay to soar “to boom-time levels and beyond.” While it’s true that construction wages have risen over the past two years, they’ve risen from such a deep depression that they are still well below the levels of 2009. In fact, the real hourly wages of residential building workers are still 4.2% below 2009, a loss significantly deeper than that of the overall private sector workforce, whose wages are 0.9 percent below 2009.
A Decidedly Weird Report
Today’s jobs report was, to say the least, strange. The first look was exciting—288,000 payroll jobs added! Now that is the kind of job growth that would get us back to a healthy labor market relatively soon. If we were to keep up this pace, we would get back to pre-recession labor market conditions by the end of 2016. Even I could live with that.
The second look was good, too—the household survey showed the unemployment rate plunged to 6.3 percent. But I should have stopped looking there, because the rest was pretty bad. It turns out the drop in unemployment was entirely due to people dropping out of the labor force. Employment in the household survey actually declined, and the labor force participation rate fell back down to its lowest point of the recovery. Our estimate of the number of “missing workers” (workers who are not working or actively seeking work but who would be if job opportunities were strong) increased to an all-time high of 6.2 million. If those missing workers were in the labor force looking for work, the unemployment rate would be 9.9 percent instead of 6.3 percent.
So this was one of those cases where the two surveys were telling completely different stories—the establishment survey was strong, the household survey was weak. As always, when the two surveys tell different stories, the rule of thumb is to place much more weight on the payroll survey, since it is larger and less erratic. But the weak household survey certainly dampens the fun of the payroll survey. If the economy really were entering a new stage of much stronger job growth, I’d expect both surveys to regularly be posting strong gains. That was far from the case in April.
The African American Labor Force Shows Remarkable Resilience
Today’s jobs report brings some positive news to balance the disappointing first quarter estimates of GDP growth (a meager 0.1 percent) announced earlier this week; there were 288,000 jobs added in April. At the same time, the unemployment rate fell to 6.3 percent, but this decline was entirely the result of people leaving the labor force, not people finding work. While all major race and ethnic groups experienced a similar pattern of declining unemployment rates and labor force participation rates in April, there are some interesting insights into the upward trend in the black-white unemployment rate gap to be gained from today’s numbers.
As unemployment rates have gradually declined over the last four years, the black-white unemployment rate ratio has been increasing and is currently higher than it was before the recession, meaning that there’s been less improvement in the black unemployment rate than the white rate. Indeed, the African American unemployment rate remains 3.3 percentage points higher than the 2007 average while the white unemployment rate is just 1.2 percentage points higher than in 2007.
Further, when we look at the difference between the current and 2007 employment-population ratios, we find that the decline in the share of employed working age adults in the population was greater for African Americans (down 4.6 percentage points) than for whites (down 3.9 percentage points).
Number of Missing Workers Jumps to All-Time High
After a few months of the labor force participation rate (LFPR) showing what was hopefully early signs of strength, it dropped back down to its low of the recovery in March. The biggest drops in labor force participation in March were among young workers; the LFPR of workers under age 25 dropped 1.3 percentage points, from 55.6 percent to 54.3 percent. (However, these series are erratic due to small sample sizes, and the April decline in the under-25 LFPR was simply a reversal of its jump up in March.) The biggest drop in LFPR in April was among men under the age of 20. To my knowledge, data on unemployment insurance exhaustions by age don’t exist, but it is unlikely that young workers are a big proportion of exhaustions. This means that the April drop in labor force participation is likely not being driven by the expiration of federal unemployment insurance benefits last December as some have suggested, but simply by the weak labor market.
There is currently an all-time-high of 6.2 million missing workers (potential workers who are neither working nor actively seeking work due to the weak labor market). Almost a quarter of them (1.4 million) are under age 25. The figure below shows that the unemployment rate for young workers would be 18.4 percent instead of 12.8 percent if the missing young workers were in the labor force looking for work and thus counted as unemployed.
For a complete picture of the labor market prospects facing the new cohort of young adults graduating from high school and college this spring, see the Class of 2014 report released yesterday. It includes, for example, a detailed discussion of the finding that there is little evidence that today’s missing young workers are “sheltering in school”.

Are Today’s Minimum Wage Workers Worth Less?
Sen. Mike Enzi (R-WY) is a nice, older man who remembers the years of his youth with a golden glow. His father owned a shoe store, so Enzi had a comfortable life. He went to college and eventually took over his dad’s business. He says he was paid the minimum wage when he started out as a “stock boy,” so he ought to have some empathy for minimum wage workers today, many of whom don’t have business owners for fathers and have to support themselves and other family members, as well.
But instead, Enzi voted against raising the minimum wage in the U.S. Senate yesterday. In fact, he voted against even bringing the issue up for debate. He doesn’t think today’s minimum wage workers are worth as much as he was. Back in 1963, when Enzi was 19, the minimum wage was $1.25, which would be $9.65 today. Enzi doesn’t want to debate a bill to raise the minimum from $7.25 an hour, apparently believing that he was worth $2.40 an hour more than today’s minimum wage workers, many of whom are in their thirties, veterans, or parents. More than 40% of those who would benefit from an increase to $10.10 an hour have been to college and have more education than Enzi did when he earned the minimum wage.
Why doesn’t Enzi think these workers are worth as much as he was? As Paul Whitfield reports in the Los Angeles Times, Sen. Enzi says today’s workers “don’t know how to interrupt their texting to wait on a customer.” Really? More than half of the workers who would benefit from a raise to $10.10 an hour are over 30, and more than 1 in 10 are at least 55 years old.
Whether from scorn or simple lack of empathy for their fellow citizens, Enzi and his fellow Republican senators who have voted against helping the long-term unemployed, voted to cut families off food stamps, or voted to deny workers an increase in the minimum wage to the level of purchasing power Enzi received 50 years ago are consistent in pulling up the ladder of opportunity after climbing it themselves—or after having been set at the top by family circumstances. From way up there in the one percent, the people at the bottom apparently look undeserving.
EPI Stands By the Rigorous Methods and Findings of Its Report on Privately Run Charter Schools and the Rocketship Company
Last week EPI published the report Do Poor Kids Deserve Lower-Quality Education Than Rich Kids? Evaluating School Privatization Proposals in Milwaukee, Wisconsin, authored by University of Oregon associate professor Gordon Lafer, an EPI research associate. The paper includes a detailed examination of a “blended learning” model of education that replaces teachers with online learning for part of the school day, long a source of controversy in education policy debates. This approach is exemplified by the Rocketship chain of charter schools, which is being promoted for expansion in Milwaukee.
EPI maintains the highest standards of rigorous research, and this report is no exception. Dr. Lafer’s description of Rocketship’s model was largely based on Rocketship’s own corporate documents, which were cited repeatedly in the report. In addition, the author interviewed Rocketship representatives both in Milwaukee and at the company’s national headquarters, including several top executives.
After the report was published, the author emailed a copy to Rocketship executives, inviting their comment and specifically asking them to identify any particular facts in the report they might believe to be incorrect.
While Rocketship responded by issuing a statement denouncing EPI’s report, the statement is a recitation of talking points rather than a rebuttal of the report’s rigorously researched and meticulously documented findings. Indeed, the company has not identified a single inaccurate fact in the report. Further, neither this report nor EPI as an organization is opposed to charter schools per se; indeed, the report concludes with proposals for accountability standards that would allow charter schools to function on an equal footing with public schools.
What to Watch on Jobs Day: Will the Number of Missing Young Workers Decline Again?
There are currently nearly one million “missing workers” under the age of 25. (In total, there are 5.3 million missing workers, who are neither working nor actively seeking work due to the weak labor market.) In March, the total number of missing workers dropped substantially, due almost entirely to an increase in the labor force participation of workers under the age of 25, particularly men. It turns out that the March increase in labor force participation of young men simply partially reversed a five-month slide, and their labor force participation remains far below its long-run trend. However, what happens with the labor force participation of young men in April will help clarify whether the March increase was a real step in the right direction or just a one-month fluke in a volatile series.
The figure below shows the number of missing young workers (men and women combined). There is a great deal of volatility month-to-month, so looking at the long-run trend is crucial. The number of missing workers under age 25 shot up to 1.6 million between early 2007 and early 2010, and then fluctuated around that level for a year-and-a-half, before declining to its current level of 950,000 (580,000 men and 370,000 women). I should note that this calculation takes into account long-run trends in labor force participation, such as lower labor force participation of young people due to increasing college enrollment over recent decades. (The methodology for calculating the number of missing workers is described here.) But it is also true that today’s missing young workers have not been able to “shelter in school” from the labor market effects of the Great Recession. Increases in college and university enrollment rates between 2007 and 2012 were no greater than the increases seen before the recession began—and since 2012, college enrollment rates have dropped substantially. This is discussed in more depth in my latest paper, on the class of 2014.
Missing workers* under age 25, January 2006–March 2014
| Missing workers | |
|---|---|
| Jan-2006 | 230,000 |
| Feb-2006 | -20,000 |
| Mar-2006 | 70,000 |
| Apr-2006 | 150,000 |
| May-2006 | 60,000 |
| Jun-2006 | 0 |
| Jul-2006 | 50,000 |
| Aug-2006 | -160,000 |
| Sep-2006 | 110,000 |
| Oct-2006 | -40,000 |
| Nov-2006 | -120,000 |
| Dec-2006 | -200,000 |
| Jan-2007 | -120,000 |
| Feb-2007 | 50,000 |
| Mar-2007 | 90,000 |
| Apr-2007 | 380,000 |
| May-2007 | 570,000 |
| Jun-2007 | 230,000 |
| Jul-2007 | 420,000 |
| Aug-2007 | 710,000 |
| Sep-2007 | 200,000 |
| Oct-2007 | 300,000 |
| Nov-2007 | 160,000 |
| Dec-2007 | 290,000 |
| Jan-2008 | 140,000 |
| Feb-2008 | 560,000 |
| Mar-2008 | 530,000 |
| Apr-2008 | 350,000 |
| May-2008 | -80,000 |
| Jun-2008 | 190,000 |
| Jul-2008 | 210,000 |
| Aug-2008 | 300,000 |
| Sep-2008 | 270,000 |
| Oct-2008 | 360,000 |
| Nov-2008 | 620,000 |
| Dec-2008 | 470,000 |
| Jan-2009 | 760,000 |
| Feb-2009 | 500,000 |
| Mar-2009 | 630,000 |
| Apr-2009 | 540,000 |
| May-2009 | 660,000 |
| Jun-2009 | 670,000 |
| Jul-2009 | 770,000 |
| Aug-2009 | 940,000 |
| Sep-2009 | 1,170,000 |
| Oct-2009 | 1,410,000 |
| Nov-2009 | 1,360,000 |
| Dec-2009 | 1,460,000 |
| Jan-2010 | 1,640,000 |
| Feb-2010 | 1,510,000 |
| Mar-2010 | 1,470,000 |
| Apr-2010 | 1,240,000 |
| May-2010 | 1,400,000 |
| Jun-2010 | 1,680,000 |
| Jul-2010 | 1,540,000 |
| Aug-2010 | 1,360,000 |
| Sep-2010 | 1,610,000 |
| Oct-2010 | 1,440,000 |
| Nov-2010 | 1,370,000 |
| Dec-2010 | 1,650,000 |
| Jan-2011 | 1,460,000 |
| Feb-2011 | 1,570,000 |
| Mar-2011 | 1,480,000 |
| Apr-2011 | 1,580,000 |
| May-2011 | 1,700,000 |
| Jun-2011 | 1,720,000 |
| Jul-2011 | 1,780,000 |
| Aug-2011 | 1,480,000 |
| Sep-2011 | 1,370,000 |
| Oct-2011 | 1,220,000 |
| Nov-2011 | 1,290,000 |
| Dec-2011 | 1,380,000 |
| Jan-2012 | 1,600,000 |
| Feb-2012 | 1,390,000 |
| Mar-2012 | 1,470,000 |
| Apr-2012 | 1,520,000 |
| May-2012 | 1,410,000 |
| Jun-2012 | 1,310,000 |
| Jul-2012 | 1,310,000 |
| Aug-2012 | 1,690,000 |
| Sep-2012 | 1,480,000 |
| Oct-2012 | 1,220,000 |
| Nov-2012 | 1,220,000 |
| Dec-2012 | 1,210,000 |
| Jan-2013 | 1,110,000 |
| Feb-2013 | 1,300,000 |
| Mar-2013 | 1,510,000 |
| Apr-2013 | 1,320,000 |
| May-2013 | 1,300,000 |
| Jun-2013 | 1,040,000 |
| Jul-2013 | 1,190,000 |
| Aug-2013 | 1,350,000 |
| Sep-2013 | 1,080,000 |
| Oct-2013 | 1,270,000 |
| Nov-2013 | 1,300,000 |
| Dec-2013 | 1,290,000 |
| Jan-2014 | 1,360,000 |
| Feb-2014 | 1,480,000 |
| Mar-2014 | 950,000 |

* Potential workers who, due to weak job opportunities, are neither employed nor actively seeking work, and are thus not reflected in the unemployment rate
Source: Authors' analysis of Toossi (2007) and Current Population Survey public data series
Paul Ryan Still Doesn’t Understand the Scale of the Poverty Problem
Earlier today, House Budget Committee Chair Paul Ryan (R-Wis.) continued his study of poverty with a hearing entitled, “A Progress Report on the War on Poverty: Lessons from the Frontlines.” Featuring witnesses from several poverty-fighting non-profits, Rep. Ryan styled the hearing as a “listening exercise” to hear about the strategies these charities and non-profits use to help alleviate poverty on the local level.
While it is admirable that Rep. Ryan gave a platform for community leaders to share their stories, he seems to have no sense of the scale of the problem before him. Indeed, Rep. Ryan’s veneration for the work of private charity is quite the contrast with his opinion of the federal government’s anti-poverty programs, which he has disparaged as “duplicative,” “complex,” and “ineffective.” However, for as much good work as it does, private philanthropy has well-known biases, as charitable donations tend to flow disproportionately to more glamorous causes, and often dry up during business cycle downturns—just when they’re needed most. In short, while individual charities and non-profits do incredible work to help our communities, they lack the ability to create widespread change; only the federal government has the resources to help alleviate poverty at the scale that is required.