What to Watch on Jobs Day: Will the Number of Missing Young Workers Decline Again?
There are currently nearly one million “missing workers” under the age of 25. (In total, there are 5.3 million missing workers, who are neither working nor actively seeking work due to the weak labor market.) In March, the total number of missing workers dropped substantially, due almost entirely to an increase in the labor force participation of workers under the age of 25, particularly men. It turns out that the March increase in labor force participation of young men simply partially reversed a five-month slide, and their labor force participation remains far below its long-run trend. However, what happens with the labor force participation of young men in April will help clarify whether the March increase was a real step in the right direction or just a one-month fluke in a volatile series.
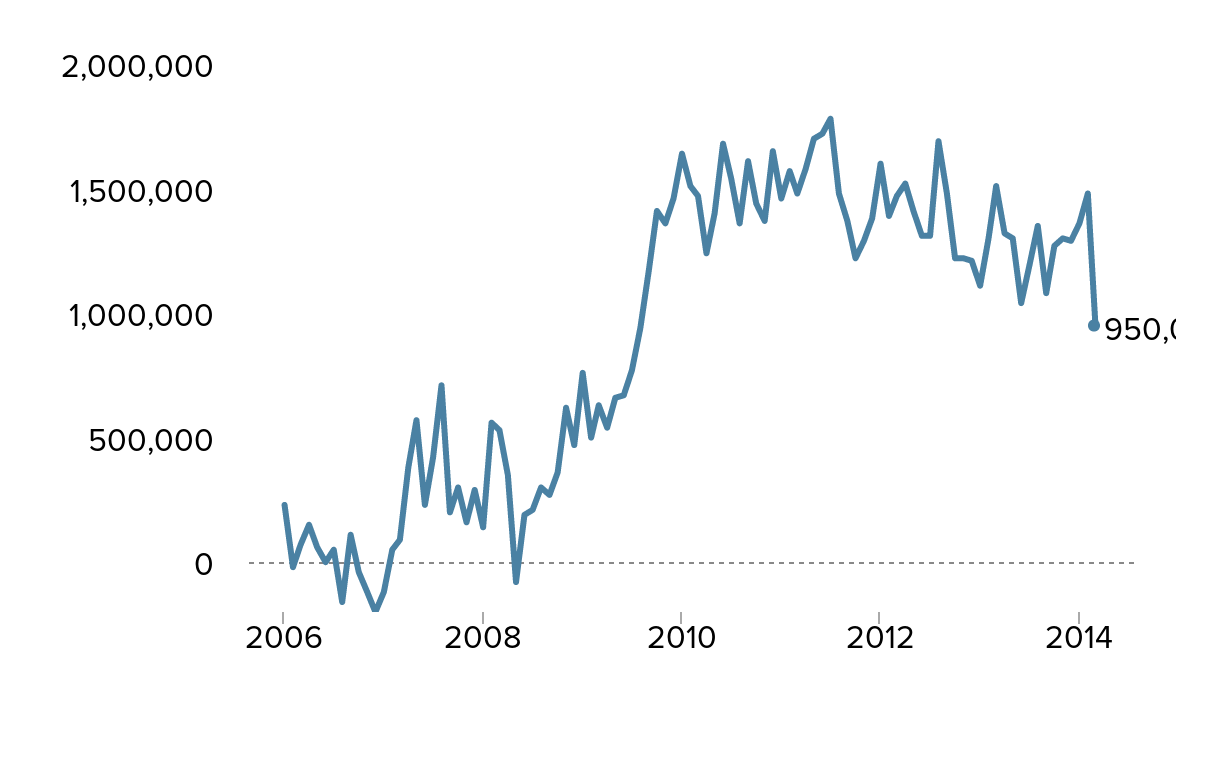
The figure below shows the number of missing young workers (men and women combined). There is a great deal of volatility month-to-month, so looking at the long-run trend is crucial. The number of missing workers under age 25 shot up to 1.6 million between early 2007 and early 2010, and then fluctuated around that level for a year-and-a-half, before declining to its current level of 950,000 (580,000 men and 370,000 women). I should note that this calculation takes into account long-run trends in labor force participation, such as lower labor force participation of young people due to increasing college enrollment over recent decades. (The methodology for calculating the number of missing workers is described here.) But it is also true that today’s missing young workers have not been able to “shelter in school” from the labor market effects of the Great Recession. Increases in college and university enrollment rates between 2007 and 2012 were no greater than the increases seen before the recession began—and since 2012, college enrollment rates have dropped substantially. This is discussed in more depth in my latest paper, on the class of 2014.
Missing workers* under age 25, January 2006–March 2014
| Missing workers | |
|---|---|
| Jan-2006 | 230,000 |
| Feb-2006 | -20,000 |
| Mar-2006 | 70,000 |
| Apr-2006 | 150,000 |
| May-2006 | 60,000 |
| Jun-2006 | 0 |
| Jul-2006 | 50,000 |
| Aug-2006 | -160,000 |
| Sep-2006 | 110,000 |
| Oct-2006 | -40,000 |
| Nov-2006 | -120,000 |
| Dec-2006 | -200,000 |
| Jan-2007 | -120,000 |
| Feb-2007 | 50,000 |
| Mar-2007 | 90,000 |
| Apr-2007 | 380,000 |
| May-2007 | 570,000 |
| Jun-2007 | 230,000 |
| Jul-2007 | 420,000 |
| Aug-2007 | 710,000 |
| Sep-2007 | 200,000 |
| Oct-2007 | 300,000 |
| Nov-2007 | 160,000 |
| Dec-2007 | 290,000 |
| Jan-2008 | 140,000 |
| Feb-2008 | 560,000 |
| Mar-2008 | 530,000 |
| Apr-2008 | 350,000 |
| May-2008 | -80,000 |
| Jun-2008 | 190,000 |
| Jul-2008 | 210,000 |
| Aug-2008 | 300,000 |
| Sep-2008 | 270,000 |
| Oct-2008 | 360,000 |
| Nov-2008 | 620,000 |
| Dec-2008 | 470,000 |
| Jan-2009 | 760,000 |
| Feb-2009 | 500,000 |
| Mar-2009 | 630,000 |
| Apr-2009 | 540,000 |
| May-2009 | 660,000 |
| Jun-2009 | 670,000 |
| Jul-2009 | 770,000 |
| Aug-2009 | 940,000 |
| Sep-2009 | 1,170,000 |
| Oct-2009 | 1,410,000 |
| Nov-2009 | 1,360,000 |
| Dec-2009 | 1,460,000 |
| Jan-2010 | 1,640,000 |
| Feb-2010 | 1,510,000 |
| Mar-2010 | 1,470,000 |
| Apr-2010 | 1,240,000 |
| May-2010 | 1,400,000 |
| Jun-2010 | 1,680,000 |
| Jul-2010 | 1,540,000 |
| Aug-2010 | 1,360,000 |
| Sep-2010 | 1,610,000 |
| Oct-2010 | 1,440,000 |
| Nov-2010 | 1,370,000 |
| Dec-2010 | 1,650,000 |
| Jan-2011 | 1,460,000 |
| Feb-2011 | 1,570,000 |
| Mar-2011 | 1,480,000 |
| Apr-2011 | 1,580,000 |
| May-2011 | 1,700,000 |
| Jun-2011 | 1,720,000 |
| Jul-2011 | 1,780,000 |
| Aug-2011 | 1,480,000 |
| Sep-2011 | 1,370,000 |
| Oct-2011 | 1,220,000 |
| Nov-2011 | 1,290,000 |
| Dec-2011 | 1,380,000 |
| Jan-2012 | 1,600,000 |
| Feb-2012 | 1,390,000 |
| Mar-2012 | 1,470,000 |
| Apr-2012 | 1,520,000 |
| May-2012 | 1,410,000 |
| Jun-2012 | 1,310,000 |
| Jul-2012 | 1,310,000 |
| Aug-2012 | 1,690,000 |
| Sep-2012 | 1,480,000 |
| Oct-2012 | 1,220,000 |
| Nov-2012 | 1,220,000 |
| Dec-2012 | 1,210,000 |
| Jan-2013 | 1,110,000 |
| Feb-2013 | 1,300,000 |
| Mar-2013 | 1,510,000 |
| Apr-2013 | 1,320,000 |
| May-2013 | 1,300,000 |
| Jun-2013 | 1,040,000 |
| Jul-2013 | 1,190,000 |
| Aug-2013 | 1,350,000 |
| Sep-2013 | 1,080,000 |
| Oct-2013 | 1,270,000 |
| Nov-2013 | 1,300,000 |
| Dec-2013 | 1,290,000 |
| Jan-2014 | 1,360,000 |
| Feb-2014 | 1,480,000 |
| Mar-2014 | 950,000 |

* Potential workers who, due to weak job opportunities, are neither employed nor actively seeking work, and are thus not reflected in the unemployment rate
Source: Authors' analysis of Toossi (2007) and Current Population Survey public data series
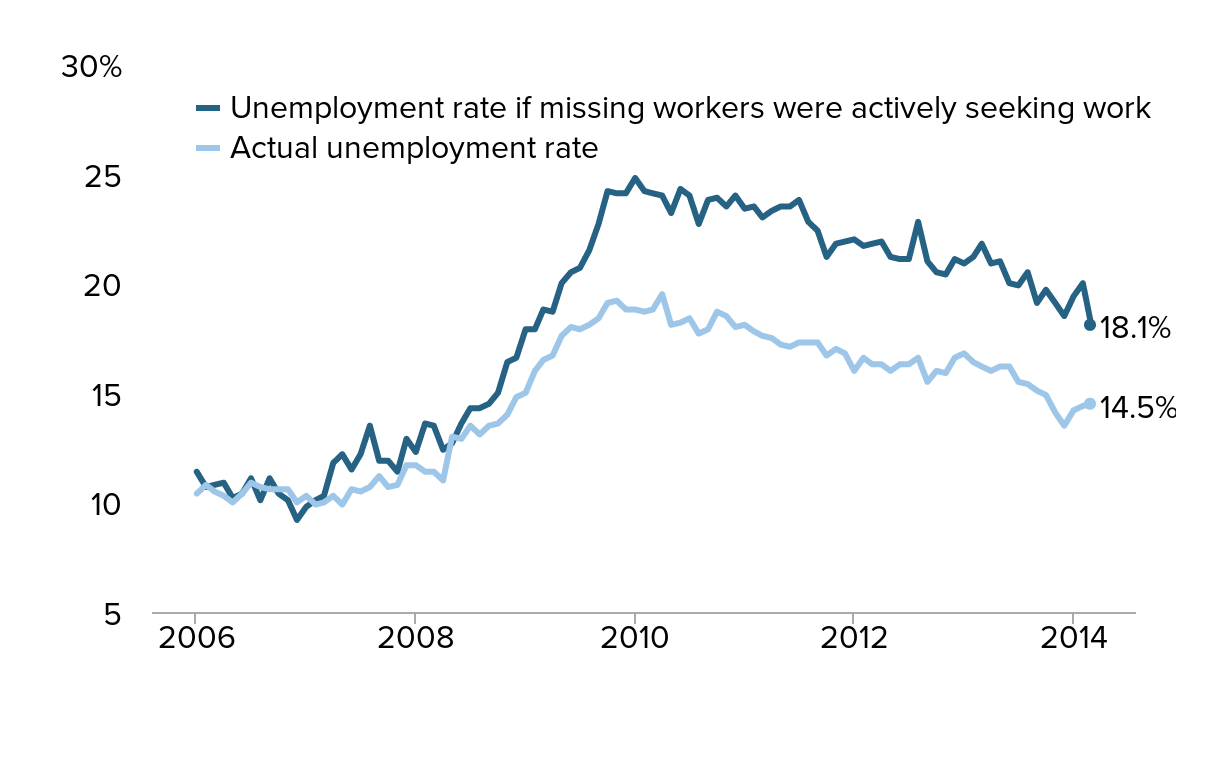
The next figure shows that the unemployment rate for young workers would be 18.1 percent instead of 14.5 percent if the missing young workers were in the labor force looking for work—and thus counted as unemployed. In other words, the unemployment rate in today’s recovery greatly understates how difficult it is for young workers to find a job. We will update both of these figures as soon as the jobs numbers are released tomorrow morning.
For a complete picture of the labor market prospects facing the new cohort of young adults graduating from high school and college this spring, see the Class of 2014 report released today.
Unemployment rate of workers under age 25, actual and if missing workers* were looking for work, January 2006–March 2014
| Actual unemployment rate | Unemployment rate if missing workers were actively seeking work | |
|---|---|---|
| Jan-2006 | 10.4% | 11.4% |
| Feb-2006 | 10.8% | 10.7% |
| Mar-2006 | 10.5% | 10.8% |
| Apr-2006 | 10.3% | 10.9% |
| May-2006 | 10.0% | 10.2% |
| Jun-2006 | 10.4% | 10.4% |
| Jul-2006 | 10.9% | 11.1% |
| Aug-2006 | 10.7% | 10.1% |
| Sep-2006 | 10.6% | 11.1% |
| Oct-2006 | 10.6% | 10.4% |
| Nov-2006 | 10.6% | 10.1% |
| Dec-2006 | 10.0% | 9.2% |
| Jan-2007 | 10.3% | 9.8% |
| Feb-2007 | 9.9% | 10.1% |
| Mar-2007 | 10.0% | 10.3% |
| Apr-2007 | 10.3% | 11.8% |
| May-2007 | 9.9% | 12.2% |
| Jun-2007 | 10.6% | 11.5% |
| Jul-2007 | 10.5% | 12.2% |
| Aug-2007 | 10.7% | 13.5% |
| Sep-2007 | 11.2% | 11.9% |
| Oct-2007 | 10.7% | 11.9% |
| Nov-2007 | 10.8% | 11.4% |
| Dec-2007 | 11.7% | 12.9% |
| Jan-2008 | 11.7% | 12.3% |
| Feb-2008 | 11.4% | 13.6% |
| Mar-2008 | 11.4% | 13.5% |
| Apr-2008 | 11.0% | 12.4% |
| May-2008 | 13.0% | 12.7% |
| Jun-2008 | 12.9% | 13.6% |
| Jul-2008 | 13.5% | 14.3% |
| Aug-2008 | 13.1% | 14.3% |
| Sep-2008 | 13.5% | 14.5% |
| Oct-2008 | 13.6% | 15.0% |
| Nov-2008 | 14.0% | 16.4% |
| Dec-2008 | 14.8% | 16.6% |
| Jan-2009 | 15.0% | 17.9% |
| Feb-2009 | 16.0% | 17.9% |
| Mar-2009 | 16.5% | 18.8% |
| Apr-2009 | 16.7% | 18.7% |
| May-2009 | 17.6% | 20.0% |
| Jun-2009 | 18.0% | 20.5% |
| Jul-2009 | 17.9% | 20.7% |
| Aug-2009 | 18.1% | 21.5% |
| Sep-2009 | 18.4% | 22.7% |
| Oct-2009 | 19.1% | 24.2% |
| Nov-2009 | 19.2% | 24.1% |
| Dec-2009 | 18.8% | 24.1% |
| Jan-2010 | 18.8% | 24.8% |
| Feb-2010 | 18.7% | 24.2% |
| Mar-2010 | 18.8% | 24.1% |
| Apr-2010 | 19.5% | 24.0% |
| May-2010 | 18.1% | 23.2% |
| Jun-2010 | 18.2% | 24.3% |
| Jul-2010 | 18.4% | 24.0% |
| Aug-2010 | 17.7% | 22.7% |
| Sep-2010 | 17.9% | 23.8% |
| Oct-2010 | 18.7% | 23.9% |
| Nov-2010 | 18.5% | 23.5% |
| Dec-2010 | 18.0% | 24.0% |
| Jan-2011 | 18.1% | 23.4% |
| Feb-2011 | 17.8% | 23.5% |
| Mar-2011 | 17.6% | 23.0% |
| Apr-2011 | 17.5% | 23.3% |
| May-2011 | 17.2% | 23.5% |
| Jun-2011 | 17.1% | 23.5% |
| Jul-2011 | 17.3% | 23.8% |
| Aug-2011 | 17.3% | 22.8% |
| Sep-2011 | 17.3% | 22.4% |
| Oct-2011 | 16.7% | 21.2% |
| Nov-2011 | 17.0% | 21.8% |
| Dec-2011 | 16.8% | 21.9% |
| Jan-2012 | 16.0% | 22.0% |
| Feb-2012 | 16.6% | 21.7% |
| Mar-2012 | 16.3% | 21.8% |
| Apr-2012 | 16.3% | 21.9% |
| May-2012 | 16.0% | 21.2% |
| Jun-2012 | 16.3% | 21.1% |
| Jul-2012 | 16.3% | 21.1% |
| Aug-2012 | 16.6% | 22.8% |
| Sep-2012 | 15.5% | 21.0% |
| Oct-2012 | 16.0% | 20.5% |
| Nov-2012 | 15.9% | 20.4% |
| Dec-2012 | 16.6% | 21.1% |
| Jan-2013 | 16.8% | 20.9% |
| Feb-2013 | 16.4% | 21.2% |
| Mar-2013 | 16.2% | 21.8% |
| Apr-2013 | 16.0% | 20.9% |
| May-2013 | 16.2% | 21.0% |
| Jun-2013 | 16.2% | 20.0% |
| Jul-2013 | 15.5% | 19.9% |
| Aug-2013 | 15.4% | 20.5% |
| Sep-2013 | 15.1% | 19.1% |
| Oct-2013 | 14.9% | 19.7% |
| Nov-2013 | 14.1% | 19.1% |
| Dec-2013 | 13.5% | 18.5% |
| Jan-2014 | 14.2% | 19.4% |
| Feb-2014 | 14.4% | 20.0% |
| Mar-2014 | 14.5% | 18.1% |

* Potential workers who, due to weak job opportunities, are neither employed nor actively seeking work, and are thus not reflected in the unemployment rate
Source: Authors' analysis of Toossi (2007) and Current Population Survey public data series
Enjoyed this post?
Sign up for EPI's newsletter so you never miss our research and insights on ways to make the economy work better for everyone.
