Slow Job Growth Should Give Us Pause
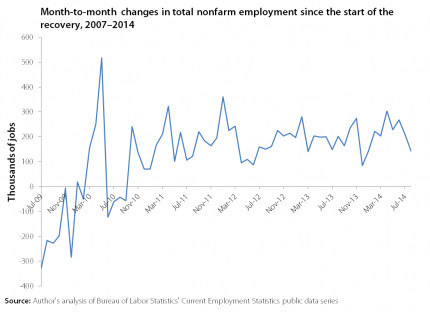
Today’s jobs report showed the economy added 142,000 jobs in August, far below expectations of job growth closer to 230,000. Prior to August, monthly job growth averaged 226,000 this year. The figure below charts monthly job growth since the start of the recovery in July 2009. While the general trend has gone up, this month’s job growth was disappointingly below trend. We haven’t seen job growth this slow since December of last year.
While it’s yet to be seen whether this slower job growth is an anomaly or a new trend, these numbers should give us pause. Adding in this month’s disappointing numbers, job growth this year is still above last year’s average at this time. Job growth has averaged 215,000 jobs a month thus far in 2014, compared to 197,000 in the first eight months of 2013. We need to be consistently adding jobs at a much faster rate to return to the labor market conditions before the recession began. Arguably, that standard is a low bar as the labor market at that time still had considerable slack.
Wages Are Growing Far Below the Fed’s Target
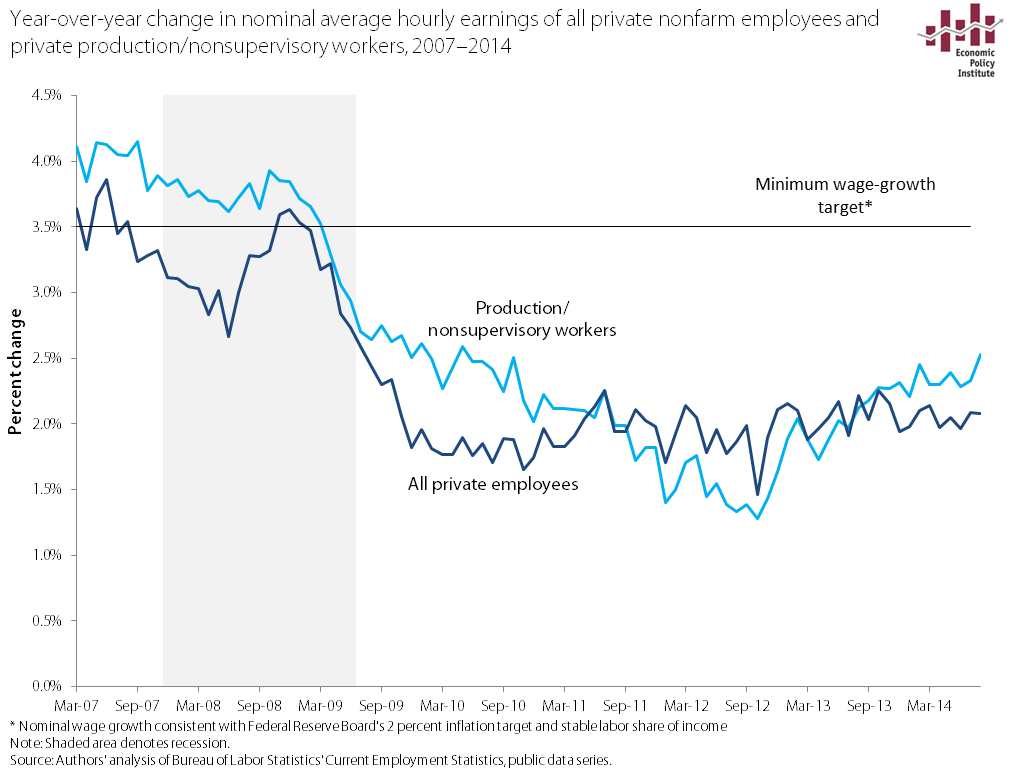
Despite fears from some inflation hawks, the fact is that the weak labor market of the last seven years has put enormous downward pressure on wages, and there has been no significant pickup in nominal wage growth in recent years. As shown in the figure below, wage growth is far below the 3.5 percent rate consistent with the Federal Reserve Board’s inflation target of 2 percent. It’s clear that Fed policymakers should abandon notions of slowing the economy. (For a longer analysis of what to watch for in upcoming months on wage growth, see this explainer.)
What is more than obvious is that employers just don’t have to offer big wage increases to get and keep the workers they need, when hiring rates and net job creation remain far slower than what’s needed to generate healthy labor market outcomes. The result is that over the last year slow nominal wage growth, and inflation-adjusted wage stagnation (or even outright declines), have continued.
What to Watch on Jobs Day: It’s No Longer a Jobless Recovery but It’s Undoubtedly a Wage-Growth-Less Recovery
The pace of job growth in the U.S. economy has increased in 2014 relative to the preceding years, and consensus forecasts suggest that this more rapid trend will continue. Job growth has averaged 230,000 a month thus far in 2014, as compared to 196,000 and 183,000, respectively, in the first seven months of 2013 and 2012. Unfortunately, at that rate it will still take over three years to return to pre-recession labor market conditions, but clearly it is a move in the right direction.
Wage growth, on the other hand, has been uniformly dismal essentially throughout the recovery from the Great Recession. A report we released last week showed that real (inflation adjusted) wages in the first half of 2014 were down over the year across nearly all parts of the wage distribution and across all education levels. One measure we’ll be looking at more closely tomorrow—in large part because it bears so heavily on Federal Reserve policy in coming months—is the pace of nominal wage growth.
Despite fears from some inflation hawks, the fact is that the weak labor market of the last seven years has put enormous downward pressure on wages, and there has been no significant pickup in nominal wage growth in recent years. Employers just don’t have to offer big wage increases to get and keep the workers they need, when hiring rates and net job creation remain far slower than what’s needed to generate healthy labor market outcomes. The result is that over the last year slow nominal wage growth, and inflation-adjusted wage stagnation (or even outright declines), have continued. In the figure below, we show nominal average hourly earnings for both all private workers and for private production/nonsupervisory workers from 2007 to 2014. It’s clear that nominal wage growth has been flat for a long time, and there’s little evidence this flatness has changed in recent months.
The United States Leads in Low-Wage Work and the Lowest Wages for Low-Wage Workers
Fast-food workers across the country are on strike today, as a way of demanding higher wages and calling attention to the extremely low wages of low-wage workers. As Elise Gould shows in her recent paper, Why America’s Workers Need Faster Wage Growth—And What We Can Do About It, the wages of low-wage workers (the 10th percentile of wage earners) declined by five percent over the 1979-2013 period, despite a generation of productivity gains (64.9 percent).
Low-wage workers in the United States also fare very poorly by international standards, as the OECD’s recent Employment Outlook report reminds us. In the United States, according to the OECD, 25.3 percent of workers had “low-pay”—earning less than two-thirds of the median wage—which was the highest incidence of low-pay work among the twenty-six countries surveyed and far higher than the OECD average of 16.3 percent. In fact, as the figure below shows, low-wage workers fare worse in the United States than any other OECD nation. Low-wage workers earned just 46.7 percent of that of the median worker—far beneath the OECD average of 59.9 percent in 2012. To catch up to the OECD average, U.S. low wage workers would need a 28 percent wage boost.

Labor Day Hope
The last several decades have been hard on working men and women in the United States. The decline of unions (which now represent just a little more than one sixteenth of private sector workers), job loss to Mexico, China, and other low wage countries, and a series of bad court decisions weakening the rights to effectively bargain a contract have left working Americans nearly defenseless, as wages stagnate or fall and traditional pension coverage disappears. The results are ugly: since 2000, 70 percent of Americans have seen no gain in wages, and wages have fallen for the bottom 40 percent. Traditional pensions are disappearing, to the point that less than 18 percent of workers still have this crucial benefit.
Despite that grim background, there is cause for hope, and three events this past week brought a big smile to my face and lifted my spirits. The biggest lift came from two court decisions in California and Oregon (I’m a lawyer, I can’t help it!), where a U.S. Court of Appeals struck down one of corporate America’s longest-running and most outrageous schemes to cheat workers and scam the government. FedEx, a giant in package delivery industry, has avoided payroll taxes, prevented union organizing, and escaped the laws that give workers meal breaks, overtime pay, sick leave, and family leave by entering into sham contracts with its 27,000 drivers in which it declares them to be independent contractors. Employees have employment rights, but independent contractors don’t.
An employer has to pay Social Security and Medicare taxes for employees, as well as unemployment insurance taxes and worker’s compensation premiums—but not for independent contractors. So FedEx, while maintaining control over the minutest aspects of their working lives, called its drivers contractors—shifting all of the costs and risks off of FedEx and onto its employees. As described by Judge William Fletcher, FedEx “contracts with drivers to deliver packages to its customers. The drivers must wear FedEx uniforms, drive FedEx-approved vehicles, and groom themselves according to FedEx’s appearance standards. FedEx tells its drivers what packages to deliver, on what days, and at what times. Although drivers may operate multiple delivery routes and hire third parties to help perform work on those routes, they may do so only with FedEx’s consent.”
Why Young People Should Care About a Lame Labor Market
I am not as optimistic about my future as my peers tell pollsters they are. Relative to the two previous generations, Millennials have higher levels of student debt, poverty, and unemployment, and lower levels of personal income and wealth. All of this has been covered in depth by the media, but what doesn’t get nearly enough attention given its importance is how poorly the American labor market is performing for my generation.
At EPI, we talk a lot about how weak labor markets hurts workers and their families (something that even The Onion has picked up on). Heidi Shierholz has documented the impact that labor market policies have on workers in various sectors, like domestic workers, and Josh Bivens and I wrote a paper showing how the weak labor market is the main challenge for middle class families in the aftermath of the Great Recession. But it can be hard to understand how the labor market relates to readers my age. With this post, I’m going to try to make the case for why young people should care about what’s going on in the labor market, and why it makes sense for them work to make it better.
A weak labor market hurts the living standards of young people in two immediate ways. First, it disproportionately affects young people’s job opportunities. This is true in good and bad times: unemployment for younger workers is almost always about twice the overall unemployment rate. As of July 2014, the unemployment rate for young workers was 13.6 percent, while unemployment for workers ages 25-54 was 5.2 percent (relative to 10.5 percent and 3.7 percent in 2007, the last time we experienced a “strong” labor market). One of the reasons for this is obvious: young people are inexperienced relative to their older counterparts. In a time of labor market weakness, older, more experienced workers who are newly unemployed will apply to jobs they may be overqualified for, leaving young people to compete with not just their peers but also a larger pool of more experienced candidates. So even while the Great Recession officially ended in 2009, young people are currently facing one extremely competitive labor market.
The Dog That Didn’t Bark, or, Why Wages at the Bottom of the Distribution Were the Only Ones That Didn’t Fall over the past Year
In writing my paper on the most recent wage trends released today, I came across an interesting finding: Wages at the bottom of the wage distribution were the only ones that didn’t fall between the first half of 2013 and first half of 2014. The figure below shows the change in real (inflation-adjusted) wages over this time at different points in the wage distribution. What is obvious from the figure is that wages have fallen for nearly every group. If I showed you the same trends by education, as I do in the paper (see Figure O), you’d see an even starker story: Wages over the past year have fallen for all education groups, including those with college or advanced degrees.
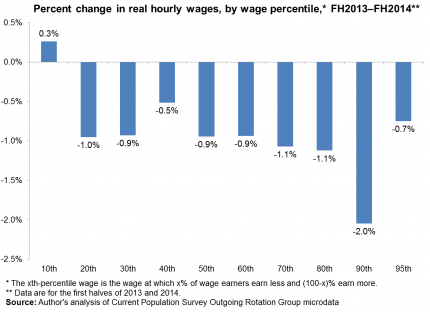
So, why didn’t the 10th percentile wage fall like all others? What is so special about that wage that sits below 90 percent and above 10 percent of workers (i.e., is not generally earned by particularly privileged workers)? Simple—several states raised their minimum wage over that period.
Wages Have Fallen for Most Americans in 2014
Today, we released a report analyzing the most recent reliable data on wages by decile and by educational attainment. These data are illuminating because they look beneath the overall averages presented in the regular statistical series covered by the media. On the one hand, these recent data look quite a bit like the couple of years of data that come before it—but that is still very revealing of what’s going in the economy.
Overall, the trends over the last year—from the first half of 2013 to the first half of 2014—show that real, inflation-adjusted wages fell up and down the entire wage scale, with one revealing notable exception. The recovery has not been completely jobless for a while now, but it does continue to be pretty much wage-less, or at least wage-growth-less.
Let’s start at the top of the wage distribution: those workers with the most education and the highest wages. Over the last year, real wages at the top of the wage distribution fell, by 2.0 percent at the 90th percentile and 0.7 percent at the 95th percentile. Real wages also fell for workers with a 4-year college degree, and even for those workers with an advanced degree. This is important in particular because it sends a clear message to the Federal Reserve Board. If even these groups of highly educated workers facing the lowest unemployment are seeing outright wage declines, there is clearly lots of slack left in the American labor market, and policymakers—particularly the Federal Reserve—should not try to slow the recovery down in an effort to keep wage and price inflation in check: they’re both already firmly in check even for the most privileged workers.
Job Growth in the Great Recession Has Not Been Equal Between Men and Women
While many strides have been made in the women’s equality movement, job growth among women and men in the aftermath of the Great Recession is not one. The solid lines in the figure below show job loss during and after the Great Recession by gender. Men lost far more jobs than women did in the Great Recession—over 6.0 million jobs, or 8.5 percent of their total December 2007 employment, compared to women who lost 2.7 million jobs, or 3.5 percent. Since the economy started regaining jobs, however, the gender dynamic in job growth has reversed—between February 2010 and the June 2014, men gained 5.5 million while women gained 3.6 million jobs.
How did men both lose and then gain more jobs than women? A lot can be explained by the industries men and women were in at the time of the Great Recession—men were in industries that would sustain the most dramatic job loss while women were concentrated in industries with less job loss. The industries with the largest overall job losses—manufacturing and construction—also employed a very large share of men. Meanwhile, the industries that employed the greatest shares of women in 2007—health care and state and local government—were not as hard-hit. However, men have gained more jobs than women because they’ve had stronger job growth within almost every industry. Women experienced a smaller share of net gains between 2007 and 2014 in 10 out of the 16 major industries: manufacturing, whole sale trade, retail trade, professional and business and health care to name a few. (To see how men and women fared in each of the 16 major industries, see my blog post in which I update the distribution of workers across industry by gender during and after the Great Recession.)
A Brief but Sad History of Selected Corporate Inversions
Earlier this week, we were greeted with the news that Burger King, a U.S. fast-food giant, is in talks to merge with Tim Hortons, a much smaller Canadian fast-food chain, and become a Canadian firm. This proposed deal is interesting on many levels. First, it is another example of a corporate inversion in which, to use Edward Kleinbard’s description, a “foreign minnow swallows a domestic whale.”
Second and more importantly, this is a corporate inversion involving a large U.S. corporation and a much smaller foreign corporation that was once a U.S. corporation. Yes, you read that correctly: Tim Hortons was a U.S. corporation prior to its inversion to Canada in 2009. Though to be fair, Tim Hortons started as a Canadian company—it was founded in Hamilton, Ontario in 1964. Wendy’s restaurant chain purchased Tim Hortons in 1995 and then spun-off the company in 2006. Tim Hortons inverted to Canada in 2009 arguing that they had substantial business activity in Canada.