The Ridiculousness of a “Liberal Endgame” on Fiscal Policy
Last night, the American Enterprise Institute’s Jim Pethokoukis, with whom I occasionally agree on matters of fiscal policy, took to Twitter to “clarify” the fiscal implications of many progressive priorities.
Basically, Pethokoukis is arguing that federal spending levels as high as some (slightly-caricatured version of) progressives have called for would require a broad-based tax hike on all Americans.
There’s plenty to dislike about this claim, but the most important issue is that no progressives I know are arguing for a specific federal spending level for all occasions. Instead, we want federal spending levels that are consistent with our policy priorities. So, for example, in times of weak aggregate demand, spending should temporarily rise to finance safety net programs, aid to state and local governments, and public investments to put people back to work. When the economy gets going again and we are near full employment, federal spending should then pull back. Over the longer run, spending levels should be sufficient to preserve the social insurance programs we have (which are not particularly generous), as well as finance needed public investments, vital safety net programs, and the efficient running of government. (So no phony savings like slashing the budget of the IRS.)
The liberal end game is 30% of GDP spending, financed by a VAT and other taxes.
— James Pethokoukis (@JimPethokoukis) October 6, 2014
Labor Market Weakness Is Still not due to Workers Lacking the Right Skills
The figure below shows the number of unemployed workers and the number of job openings by industry. This figure is useful for diagnosing what’s behind our sustained high unemployment. If our current elevated unemployment were due to skills shortages or mismatches, we would expect to find some sectors where there are more unemployed workers than job openings, and some where there are more job openings than unemployed workers. What we find, however, is that unemployed workers dramatically outnumber job openings across the board. There are between 1.1 and 6.5 times as many unemployed workers as job openings in every industry. In other words, even in the industry with the most favorable ratio of unemployed workers to job openings (health care and social assistance), there are still about 10 percent more unemployed workers than job openings. This demonstrates that the main problem in the labor market is a broad-based lack of demand for workers—not, as is often claimed, available workers lacking the skills needed for the sectors with job openings.
Unemployed and job openings, by industry (in millions)
| Industry | Unemployed | Job openings |
|---|---|---|
| Professional and business services | 1.151667 | 0.792083 |
| Health care and social assistance | 0.719667 | 0.665667 |
| Retail trade | 1.179833 | 0.473667 |
| Accommodation and food services | 0.975167 | 0.544 |
| Government | 0.734333 | 0.421333 |
| Finance and insurance | 0.27225 | 0.216333 |
| Durable goods manufacturing | 0.518667 | 0.174417 |
| Other services | 0.40575 | 0.143417 |
| Wholesale trade | 0.171167 | 0.145917 |
| Transportation, warehousing, and utilities | 0.38375 | 0.157833 |
| Information | 0.163667 | 0.103083 |
| Construction | 0.815333 | 0.126167 |
| Nondurable goods manufacturing | 0.343667 | 0.10575 |
| Educational services | 0.23275 | 0.073333 |
| Real estate and rental and leasing | 0.126 | 0.052 |
| Arts, entertainment, and recreation | 0.226167 | 0.074583 |
| Mining and logging | 0.05425 | 0.026833 |

Note: Because the data are not seasonally adjusted, these are 12-month averages, September 2013–August 2014.
Source: EPI analysis of data from the Job Openings and Labor Turnover Survey and the Current Population Survey
Job Seekers Outnumber Jobs by 2-to-1
In August, the total number of job openings was 4.8 million, up from a revised 4.6 million in July. In August, there were 9.6 million job seekers (unemployment data are from the Current Population Survey), meaning that there were 2.0 times as many job seekers as job openings. Put another way, job seekers so outnumbered job openings that about half of the unemployed were not going to find a job in August no matter what they did. In a labor market with strong job opportunities, there would be roughly as many job openings as job seekers.
The decline of the job seekers to job openings ratio to 2.0 continues the overall downward trend since the high of 6.8 to 1 in July 2009 (see Figure A). The ratio has steadily declined, falling by about 1.0 over the last year.
While this is clearly a move in the right direction, the 9.6 million unemployed workers understate how many job openings will be needed when a robust jobs recovery finally begins, due to the existence of 5.9 million would-be workers (in August) who are currently not in the labor market, but who would be if job opportunities were strong. Many of these “missing workers” will become job seekers when we enter a robust jobs recovery, so job openings will be needed for them, too.
The job-seekers ratio, December 2000–August 2014
| Month | Unemployed job seekers per job opening |
|---|---|
| Dec-2000 | 1.1 |
| Jan-2001 | 1.1 |
| Feb-2001 | 1.3 |
| Mar-2001 | 1.3 |
| Apr-2001 | 1.3 |
| May-2001 | 1.4 |
| Jun-2001 | 1.5 |
| Jul-2001 | 1.5 |
| Aug-2001 | 1.7 |
| Sep-2001 | 1.8 |
| Oct-2001 | 2.1 |
| Nov-2001 | 2.3 |
| Dec-2001 | 2.3 |
| Jan-2002 | 2.3 |
| Feb-2002 | 2.4 |
| Mar-2002 | 2.3 |
| Apr-2002 | 2.6 |
| May-2002 | 2.4 |
| Jun-2002 | 2.5 |
| Jul-2002 | 2.5 |
| Aug-2002 | 2.4 |
| Sep-2002 | 2.5 |
| Oct-2002 | 2.4 |
| Nov-2002 | 2.4 |
| Dec-2002 | 2.8 |
| Jan-2003 | 2.3 |
| Feb-2003 | 2.5 |
| Mar-2003 | 2.8 |
| Apr-2003 | 2.8 |
| May-2003 | 2.8 |
| Jun-2003 | 2.8 |
| Jul-2003 | 2.8 |
| Aug-2003 | 2.7 |
| Sep-2003 | 2.9 |
| Oct-2003 | 2.7 |
| Nov-2003 | 2.6 |
| Dec-2003 | 2.5 |
| Jan-2004 | 2.5 |
| Feb-2004 | 2.4 |
| Mar-2004 | 2.5 |
| Apr-2004 | 2.4 |
| May-2004 | 2.2 |
| Jun-2004 | 2.4 |
| Jul-2004 | 2.1 |
| Aug-2004 | 2.2 |
| Sep-2004 | 2.1 |
| Oct-2004 | 2.1 |
| Nov-2004 | 2.3 |
| Dec-2004 | 2.1 |
| Jan-2005 | 2.2 |
| Feb-2005 | 2.1 |
| Mar-2005 | 2.0 |
| Apr-2005 | 1.9 |
| May-2005 | 2.0 |
| Jun-2005 | 1.9 |
| Jul-2005 | 1.8 |
| Aug-2005 | 1.8 |
| Sep-2005 | 1.8 |
| Oct-2005 | 1.8 |
| Nov-2005 | 1.7 |
| Dec-2005 | 1.7 |
| Jan-2006 | 1.7 |
| Feb-2006 | 1.7 |
| Mar-2006 | 1.6 |
| Apr-2006 | 1.6 |
| May-2006 | 1.6 |
| Jun-2006 | 1.6 |
| Jul-2006 | 1.8 |
| Aug-2006 | 1.6 |
| Sep-2006 | 1.5 |
| Oct-2006 | 1.5 |
| Nov-2006 | 1.5 |
| Dec-2006 | 1.5 |
| Jan-2007 | 1.6 |
| Feb-2007 | 1.5 |
| Mar-2007 | 1.4 |
| Apr-2007 | 1.5 |
| May-2007 | 1.5 |
| Jun-2007 | 1.5 |
| Jul-2007 | 1.6 |
| Aug-2007 | 1.6 |
| Sep-2007 | 1.6 |
| Oct-2007 | 1.7 |
| Nov-2007 | 1.7 |
| Dec-2007 | 1.8 |
| Jan-2008 | 1.8 |
| Feb-2008 | 1.9 |
| Mar-2008 | 1.9 |
| Apr-2008 | 2.0 |
| May-2008 | 2.1 |
| Jun-2008 | 2.3 |
| Jul-2008 | 2.4 |
| Aug-2008 | 2.6 |
| Sep-2008 | 3.0 |
| Oct-2008 | 3.1 |
| Nov-2008 | 3.4 |
| Dec-2008 | 3.7 |
| Jan-2009 | 4.4 |
| Feb-2009 | 4.6 |
| Mar-2009 | 5.4 |
| Apr-2009 | 6.1 |
| May-2009 | 6.0 |
| Jun-2009 | 6.2 |
| Jul-2009 | 6.8 |
| Aug-2009 | 6.5 |
| Sep-2009 | 6.2 |
| Oct-2009 | 6.5 |
| Nov-2009 | 6.3 |
| Dec-2009 | 6.1 |
| Jan-2010 | 5.5 |
| Feb-2010 | 6.0 |
| Mar-2010 | 5.8 |
| Apr-2010 | 5.0 |
| May-2010 | 5.1 |
| Jun-2010 | 5.3 |
| Jul-2010 | 5.0 |
| Aug-2010 | 5.0 |
| Sep-2010 | 5.2 |
| Oct-2010 | 4.8 |
| Nov-2010 | 4.9 |
| Dec-2010 | 5.0 |
| Jan-2011 | 4.8 |
| Feb-2011 | 4.6 |
| Mar-2011 | 4.4 |
| Apr-2011 | 4.5 |
| May-2011 | 4.5 |
| Jun-2011 | 4.3 |
| Jul-2011 | 4.0 |
| Aug-2011 | 4.3 |
| Sep-2011 | 3.9 |
| Oct-2011 | 4.0 |
| Nov-2011 | 4.2 |
| Dec-2011 | 3.7 |
| Jan-2012 | 3.5 |
| Feb-2012 | 3.7 |
| Mar-2012 | 3.3 |
| Apr-2012 | 3.5 |
| May-2012 | 3.4 |
| Jun-2012 | 3.3 |
| Jul-2012 | 3.5 |
| Aug-2012 | 3.4 |
| Sep-2012 | 3.4 |
| Oct-2012 | 3.2 |
| Nov-2012 | 3.2 |
| Dec-2012 | 3.4 |
| Jan-2013 | 3.3 |
| Feb-2013 | 3.0 |
| Mar-2013 | 3.0 |
| Apr-2013 | 3.1 |
| May-2013 | 3.0 |
| Jun-2013 | 3.0 |
| Jul-2013 | 3.0 |
| Aug-2013 | 2.9 |
| Sep-2013 | 2.8 |
| Oct-2013 | 2.8 |
| Nov-2013 | 2.6 |
| Dec-2013 | 2.6 |
| Jan-2014 | 2.6 |
| Feb-2014 | 2.5 |
| Mar-2014 | 2.5 |
| Apr-2014 | 2.2 |
| May-2014 | 2.1 |
| Jun-2014 | 2.0 |
| Jul-2014 | 2.1 |
| Aug-2014 | 2.0 |
Note: Shaded areas denote recessions.
Source: EPI analysis of Bureau of Labor Statistics Job Openings and Labor Turnover Survey and Current Population Survey
Even further, a job opening when the labor market is weak often does not mean the same thing as a job opening when the labor market is strong. There is a wide range of “recruitment intensity” with which a company can deal with a job opening. For example, if a company is trying hard to fill an opening, it may increase the compensation package and/or scale back the required qualifications. Conversely, if it is not trying very hard, it may hike up the required qualifications and/or offer a meager compensation package. Perhaps unsurprisingly, research shows that recruitment intensity is cyclical; it tends to be stronger when the labor market is strong, and weaker when the labor market is weak. This means that when a job opening goes unfilled when the labor market is weak, as it is today, companies may very well be holding out for an overly qualified candidate at a cheap price.
Job Openings Are Up, but the Hires Rate Is Down
The August Job Openings and Labor Turnover Survey (JOLTS) data release this morning from the Bureau of Labor Statistics showed mixed results. While the job openings rose, the hires rate fell. Layoffs continue to trend downwards, while the quits rate remained flat—it’s been flat now since February.
The figure below shows the hires rate, the quits rate, and the layoffs rate. The first thing to note is that layoffs, which shot up during the recession, recovered quickly once the recession officially ended. Layoffs have been at prerecession levels for more than three years. This makes sense—the economy is in a recovery and businesses are no longer shedding workers at an elevated rate. And the continued trend downward in August is a good sign.
But for a full recovery in the labor market to occur, two key things need to happen: Layoffs need to come down, and hiring needs to pick up. Hiring is the side of that equation that, while generally improving, has not yet come close to a full recovery. The hires rate remains well below its prerecession level.
Another piece of the puzzle is voluntary quits (shown by the quits rate in the figure below). A larger number of people voluntarily quitting their job indicates a labor market in which hiring is prevalent and workers are able to leave jobs that are not right for them, and find new ones. The voluntary quits rate, which has been flat for the last seven months, is also nowhere near a full recovery. There are 14 percent percent fewer voluntary quits each month than there were before the recession began, and the quits rate is the same as it was last October. Low voluntary quits indicate that there are a large number of workers who are locked into jobs who would leave if they could.
Hires, quits, and layoff rates, December 2000–August 2014
| Month | Hires rate | Layoffs rate | Quits rate |
|---|---|---|---|
| Dec-2000 | 4.1% | 1.4% | 2.3% |
| Jan-2001 | 4.4% | 1.6% | 2.6% |
| Feb-2001 | 4.1% | 1.4% | 2.5% |
| Mar-2001 | 4.2% | 1.6% | 2.4% |
| Apr-2001 | 4.0% | 1.5% | 2.4% |
| May-2001 | 4.0% | 1.5% | 2.4% |
| Jun-2001 | 3.8% | 1.5% | 2.3% |
| Jul-2001 | 3.9% | 1.5% | 2.2% |
| Aug-2001 | 3.8% | 1.4% | 2.1% |
| Sep-2001 | 3.8% | 1.6% | 2.1% |
| Oct-2001 | 3.8% | 1.7% | 2.2% |
| Nov-2001 | 3.7% | 1.6% | 2.0% |
| Dec-2001 | 3.7% | 1.4% | 2.0% |
| Jan-2002 | 3.7% | 1.4% | 2.2% |
| Feb-2002 | 3.7% | 1.5% | 2.0% |
| Mar-2002 | 3.5% | 1.4% | 1.9% |
| Apr-2002 | 3.8% | 1.5% | 2.1% |
| May-2002 | 3.8% | 1.5% | 2.1% |
| Jun-2002 | 3.7% | 1.4% | 2.0% |
| Jul-2002 | 3.8% | 1.5% | 2.1% |
| Aug-2002 | 3.7% | 1.4% | 2.0% |
| Sep-2002 | 3.7% | 1.4% | 2.0% |
| Oct-2002 | 3.7% | 1.4% | 2.0% |
| Nov-2002 | 3.8% | 1.5% | 1.9% |
| Dec-2002 | 3.8% | 1.5% | 2.0% |
| Jan-2003 | 3.8% | 1.5% | 1.9% |
| Feb-2003 | 3.6% | 1.5% | 1.9% |
| Mar-2003 | 3.4% | 1.4% | 1.9% |
| Apr-2003 | 3.6% | 1.6% | 1.8% |
| May-2003 | 3.5% | 1.5% | 1.8% |
| Jun-2003 | 3.7% | 1.6% | 1.8% |
| Jul-2003 | 3.6% | 1.6% | 1.8% |
| Aug-2003 | 3.6% | 1.5% | 1.8% |
| Sep-2003 | 3.7% | 1.5% | 1.9% |
| Oct-2003 | 3.8% | 1.4% | 1.9% |
| Nov-2003 | 3.6% | 1.4% | 1.9% |
| Dec-2003 | 3.8% | 1.5% | 1.9% |
| Jan-2004 | 3.7% | 1.5% | 1.9% |
| Feb-2004 | 3.6% | 1.4% | 1.9% |
| Mar-2004 | 3.9% | 1.4% | 2.0% |
| Apr-2004 | 3.9% | 1.5% | 2.0% |
| May-2004 | 3.8% | 1.4% | 1.9% |
| Jun-2004 | 3.8% | 1.4% | 2.0% |
| Jul-2004 | 3.7% | 1.4% | 2.0% |
| Aug-2004 | 3.9% | 1.5% | 2.0% |
| Sep-2004 | 3.8% | 1.4% | 2.0% |
| Oct-2004 | 3.9% | 1.4% | 2.0% |
| Nov-2004 | 3.9% | 1.5% | 2.1% |
| Dec-2004 | 4.0% | 1.5% | 2.1% |
| Jan-2005 | 3.9% | 1.4% | 2.1% |
| Feb-2005 | 3.9% | 1.4% | 2.0% |
| Mar-2005 | 3.9% | 1.5% | 2.1% |
| Apr-2005 | 4.0% | 1.4% | 2.1% |
| May-2005 | 3.9% | 1.4% | 2.1% |
| Jun-2005 | 3.9% | 1.5% | 2.1% |
| Jul-2005 | 3.9% | 1.4% | 2.0% |
| Aug-2005 | 4.0% | 1.4% | 2.2% |
| Sep-2005 | 4.0% | 1.4% | 2.3% |
| Oct-2005 | 3.8% | 1.3% | 2.2% |
| Nov-2005 | 3.9% | 1.2% | 2.2% |
| Dec-2005 | 3.7% | 1.3% | 2.1% |
| Jan-2006 | 3.9% | 1.3% | 2.1% |
| Feb-2006 | 3.9% | 1.3% | 2.2% |
| Mar-2006 | 3.9% | 1.2% | 2.2% |
| Apr-2006 | 3.8% | 1.3% | 2.1% |
| May-2006 | 4.0% | 1.4% | 2.2% |
| Jun-2006 | 3.9% | 1.2% | 2.2% |
| Jul-2006 | 3.9% | 1.3% | 2.2% |
| Aug-2006 | 3.8% | 1.2% | 2.2% |
| Sep-2006 | 3.8% | 1.3% | 2.1% |
| Oct-2006 | 3.8% | 1.3% | 2.1% |
| Nov-2006 | 4.0% | 1.3% | 2.3% |
| Dec-2006 | 3.8% | 1.3% | 2.2% |
| Jan-2007 | 3.8% | 1.2% | 2.2% |
| Feb-2007 | 3.8% | 1.3% | 2.2% |
| Mar-2007 | 3.8% | 1.3% | 2.2% |
| Apr-2007 | 3.7% | 1.3% | 2.1% |
| May-2007 | 3.8% | 1.3% | 2.2% |
| Jun-2007 | 3.8% | 1.3% | 2.0% |
| Jul-2007 | 3.7% | 1.3% | 2.1% |
| Aug-2007 | 3.7% | 1.3% | 2.1% |
| Sep-2007 | 3.7% | 1.5% | 1.9% |
| Oct-2007 | 3.8% | 1.4% | 2.1% |
| Nov-2007 | 3.7% | 1.4% | 2.0% |
| Dec-2007 | 3.6% | 1.3% | 2.0% |
| Jan-2008 | 3.5% | 1.3% | 2.0% |
| Feb-2008 | 3.5% | 1.4% | 2.0% |
| Mar-2008 | 3.4% | 1.3% | 1.9% |
| Apr-2008 | 3.5% | 1.3% | 2.1% |
| May-2008 | 3.3% | 1.3% | 1.9% |
| Jun-2008 | 3.5% | 1.5% | 1.9% |
| Jul-2008 | 3.3% | 1.4% | 1.8% |
| Aug-2008 | 3.3% | 1.6% | 1.7% |
| Sep-2008 | 3.1% | 1.4% | 1.8% |
| Oct-2008 | 3.3% | 1.6% | 1.8% |
| Nov-2008 | 2.9% | 1.6% | 1.5% |
| Dec-2008 | 3.2% | 1.8% | 1.6% |
| Jan-2009 | 3.1% | 1.9% | 1.5% |
| Feb-2009 | 3.0% | 1.9% | 1.5% |
| Mar-2009 | 2.8% | 1.8% | 1.4% |
| Apr-2009 | 2.9% | 2.0% | 1.3% |
| May-2009 | 2.8% | 1.6% | 1.3% |
| Jun-2009 | 2.8% | 1.6% | 1.3% |
| Jul-2009 | 2.9% | 1.7% | 1.3% |
| Aug-2009 | 2.9% | 1.6% | 1.3% |
| Sep-2009 | 3.0% | 1.6% | 1.3% |
| Oct-2009 | 2.9% | 1.5% | 1.3% |
| Nov-2009 | 3.1% | 1.4% | 1.4% |
| Dec-2009 | 2.9% | 1.5% | 1.3% |
| Jan-2010 | 3.0% | 1.4% | 1.3% |
| Feb-2010 | 2.9% | 1.4% | 1.3% |
| Mar-2010 | 3.2% | 1.4% | 1.4% |
| Apr-2010 | 3.1% | 1.3% | 1.5% |
| May-2010 | 3.4% | 1.3% | 1.4% |
| Jun-2010 | 3.1% | 1.5% | 1.5% |
| Jul-2010 | 3.2% | 1.6% | 1.4% |
| Aug-2010 | 3.0% | 1.4% | 1.4% |
| Sep-2010 | 3.1% | 1.4% | 1.4% |
| Oct-2010 | 3.1% | 1.3% | 1.4% |
| Nov-2010 | 3.2% | 1.4% | 1.4% |
| Dec-2010 | 3.2% | 1.4% | 1.5% |
| Jan-2011 | 3.0% | 1.3% | 1.4% |
| Feb-2011 | 3.1% | 1.3% | 1.4% |
| Mar-2011 | 3.2% | 1.3% | 1.5% |
| Apr-2011 | 3.2% | 1.3% | 1.5% |
| May-2011 | 3.1% | 1.3% | 1.5% |
| Jun-2011 | 3.3% | 1.4% | 1.5% |
| Jul-2011 | 3.1% | 1.3% | 1.5% |
| Aug-2011 | 3.2% | 1.3% | 1.5% |
| Sep-2011 | 3.3% | 1.3% | 1.5% |
| Oct-2011 | 3.2% | 1.3% | 1.5% |
| Nov-2011 | 3.2% | 1.3% | 1.5% |
| Dec-2011 | 3.2% | 1.3% | 1.5% |
| Jan-2012 | 3.2% | 1.2% | 1.5% |
| Feb-2012 | 3.3% | 1.3% | 1.6% |
| Mar-2012 | 3.3% | 1.2% | 1.6% |
| Apr-2012 | 3.2% | 1.4% | 1.6% |
| May-2012 | 3.3% | 1.4% | 1.6% |
| Jun-2012 | 3.2% | 1.3% | 1.6% |
| Jul-2012 | 3.2% | 1.2% | 1.6% |
| Aug-2012 | 3.3% | 1.4% | 1.6% |
| Sep-2012 | 3.1% | 1.3% | 1.4% |
| Oct-2012 | 3.2% | 1.3% | 1.5% |
| Nov-2012 | 3.3% | 1.3% | 1.6% |
| Dec-2012 | 3.2% | 1.2% | 1.6% |
| Jan-2013 | 3.2% | 1.2% | 1.7% |
| Feb-2013 | 3.4% | 1.2% | 1.7% |
| Mar-2013 | 3.2% | 1.3% | 1.6% |
| Apr-2013 | 3.3% | 1.3% | 1.6% |
| May-2013 | 3.3% | 1.3% | 1.6% |
| Jun-2013 | 3.2% | 1.2% | 1.6% |
| Jul-2013 | 3.3% | 1.2% | 1.7% |
| Aug-2013 | 3.4% | 1.2% | 1.7% |
| Sep-2013 | 3.4% | 1.3% | 1.7% |
| Oct-2013 | 3.3% | 1.1% | 1.8% |
| Nov-2013 | 3.3% | 1.1% | 1.8% |
| Dec-2013 | 3.3% | 1.2% | 1.8% |
| Jan-2014 | 3.3% | 1.2% | 1.7% |
| Feb-2014 | 3.4% | 1.2% | 1.8% |
| Mar-2014 | 3.4% | 1.2% | 1.8% |
| Apr-2014 | 3.5% | 1.2% | 1.8% |
| May-2014 | 3.4% | 1.2% | 1.8% |
| Jun-2014 | 3.5% | 1.2% | 1.8% |
| Jul-2014 | 3.6% | 1.2% | 1.8% |
| Aug-2014 | 3.3% | 1.1% | 1.8% |
Note: Shaded areas denote recessions. The hires rate is the number of hires during the entire month as a percent of total employment. The layoff rate is the number of layoffs and discharges during the entire month as a percent of total employment. The quits rate is the number of quits during the entire month as a percent of total employment.
Source: EPI analysis of Bureau of Labor Statistics Job Openings and Labor Turnover Survey
How Do U.S. Retirees Compare with Those in Other Countries?
In Monday’s Wall Street Journal, Andrew Biggs and Sylvester Schieber cited these statistics from the Organisation for Economic Co-operation and Development (OECD):
“Despite a supposedly stingy Social Security program and ineffective retirement-savings vehicles, the average U.S. retiree has an income equal to 92% of the average American income, handily outpacing the Scandinavian countries (81%), Germany (85%), Belgium (77%) and many others.”
Meanwhile, in its Global AgeWatch Index released Tuesday, HelpAge International ranked the United States #8 among the best countries to grow old in, ahead of France (#18) but trailing Norway, Sweden, Switzerland, Canada, Germany, Netherlands, and Iceland (#1-7). Afghanistan (#96) was in last place.
It’s not hard to imagine how wealthy countries like Norway and the United States outrank poor and war-torn countries like Afghanistan. But the relative ranking of the wealthy countries comes as a surprise. How did the United States and other English-speaking countries like the United Kingdom and Australia, not known for their generous social insurance programs or employee benefits, come close to the Nordic cradle-to-grave welfare states and handily beat out France, with its famously generous pensions and high-quality affordable healthcare? Are older Americans really living in a retiree paradise?
Strong Jobs Numbers for Teachers in September, but Large Jobs Gap Remains
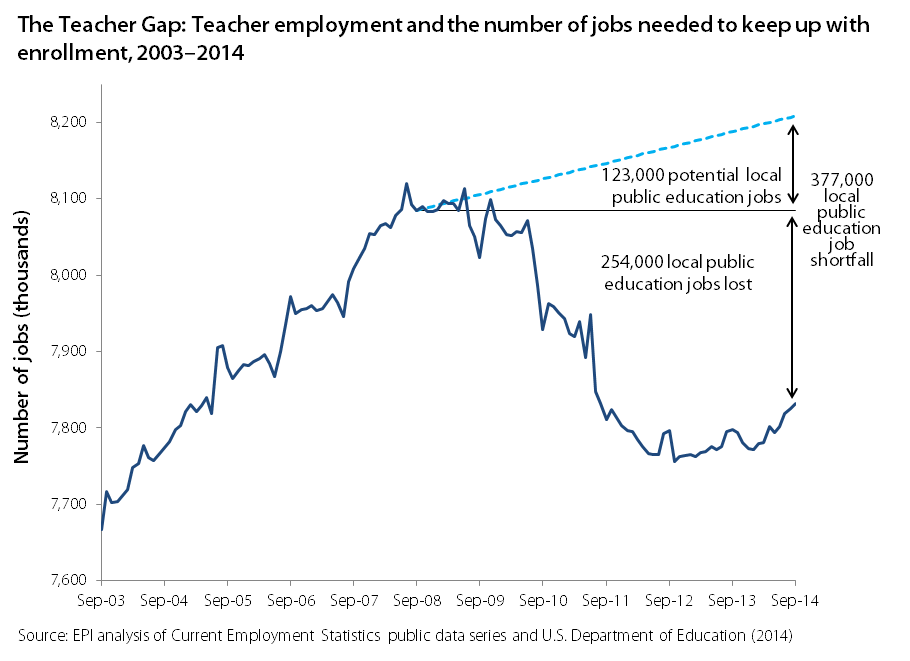
In September, public-sector employment increased by 12,000, with the majority of that growth coming from local government education—an increase of 6,700 jobs. Local government education is largely jobs in public K-12 education (the majority of which are teachers, but also teacher aides, librarians, guidance counselors, administrators, support staff, etc.).
While this is clearly a positive sign, unfortunately, the number of teachers and related education staffers fell dramatically in the recession and has failed to get anywhere near its pre-recession level, let alone the level that would be required to keep up with the expanding student population. The figure below breaks down the teacher gap. The dark blue line illustrates the level of teacher employment. While the most recent positive trend is obvious, the longer term losses are also readily apparently.
Along with dismal trends in public sector employment in general, about a quarter million public education jobs were lost in the great recession and its aftermath. If we add to that the number of public education jobs that should have been added simply to keep up with growing enrollment, then we are currently experiencing a 377,000 job shortfall in local public education. The costs of a significant teacher gap are measurable: larger class sizes, fewer teacher aides, fewer extracurricular activities, and changes to the curriculum.
The Unemployment Rate Fails to Take into Account Missing Workers
Let’s put the pieces of the puzzle together. The unemployment rate fell in September by 0.2 percent points, from 6.1 to 5.9 percent. There was also a decrease in the sheer number of unemployed people—down 329,000 from August. On its face, this sounds like good news.
At the same time, the employment-to-population ratio has remained 59.0 percent for four months running. If the unemployment rate dropped and the employment-to-population ratio remained the same, the missing part of the puzzle is the labor force participation rate. In September, the labor force participation rate dropped to 62.7 percent. The last time the labor force participation rate was this low was February 1978. And, the biggest drop in labor force participation was among prime-age workers, 25-54 years old.
Over the last year, the labor force participation rate fell 0.5 percentage points. Therefore, it’s not surprising that missing workers—potential workers who are neither working nor actively seeking work due to the weak labor market—are at an all-time-high of 6.3 million. The vast majority of them (3.4 million) are 25 to 54 years old.
To put the official unemployment rate in perspective, the figure below shows the actual unemployment rate and the unemployment rate if the missing workers were in the labor force looking for work and thus counted as unemployed. The unemployment rate including the missing workers sits at 9.6 percent, the same rate for the last four months. Perhaps, this is a better indication of the slack in the labor market and the reason why wage growth has remained so sluggish even with a falling unemployment rate.
The unemployment rate is vastly understating weakness in today's labor market: Unemployment rate, actual and if missing workers* were looking for work, January 2006–November 2014
| Date | Actual | If missing workers were looking for work |
|---|---|---|
| 2006-01-01 | 4.7% | 5.0% |
| 2006-02-01 | 4.8% | 4.8% |
| 2006-03-01 | 4.7% | 4.8% |
| 2006-04-01 | 4.7% | 4.9% |
| 2006-05-01 | 4.6% | 4.8% |
| 2006-06-01 | 4.6% | 4.7% |
| 2006-07-01 | 4.7% | 4.8% |
| 2006-08-01 | 4.7% | 4.6% |
| 2006-09-01 | 4.5% | 4.6% |
| 2006-10-01 | 4.4% | 4.4% |
| 2006-11-01 | 4.5% | 4.4% |
| 2006-12-01 | 4.4% | 4.1% |
| 2007-01-01 | 4.6% | 4.4% |
| 2007-02-01 | 4.5% | 4.4% |
| 2007-03-01 | 4.4% | 4.3% |
| 2007-04-01 | 4.5% | 4.9% |
| 2007-05-01 | 4.4% | 4.8% |
| 2007-06-01 | 4.6% | 4.8% |
| 2007-07-01 | 4.7% | 4.9% |
| 2007-08-01 | 4.6% | 5.1% |
| 2007-09-01 | 4.7% | 4.9% |
| 2007-10-01 | 4.7% | 5.2% |
| 2007-11-01 | 4.7% | 4.9% |
| 2007-12-01 | 5.0% | 5.1% |
| 2008-01-01 | 5.0% | 4.8% |
| 2008-02-01 | 4.9% | 5.0% |
| 2008-03-01 | 5.1% | 5.1% |
| 2008-04-01 | 5.0% | 5.2% |
| 2008-05-01 | 5.4% | 5.4% |
| 2008-06-01 | 5.6% | 5.6% |
| 2008-07-01 | 5.8% | 5.7% |
| 2008-08-01 | 6.1% | 6.0% |
| 2008-09-01 | 6.1% | 6.3% |
| 2008-10-01 | 6.5% | 6.5% |
| 2008-11-01 | 6.8% | 7.1% |
| 2008-12-01 | 7.3% | 7.5% |
| 2009-01-01 | 7.8% | 8.2% |
| 2009-02-01 | 8.3% | 8.7% |
| 2009-03-01 | 8.7% | 9.3% |
| 2009-04-01 | 9.0% | 9.4% |
| 2009-05-01 | 9.4% | 9.7% |
| 2009-06-01 | 9.5% | 9.9% |
| 2009-07-01 | 9.5% | 10.1% |
| 2009-08-01 | 9.6% | 10.4% |
| 2009-09-01 | 9.8% | 10.9% |
| 2009-10-01 | 10.0% | 11.3% |
| 2009-11-01 | 9.9% | 11.2% |
| 2009-12-01 | 9.9% | 11.7% |
| 2010-01-01 | 9.7% | 11.3% |
| 2010-02-01 | 9.8% | 11.4% |
| 2010-03-01 | 9.9% | 11.3% |
| 2010-04-01 | 9.9% | 11.0% |
| 2010-05-01 | 9.6% | 11.1% |
| 2010-06-01 | 9.4% | 11.1% |
| 2010-07-01 | 9.5% | 11.3% |
| 2010-08-01 | 9.5% | 11.1% |
| 2010-09-01 | 9.5% | 11.3% |
| 2010-10-01 | 9.5% | 11.5% |
| 2010-11-01 | 9.8% | 11.7% |
| 2010-12-01 | 9.4% | 11.6% |
| 2011-01-01 | 9.1% | 11.4% |
| 2011-02-01 | 9.0% | 11.4% |
| 2011-03-01 | 9.0% | 11.3% |
| 2011-04-01 | 9.1% | 11.4% |
| 2011-05-01 | 9.0% | 11.4% |
| 2011-06-01 | 9.1% | 11.5% |
| 2011-07-11 | 9.0% | 11.7% |
| 2011-08-20 | 9.0% | 11.4% |
| 2011-09-01 | 9.0% | 11.3% |
| 2011-10-11 | 8.8% | 11.2% |
| 2011-11-20 | 8.6% | 11.0% |
| 2011-12-30 | 8.5% | 11.0% |
| 2012-01-12 | 8.2% | 10.8% |
| 2012-02-12 | 8.3% | 10.7% |
| 2012-03-12 | 8.2% | 10.7% |
| 2012-04-12 | 8.2% | 10.9% |
| 2012-05-12 | 8.2% | 10.6% |
| 2012-06-12 | 8.2% | 10.5% |
| 2012-07-12 | 8.2% | 10.8% |
| 2012-08-12 | 8.1% | 10.8% |
| 2012-09-12 | 7.8% | 10.4% |
| 2012-10-12 | 7.8% | 10.0% |
| 2012-11-12 | 7.8% | 10.3% |
| 2012-12-12 | 7.9% | 10.3% |
| 2013-01-12 | 7.9% | 10.4% |
| 2013-02-12 | 7.7% | 10.5% |
| 2013-03-12 | 7.5% | 10.6% |
| 2013-04-12 | 7.5% | 10.5% |
| 2013-05-12 | 7.5% | 10.3% |
| 2013-06-12 | 7.5% | 10.3% |
| 2013-07-12 | 7.3% | 10.2% |
| 2013-08-12 | 7.2% | 10.3% |
| 2013-09-12 | 7.2% | 10.3% |
| 2013-10-12 | 7.2% | 10.7% |
| 2013-11-12 | 7.0% | 10.3% |
| 2013-12-12 | 6.7% | 10.2% |
| 2014-01-12 | 6.6% | 10.0% |
| 2014-02-12 | 6.7% | 10.0 |
| 2014-03-12 | 6.7% | 9.8% |
| 2014-04-12 | 6.3% | 9.9% |
| 2014-05-12 | 6.3% | 9.7% |
| 2014-06-12 | 6.1% | 9.6% |
| 2014-07-12 | 6.2% | 9.6% |
| 2014-08-12 | 6.1% | 9.6% |
| 2014-09-12 | 5.9% | 9.6% |
| 2014-10-12 | 5.8% | 9.1% |
| 2014-11-12 | 5.8% | 9.2% |
* Potential workers who, due to weak job opportunities, are neither employed nor actively seeking work
Source: EPI analysis of Mitra Toossi, “Labor Force Projections to 2016: More Workers in Their Golden Years,” Bureau of Labor Statistics Monthly Labor Review, November 2007; and Current Population Survey public data series
Wage Growth Continues to be Sluggish
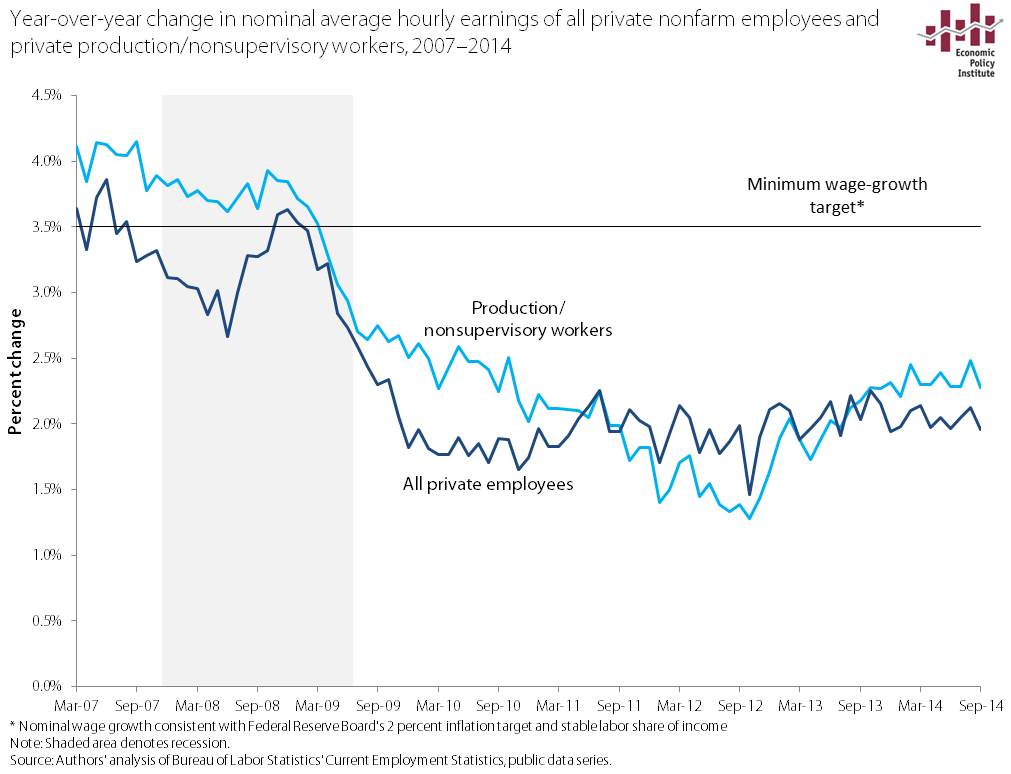
While the BLS reported positive overall jobs numbers for September, one notable downside of this morning’s release is that wages grew not at all in the last month. Average hourly earnings of all employees on nonfarm payrolls were little changed (a one cent decline) and average hourly earnings of production and nonsupervisory employees on private nonfarm payrolls saw zero growth. That said, I’d caution reading too much into one month’s numbers because monthly changes can be volatile and longer term trends are more indicative of the overall health of the economy. The fact is that wage growth for both series has been hovering just above 2 percent over the last year.
As shown in the figure below, wage growth is far below the 3.5 percent rate consistent with the Federal Reserve Board’s inflation target of 2 percent. It’s clear that Fed policymakers should abandon notions of slowing the economy. (For a longer analysis of what to watch for in upcoming months on wage growth, see this explainer.)
Walton Family Net Worth is a Case Study Why Growing Wealth Concentration Isn’t Just an Academic Worry
Earlier this year, economist Thomas Piketty caused a stir with a book arguing that the future in advanced economies could see a relentless concentration of wealth among a small sliver of families, whose fortunes would increasingly dwarf those of the typical citizen. The last couple of weeks have seen the release of a couple of key barometers of wealth inequality in America, and combining them, it’s easy to see that this hypothesis of ever-concentrating wealth seems likely indeed. In the past month, the Federal Reserve released its triennial Survey of Consumer Finance (SCF) for 2013, while Forbes magazine released their annual list of the 400 wealthiest Americans.
The SFC is the most comprehensive and high-quality measure of Americans’ wealth up and down the distribution. It makes a special effort to sample very high wealth American households, but actually explicitly excludes listed members of the Forbes 400 (for reasons of confidentiality). The Forbes 400, as is well known, puts a dollar value on the net worth of the 400 wealthiest Americans. There is plenty of material in these releases to assess the current state of wealth inequality in America.
Take one example, that we’ve calculated before: comparing the family wealth of six of the wealthiest members of the Walton family (reported at just under $145 billion in 2013) with the number of American families that you could add together and still have their net worth come in less than the 6 Walton heirs: 52.5 million, or 42.9 percent of American families.
Some have objected to this statistic on the grounds that the negative net worth families (11.5 percent of all American families) somehow shouldn’t count in this calculation. So, try another statistic: how many families that held the median wealth would you need to add together to equal the holdings of the six Walton heirs: more than 1.7 million. The median wealthholder in the United States, remember, has more wealth than half of all American families and less wealth than half (around $81,200 in 2013).
So, what this statistic means is that you’d essentially need a large city’s worth of these typical American families to equal the wealth of the six Walton heirs. And this number has grown steadily over time, as the figure below shows. The falling wealth of the median family (driven largely by the housing bubble burst) and the steadily rising wealth at the very top—including the Walton heirs—have combined to make the gap between them larger and larger over time.

Myths and Facts about Corporate Taxes, Part 1: Do American Corporations Pay the Highest Taxes in the World?
It’s become conventional wisdom that American corporate tax rates are the highest in the developed world, leaving American businesses at a competitive disadvantage—and that the only solution is fundamental tax reform (a phrase used by both Republicans and Democrats). Just yesterday, the Washington Post reported offhandedly that U.S. businesses “currently labor under the highest corporate tax rate in the developed world.” The fact is there are a lot of myths about the corporate tax code—myths that are repeated by corporations that stand to benefit from them. So, let’s look at the facts.
Myth: American corporations pay more in taxes than their competitors in any other country.
Fact: Any claim that the United States has the highest corporate tax rate in the world should be accompanied by a clarification that the rate American companies actually pay, on average, is comparable to what their foreign competitors pay.
Yes, the tax rates on the books (the “statutory” rates) in the United States are high relative to our international peers, but the U.S. corporate tax code has become so riddled with loopholes—and American corporations so adept at exploiting them—that the total amount of taxes actually paid by U.S. corporations (the “effective” corporate tax rate) is far less.
The Government Accountability Office found that large, profitable American corporations pay an effective rate of less than 13 percent in U.S. federal taxes; when state and foreign taxes are included, the rate only increases to 17 percent—a far cry from the statutory 39 percent. Meanwhile, the Congressional Research Service found that the effective rate here is nearly identical to the weighted average of corporate taxes in the world’s other most developed economies. (EPI’s Thomas Hungerford found the same thing.)