Separate is still unequal: How patterns of occupational segregation impact pay for black women
August 7th is Black Women’s Equal Pay Day, the day that marks how long into 2018 an African American woman would have to work in order to be paid the same wages her white male counterpart was paid last year. On average, in 2017, black women workers were paid only 66 cents on the dollar relative to non-Hispanic white men, even after controlling for education, years of experience, and geographic location. A previous blog post dispels many of the myths behind why this pay gap exists, including the idea that the gap would be closed by black women getting more education or choosing higher paying jobs. In fact, black women earn less than white men at every level of education and even when they work in the same occupation. But even if changing jobs were an effective way to close the pay gap black women face—and it isn’t—more than half would need to change jobs in order to achieve occupational equity.
Figure A plots the “Duncan Segregation Index” (DSI) for black women and white men, overall and by education, based on individual occupation data from the American Community Survey (ACS). This is a common measure of occupational segregation, which, in this case identifies what percentage of working black women (or white men) would need to change jobs in order for black women and white men to be fully integrated across occupations. Values of the DSI can range from 0 percent (complete integration) to 100 percent (complete segregation).
As shown in Figure A, there has been little progress on reducing occupational segregation between black women and white men since 2000. From 2000 to 2016 (latest data year available), the DSI only changed from 59 percent to 56 percent. This means that on average, 56 percent of black women (or white men) would need to change occupations in order to achieve occupational equity, or full integration of these two groups in the workforce.
How do we know the tax cut isn’t working to boost wages? Investment, investment, investment
Earlier this week, my colleague Hunter Blair noted that economic data released over the past six months contained no real signs that any of the promised benefits of the Republican tax cut passed at the end of last year were showing up for workers. These benefits are certainly showing up for corporations and the wealthy households that own them—which makes sense, as the tax cut was overwhelmingly a tax cut for corporations. But the tax cut’s boosters promised that money corporations saved on taxes would quickly show up as higher wages for workers. In fact, they claimed this was happening so quickly that the tax cut was responsible for bonuses at the end of 2017 that were granted or announced before the tax cut actually became law.
As silly as those arguments were, a case that corporate tax cuts will lead to wage increases does exist in economics textbooks. The most crucial link in the chain leading from cutting corporations’ taxes to workers seeing higher paychecks runs through increased business investment in plants, equipment, and research. Essentially, lower corporate taxes are supposed to incentivize businesses to undertake more investment in productivity-enhancing plants, equipment, and research, and induce extra spending to finance these increased investments. This extra investment is supposed to lead to higher productivity, and hence to higher wages for workers. I should note that most of the links in this chain are broken, but for now, let’s just focus on the first—the effect of the tax cut in spurring business investment. If that fails, the whole case for tax cuts boosting wages fails.
The figure below shows the percent change in business investment relative to the same quarter in the previous year, with the vertical line showing when the tax cut was passed. The data is from the Bureau of Economic Analysis (BEA), National Income and Product Accounts (NIPA) Table 1.1.3. It is awfully hard to see a real regime change here in investment behavior.
What to Watch on Jobs Day: Wringing out every last bit of slack in the labor market
Two weeks ago, EPI released a paper by Estelle Sommeiller and Mark Price detailing, county-by-county, the rise in income inequality since the 1970s. Since the Great Recession, the top 1 percent of families have captured 41.8 percent of all income growth in the United States—and this disproportionate hoarding of economic growth is not unique to East Coast metropolises and Silicon Valley. All across the country, downward pressure on wages and incomes for most Americans has limited their ability to benefit from a growing economic pie. A decline in unionization and other deliberate policy choices that have reduced typical workers’ leverage and bargaining power in the labor market have contributed to these worrying trends.
Nonetheless, some experts still question why today’s relatively tighter economy isn’t bringing benefits to workers in the form of increased wages, given that we’ve seen relatively low unemployment rates over the course of the past two years—below 4.5 percent unemployment since March of last year. Josh Bivens reiterated this week EPI’s consistent stance that, “weak wage growth should make us think that by definition there is still slack in the labor market, and this might mean rethinking just how low unemployment can go.” Given this reality, policymakers (including the Fed) should stop attempting to slow the economy and allow the labor market to keep tightening, until there is consistent evidence that the benefits of a strong economy are being shared with a wide swath of the workforce. This includes many women of color who face pay gaps so large that they typically would need to work through the third or fourth quarter of another year just to earn as much as the average white man earned during the previous year. For black women, that date is next Tuesday, August 7.
In last month’s jobs report, we saw the unemployment rate tick up from 3.8 to 4.0, for positive reasons. The rise was accompanied by an increase in labor force entrants, suggesting workers are feeling optimistic about the jobs market and sidelined workers are indeed still being drawn back into the labor force. Looking at today’s prime-age employment-to-population ratio, which is still below the peaks of the last two business cycles, this is less surprising. As it has for most of the past several years, the low unemployment rate looks to be potentially overstating the strength of the labor market.
Tomorrow morning, we will continue to look at the unemployment rate, given its recent volatility, but we will also be watching nominal wage growth and the prime-age employment-to-population ratio for evidence that the economy continues to move closer to full employment.
The “wage puzzle” is real—but low inflation and low productivity are also puzzles that need to be solved
Jason Furman’s recent piece in Vox is drawing lots of comments (including one by me on a relatively minor issue). The last couple of months have seen lots of attention focused on relatively weak wage growth even in the face of low unemployment—sometimes referred to as the “wage puzzle.” I and others have argued that this weak wage growth should make us think that by definition there is still slack in the labor market, and this might mean rethinking just how low unemployment can go. Furman argues instead that wage growth is not that low, and that labor markets are tight indeed. A main piece of evidence he highlights to support this view is that both inflation and productivity growth have been low in recent years, and, adjusted for these two influences we really can’t expect wage growth to be any higher than it has been.
Furman is quick to note that his outlook does not demand rapid policy tightening to rein in growth. I’m definitely happy he says this. However, I do think any argument that concludes that the U.S. economy is unambiguously at full employment, and that the labor market is even tighter than the late 1990s, is going to give succor to those calling for the Federal Reserve to continue raising interest rates briskly to rein in growth.
This would be a mistake, and Furman’s arguments should certainly not sway anybody to call for continued policy tightening. He makes some good points, but I think he misreads what low inflation and low productivity are telling us. They are not just background variables that we have to take as given and adjust our wage expectations accordingly. Instead, low inflation and low productivity should be seen as signs of slack in and of themselves.
Last week’s GDP data shows there’s still no reason to think the TCJA’s corporate rate cuts are trickling down to workers
Last Friday, new data was released by the Bureau of Economic Analysis (BEA) with the headline being a 4.1 percent annualized rate of GDP growth. Supporters of the Tax Cuts and Jobs Act (TCJA) have pointed to this data point as proof that the tax cuts are working, though there’s little indication that economic growth has moved off its previous trend. But the release of new economic data does give us another chance to see what that data is telling us so far about the effects of the TCJA. The punchline is simple: the TCJA has already fattened up the incomes of capital owners and corporations in a measurable way, but there’s no indication at all that any of it threatens to trickle-down to workers.
The corporate sector is unsurprisingly where the clearest near-term effects of the TCJA can be seen. Domestic after-tax corporate profits increased from 6.7 percent of GDP in 2017 to 7.4 percent in the first quarter of 2018. In particular, undistributed domestic corporate profits surged in response to the TCJA’s tax windfall for multinational corporations on the profits they had booked offshore. As the chart below shows, much like the spike following the 2004 repatriation tax “holiday,” undistributed domestic corporate profits rose from 2.5 percent of gross domestic corporate value added in 2017 to 12 percent in the first quarter of 2018. We should note that 2004’s tax holiday didn’t lead to a surge in wage growth in subsequent years.
First quarter data from 2018 shows an enormous spike in undistributed profits: Undistributed domestic corporate profits as a percent of domestic corporate gross value added, 1979Q1-2018Q1
| Undistributed profits as a percent of corporate gross value added | |
|---|---|
| 1979Q1 | 4.71% |
| 1979Q2 | 4.39% |
| 1979Q3 | 4.05% |
| 1979Q4 | 3.70% |
| 1980Q1 | 2.84% |
| 1980Q2 | 1.73% |
| 1980Q3 | 2.42% |
| 1980Q4 | 3.02% |
| 1981Q1 | 3.30% |
| 1981Q2 | 3.57% |
| 1981Q3 | 4.13% |
| 1981Q4 | 3.74% |
| 1982Q1 | 3.15% |
| 1982Q2 | 4.05% |
| 1982Q3 | 3.70% |
| 1982Q4 | 3.05% |
| 1983Q1 | 3.35% |
| 1983Q2 | 3.88% |
| 1983Q3 | 4.08% |
| 1983Q4 | 4.39% |
| 1984Q1 | 5.08% |
| 1984Q2 | 5.02% |
| 1984Q3 | 5.17% |
| 1984Q4 | 5.39% |
| 1985Q1 | 5.15% |
| 1985Q2 | 4.77% |
| 1985Q3 | 5.37% |
| 1985Q4 | 4.36% |
| 1986Q1 | 3.72% |
| 1986Q2 | 3.08% |
| 1986Q3 | 2.83% |
| 1986Q4 | 2.34% |
| 1987Q1 | 2.62% |
| 1987Q2 | 2.98% |
| 1987Q3 | 3.45% |
| 1987Q4 | 3.18% |
| 1988Q1 | 3.80% |
| 1988Q2 | 3.43% |
| 1988Q3 | 2.91% |
| 1988Q4 | 3.62% |
| 1989Q1 | 2.09% |
| 1989Q2 | 2.15% |
| 1989Q3 | 2.13% |
| 1989Q4 | 1.75% |
| 1990Q1 | 1.48% |
| 1990Q2 | 1.81% |
| 1990Q3 | 1.01% |
| 1990Q4 | 0.92% |
| 1991Q1 | 1.49% |
| 1991Q2 | 1.57% |
| 1991Q3 | 1.59% |
| 1991Q4 | 1.31% |
| 1992Q1 | 1.54% |
| 1992Q2 | 1.50% |
| 1992Q3 | 1.36% |
| 1992Q4 | 1.66% |
| 1993Q1 | 1.53% |
| 1993Q2 | 1.99% |
| 1993Q3 | 2.30% |
| 1993Q4 | 2.54% |
| 1994Q1 | 3.09% |
| 1994Q2 | 3.24% |
| 1994Q3 | 3.40% |
| 1994Q4 | 3.55% |
| 1995Q1 | 3.30% |
| 1995Q2 | 3.46% |
| 1995Q3 | 3.71% |
| 1995Q4 | 3.75% |
| 1996Q1 | 4.14% |
| 1996Q2 | 4.04% |
| 1996Q3 | 3.91% |
| 1996Q4 | 3.97% |
| 1997Q1 | 4.25% |
| 1997Q2 | 4.20% |
| 1997Q3 | 4.38% |
| 1997Q4 | 3.92% |
| 1998Q1 | 2.83% |
| 1998Q2 | 2.85% |
| 1998Q3 | 3.16% |
| 1998Q4 | 2.69% |
| 1999Q1 | 3.04% |
| 1999Q2 | 2.94% |
| 1999Q3 | 2.57% |
| 1999Q4 | 1.82% |
| 2000Q1 | 1.37% |
| 2000Q2 | 1.08% |
| 2000Q3 | 0.87% |
| 2000Q4 | 0.46% |
| 2001Q1 | 0.57% |
| 2001Q2 | 1.00% |
| 2001Q3 | 0.33% |
| 2001Q4 | -0.29% |
| 2002Q1 | 1.38% |
| 2002Q2 | 1.56% |
| 2002Q3 | 2.06% |
| 2002Q4 | 2.36% |
| 2003Q1 | 2.66% |
| 2003Q2 | 1.88% |
| 2003Q3 | 2.66% |
| 2003Q4 | 2.41% |
| 2004Q1 | 2.92% |
| 2004Q2 | 3.34% |
| 2004Q3 | 3.51% |
| 2004Q4 | 1.22% |
| 2005Q1 | 3.24% |
| 2005Q2 | 4.83% |
| 2005Q3 | 6.26% |
| 2005Q4 | 8.40% |
| 2006Q1 | 3.79% |
| 2006Q2 | 3.40% |
| 2006Q3 | 3.22% |
| 2006Q4 | 1.40% |
| 2007Q1 | 2.11% |
| 2007Q2 | 2.38% |
| 2007Q3 | 0.99% |
| 2007Q4 | 1.16% |
| 2008Q1 | 0.88% |
| 2008Q2 | 0.66% |
| 2008Q3 | 2.14% |
| 2008Q4 | 1.91% |
| 2009Q1 | 1.01% |
| 2009Q2 | 1.53% |
| 2009Q3 | 3.22% |
| 2009Q4 | 3.84% |
| 2010Q1 | 4.38% |
| 2010Q2 | 4.73% |
| 2010Q3 | 5.10% |
| 2010Q4 | 4.57% |
| 2011Q1 | 3.40% |
| 2011Q2 | 4.51% |
| 2011Q3 | 4.52% |
| 2011Q4 | 4.69% |
| 2012Q1 | 4.49% |
| 2012Q2 | 4.78% |
| 2012Q3 | 4.17% |
| 2012Q4 | 2.56% |
| 2013Q1 | 4.60% |
| 2013Q2 | 4.71% |
| 2013Q3 | 3.49% |
| 2013Q4 | 4.75% |
| 2014Q1 | 2.65% |
| 2014Q2 | 3.81% |
| 2014Q3 | 4.97% |
| 2014Q4 | 4.75% |
| 2015Q1 | 3.63% |
| 2015Q2 | 3.37% |
| 2015Q3 | 3.65% |
| 2015Q4 | 2.47% |
| 2016Q1 | 3.33% |
| 2016Q2 | 2.18% |
| 2016Q3 | 2.48% |
| 2016Q4 | 2.00% |
| 2017Q1 | 2.17% |
| 2017Q2 | 2.24% |
| 2017Q3 | 3.06% |
| 2017Q4 | 2.58% |
| 2018Q1 | 12.04% |

Source: EPI analysis of data from table 1.14 from the National Income and Product Accounts (NIPA) from the Bureau of Economic Analysis (BEA).
Corporate tax revenues as a share of the economy fell by more than a third, from 1.8 percent of GDP in 2017 to 1.1 percent in the first quarter of 2018. This data makes it clear that the TCJA made some people very rich in the first quarter of 2018. (Second quarter corporate data has not been released yet.) Does Friday’s data on the overall economy show any indication that the corporate tax cuts have started to trickle down to workers as the Trump administration promised?
Nope, not at all. For one, wages haven’t budged. To be fair, no serious economist should have argued that wages are expected to respond immediately to corporate tax cuts. Though that didn’t keep TCJA supporters (including some economists willing to act unserious) from touting bonuses paid late last year as proof that the tax cuts were working as intended. It’s worth reminding ourselves of the economic chain of causation that leads from corporate tax cuts to wage growth. First, the direct benefits of corporate tax cuts flow entirely to shareholders. That part has definitely happened. Then, (as we’ve previously explained), higher after-tax profitability is supposed to incentivize firms to invest more, with those investments financed by the higher savings that households provide in response to higher returns. These investments in turn are supposed to give workers more and better tools to do their jobs, which boosts productivity and eventually that increase in productivity translates into wage growth.
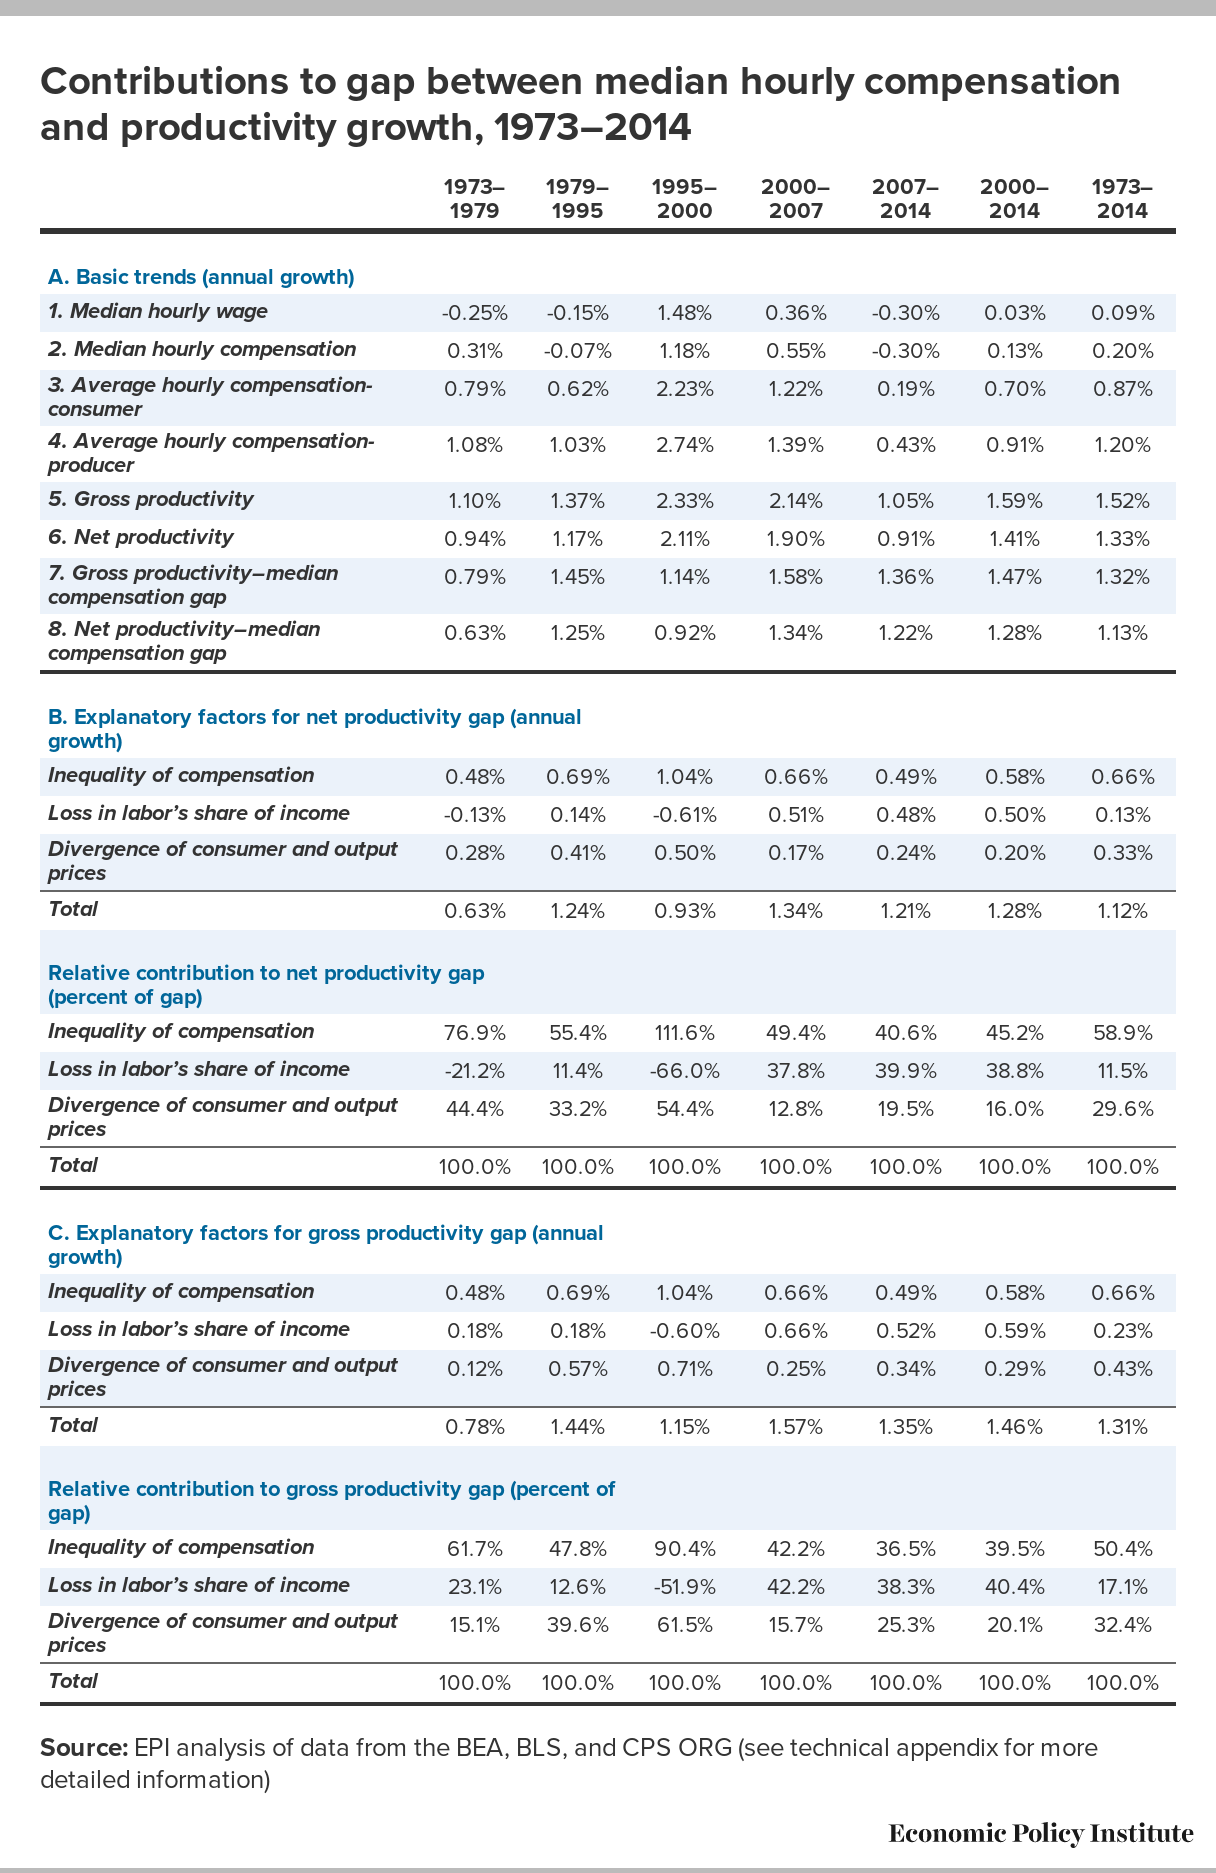
Nothing misleading about this: Typical workers’ pay and productivity have diverged
Jason Furman has an interesting piece on Vox today, claiming that the “puzzle” of weak wage growth in the face of low unemployment is not really a puzzle at all.
There’s a lot in this piece to agree with and a lot to quibble with. But, this post will just note one quick quibble. Furman describes a chart of ours—one we like a lot—as “misleading.” Here’s the full paragraph from him:
Productivity does a good job of explaining the evolution of average wage growth in the United States as well, especially prior to 2000. (But it does a decent job even since then, even with the wage slowdown.) From the end of World War II until around 2000 average wages grew almost lock-step with productivity — if you use the same measure of inflation for both concepts, so the comparison is apples to apples. Often, presentations of the comparison between wages and productivity, as in this much-reproduced graphic, use a higher inflation measure to adjust wages than productivity and thus produce a misleading impression.
This is a criticism we’ve seen, and addressed, before, so forgive me if I seem a tad sensitive on this, but I want to be really clear: there is nothing misleading about our presentation of this data. The wedge we show between our measure of pay and economy-wide productivity is indeed driven overwhelmingly by rising inequality and not the differing deflators. In this figure we measure the pay of typical workers, not average wages. We define “typical” as either the median worker (the one in the middle of the wage distribution) or the average pay of production and non-supervisory workers (a group consisting of about 80 percent of the private-sector workforce). We don’t use average pay precisely because, as Jason notes, average pay kept up pretty well with economy-wide productivity pre-2000. This means that the bulk of the rise in inequality over that time was driven by inequality within wages, or the divergence between average and typical pay (as we clearly show—see the previous link).
Does America’s monopoly problem mean that high-pressure labor markets can’t boost wages?
Last week, I wrote a piece on why the erosion of workers’ labor market leverage does not imply that genuine full employment won’t be accompanied by wage growth. It was in response to questions about why wages in the United States weren’t growing faster given that unemployment is pretty low in historical terms. The punchline of the discussion was pretty clear: the definition of full employment is wages rising fast enough to put upward pressure on the Federal Reserve’s inflation target. If wages aren’t rising this fast, then we aren’t at full employment. The eroding relative labor market leverage power of workers does not change this.
Another reason often given for slow wage growth in the face of relatively low unemployment is rising monopolization. Does monopoly change any of the calculus I sketched out above? Almost surely not.
To be really clear on this, I’m more-than-sympathetic to the view that the U.S. economy has a monopoly problem. Empirical research clearly shows upticks in industry concentration ratios, and a number of large and crucial economic sectors (health care and finance, in particular) are characterized by immense pricing power of producers. Other sectors (mostly technology) have also seen waves of consolidation that have not led (yet?) to rapid price growth, but have raised a whole host of concerns about the intersection of economic and political power.
A long spell of very low unemployment would raise wages—even in the face of employers’ monopsony power
Probably the most-asked question about the U.S. economy in recent months has been “why aren’t wages growing faster?” For years during the slow recovery from the Great Recession of 2008–09, the reason why wages weren’t growing fast enough was pretty clear: the labor market had too much “slack”, represented by the millions of potential workers sidelined by the crisis who were queuing up to take any available job. The big bargaining chip workers have when negotiating for higher wages is the threat to quit and find another job. This threat isn’t very credible when alternative work is hard to find and there are multiple workers who would jump at the chance to take your current job.
But because unemployment has dropped below pre-Great Recession levels, many have decided that labor slack can’t be the cause of subdued wage growth anymore. So, the search for causes of sluggish wage growth that are not labor slack has begun. Two (potentially related) suspects accused in recent months have been an erosion of workers’ labor market leverage (sometimes referred to as growing monopsony power on the part of employers) and rising monopolization. This post will discuss the first one, one tomorrow will tackle monopoly.
Two punchlines to this discussion are simple enough to highlight:
Why is wage growth so slow? It’s not because low-wage jobs are being added disproportionately
Despite an unemployment rate that averaged 4.1 percent over the last 12 months, the average real (inflation-adjusted) wage of private sector workers did not grow at all over this period. Part of the reason is an increase in energy prices, which is likely to be temporary, but our slow wage growth has mostly been driven by nominal wages failing to rise quickly even in the face of low unemployment.
One explanation worth looking into is whether today’s low wage growth is due to a composition effect—i.e. low-wage jobs being added faster than middle- and/or high-wage jobs and, as a result, pulling down wage growth.
Composition was certainly a factor during the early part of the recovery from the Great Recession. In the first few years of the recovery, the jobs being added were very disproportionately low-wage jobs, which had the effect of pulling wage growth down over that period. But since 2013, as the recovery has strengthened, the opposite has been true—low-wage jobs are actually declining on net while middle and high wage jobs are being added, which has the effect of raising average wages. In other words, the composition effect is currently putting upward pressure on wages.
Why is real wage growth anemic? It’s not because of a skills shortage
Despite an unemployment rate at 4.1 percent or less since last October, wage growth has been anemic. In fact, over the last year, the average real wage of private sector workers saw no growth at all. While the total lack of growth in inflation-adjusted (real) wages over the last year is due in part to an increase in energy prices that is likely temporary, the slow real wage growth we’ve seen in recent years is mostly driven by nominal wages failing to rise quickly even in the face of low unemployment.
Some have posited that our far-less-than-stellar wage growth right now could be due to workers not having the skills employers need. But that idea has the logic backwards. When employers can’t find workers with the skills they need at the wages they are offering, they will raise wages in order to attract qualified workers—if employers can’t find the workers they need among the unemployed, they will offer higher wages in an attempt to poach needed workers from other firms, who will then raise wages in an attempt to keep their workers, and so on. In other words, if there are skills shortages, we should see signs of faster wage growth for workers with needed skills. This fast wage growth for skilled workers should push up average wages, not weigh them down. Since we continue to see anemic average wage growth, not just slow wage growth for select groups of workers, it’s clear that there is not a widespread shortage of the types of workers (i.e., those with the right skills) that employers need.
But we certainly hear widespread employer complaints about not being able to find workers. Why? One reason is monopsony power in the U.S. labor market. There is a lot of evidence that many firms have monopsony power, either because of a limited number of buyers of labor or other sources beyond labor market concentration. When firms have monopsony power, they are able to pay workers less than what their work is “worth,” i.e. less than their marginal product. But a key dynamic of monopsony power is that even though monopsonists would like to hire more workers, the low wages they offer mean they can’t attract more workers unless they pay more. That is, it is a normal state of affairs for a firm with monopsony power to wish they could hire more workers at the wages they are offering, but to be unable to attract additional workers because their wages are too low. So when a firm with the power to set wages below a workers’ marginal product complains about not being able to find workers at the wages they are offering, it’s useful to remember that they are choosing to keep wages low in order to increase profits—which remain high as a share of corporate sector income—and could get more workers by simply raising wages. And importantly, when firms with monopsony power complain about not being able to find workers, it is not adequate evidence of a skills shortage.