Congress and Trump discover bipartisanship on immigration—but only to increase H-2B visas for captive and underpaid migrant workers
Instead of taking action together to enact legislation that would provide a path to citizenship for the unauthorized immigrants who are in danger of losing their immigration protections and work authorization as a result of President Trump’s efforts to end Deferred Action for Childhood Arrivals (DACA) and Temporary Protected Status, Congress and the Trump administration have collaborated to increase in the size of the main temporary work visa program that U.S. employers use to fill low-wage non-agricultural jobs: the H-2B visa.
This year, employers and corporate lobbyists claimed—as they do every year—that 66,000 low-wage work visas were not enough to fulfill their demand for cheap, captive labor in the landscaping, construction, forestry, seafood, meat processing, traveling carnival, and hospitality industries. Members of Congress acquiesced to their demands by inserting language into the appropriations legislation that is now funding the government during fiscal year 2019, that gave the Department of Homeland Security (DHS) the authority to temporarily increase the annual limit of 66,000 visas by up to 63,500 additional visas. DHS ultimately decided last week to increase the H-2B annual limit by 30,000 visas, taking the total H-2B “cap” for 2019 to 96,000.
Migrant workers make important contributions to the U.S. economy, and it should go without saying that they deserve equal rights, fair pay, protections from retaliation, and a path to permanent residence and citizenship. Sadly, the H-2B program does not meet any of these standards. Instead, the H-2B program—like other U.S. temporary work visas programs—empowers employers to legally exert an unusual amount of control over migrant workers, who often arrive indebted to the labor recruiters who connect them to jobs in the United States. H-2B workers are in effect, captive, because their visa status is controlled by their employer—which means that if an H-2B worker isn’t paid the wage he or she was promised, or is forced to work in an unsafe workplace—the worker has little incentive to speak up or complain to the authorities. Complaining can result in getting fired, which leads to becoming undocumented and possibly deported. It also means not being able to earn back the money that was invested in order to get the job.
These problems, which are inherent in the H-2B program, are well-documented. There are numerous cases of litigation, media reports, government audits, and studies revealing how migrants employed through the H-2B program arrive in the United States with massive debt, are often exploited and robbed by employers, and even become victims of human trafficking. While these most-egregious examples are clear legal violations, much of the abuse and discrimination in the H-2B program is perfectly legal. First, employers control the workers’ immigration status. And second, employers have been allowed to underpay H-2B workers for years thanks to the way the H-2B wage rules work, which have included policy changes made through appropriations riders that have weakened the already-inadequate wage rules and de-funded enforcement. Since U.S. workers are forced to compete with vulnerable and underpaid H-2B workers, wages and working conditions for all workers in major H-2B occupations are degraded. As a result, there’s no question that the H-2B program needs major reforms to protect both migrant and American workers.
Table 1 below illustrates how the H-2B program allows employers to undercut U.S. wage standards. Table 1 shows the top 20 H-2B occupations in fiscal2017 by Standard Occupational Classification code, according to H-2B jobs certified by the U.S. Department of Labor (DOL), and the nationwide average hourly wage for all certified H-2B workers in each of the occupations. The 2017 average hourly wage rates for all workers in the occupation nationwide, according to the DOL’s Occupational Employment Statistics (OES) survey—which is used to set H-2B wage rates, making it an apples-to-apples comparison—is listed next to the H-2B wage. The final column shows the difference between the average hourly certified H-2B wage and the average hourly OES wage for the entire country; this is what employers save, on average, by hiring an H-2B worker instead of a worker who is paid the national average wage for the occupation.Read more
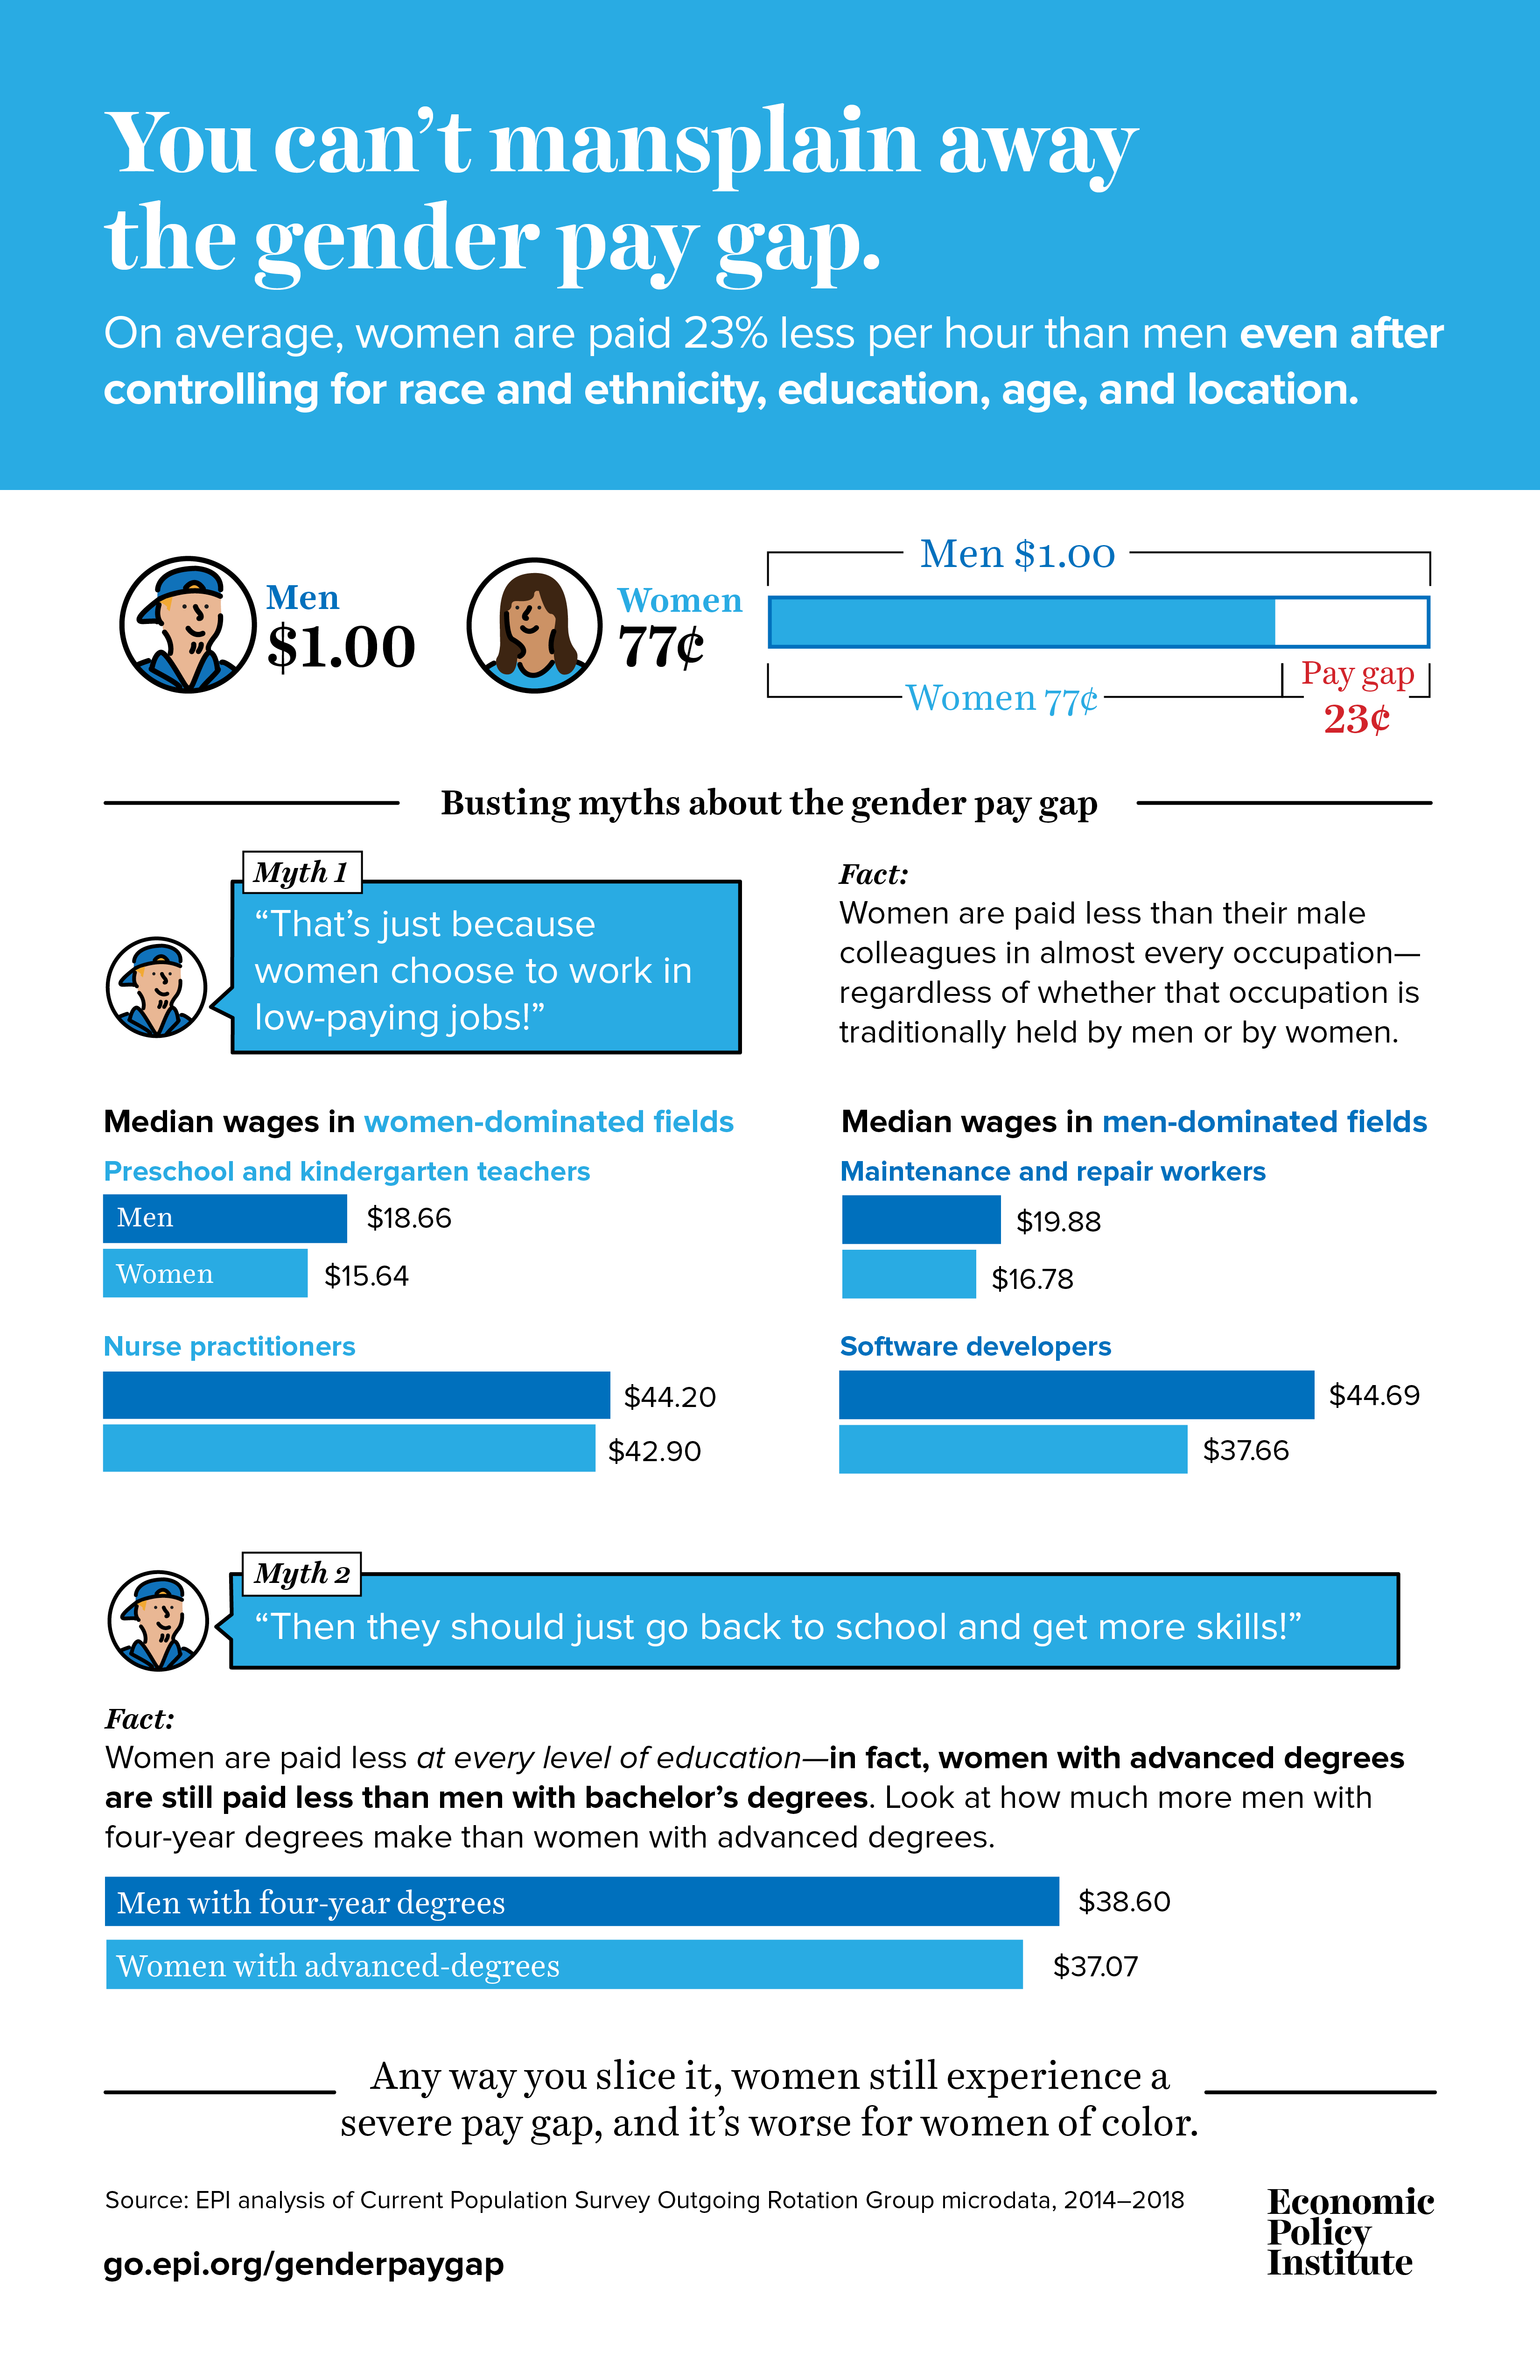
Equal Pay Day is a reminder that you can’t mansplain away the gender pay gap
April 2nd is Equal Pay Day, a reminder that there is still a significant pay gap between men and women in our country. The date represents how far into 2019 women would have to work to be paid the same amount that men were paid in 2018. On average in 2018, women were paid 22.6 percent less than men, after controlling for race and ethnicity, education, age, and geographic division.
Even after extensive research has been done to show the gender pay gap exists (and persists), some skeptics refuse to believe the data. This infographic shows some of the most common criticisms of the gender wage gap and rebuts the “mansplainers” with data.
The House makes way for equal pay with the passage of Paycheck Fairness Act
Yesterday, the House of Representatives took an important step toward ending gender-based pay discrimination by passing the Paycheck Fairness Act. The legislation, introduced by Rep. Rosa DeLauro (D-Conn.), would strengthen the Equal Pay Act of 1963 and guarantee that women can challenge pay discrimination and hold their employers accountable. The legislation specifically requires employers to prove that pay disparities are based on factors other than sex; protects employees against retaliation for discussing salaries with colleagues; prohibits employers from seeking the salary history of prospective employees; removes obstacles in the Equal Pay Act of 1963 to allow workers to participate in class action lawsuits that challenge systematic pay discrimination; creates a negotiations and skills training program for women and girls; and improves the Department of Labor’s tools to enforce the Equal Pay Act of 1963.
Over fifty years ago, the Equal Pay Act of 1963 was enacted to prohibit pay discrimination on the basis of sex by requiring employers to pay women and men equally for equal work. Since the passage of the Equal Pay Act of 1963, millions of women have joined the workforce. However, more than five decades later, women are still earning less than their male counterparts. On average in 2018, women were paid 22.6 percent less than men, after controlling for race and ethnicity, education, age, and location. This gap is even larger for women of color with black and Hispanic women being paid 34.9 and 34.3 percent less per hour than white men, respectively—even after controlling for education, age, and location. Any way you slice it, women experience a gender pay gap.
There are many policies that can reduce gender pay gaps including raising the minimum wage, strengthening collective bargaining rights, and providing paid family and sick leave, among others. The passage of the Paycheck Fairness Act in the House is just one step toward reducing these gender pay gaps and guaranteeing women receive equal pay for equal work.
Why NAFTA’s 2.0 current labor provisions fall short
One year ago, we were hopeful that renegotiating NAFTA represented the first real opportunity in 25 years to finally rewrite the labor template currently relied on for trade agreements. After all, since NAFTA was implemented, hundreds of thousands of U.S. jobs have been outsourced to Mexico by companies taking advantage of workers who do not enjoy the fundamental human rights to form their own free and independent unions, engage in meaningful collective bargaining, be free from discrimination and forced labor, and work in safe and healthy workplaces.
In anticipation of the renegotiations, numerous recommendations for improving and enforcing labor standards were submitted—all of which are instrumental in removing corporate incentives to transfer work to Mexico. Specific recommendations for improving the labor template of current U.S. agreements included these five general suggestions:
- Incorporate explicit references to labor standards and interpretation of those standards through various cases and reports reflecting specific rules adopted by the UN’s International Labour Organization (ILO), including those concerning the freedom of association, collective bargaining, discrimination, forced labor, child labor, and workplace safety and health.
- Remove the footnote explicitly limiting the terms of the chapter to the ILO Declaration on Fundamental Principles and Rights at Work.
- Eliminate the requirement that labor violations under the agreement must be in a manner affecting trade or investment between the parties.
- Eliminate the requirement that labor violations must be sustained or recurring.
- Verify that labor standards in the agreement are being honored and enforced by the signatories prior to the agreement going into effect.
The search for America’s missing teachers
Our schools are not only temporarily without teachers because of teacher strikes for better working conditions and more investment in education. Some schools are chronically short of teachers: they can’t find teachers able and willing to work at current wages and conditions.
The estimated teacher shortage of about 110,000 teachers may seem small in a labor force of about 3.8 million. But its sudden appearance after years of teacher surpluses and its consequences are certainly a large cause for concern. Teacher shortages depress student performance, reduce teachers’ effectiveness, alter the cohesion of the school, and consume economic resources that could be better deployed elsewhere. These consequences also make it more difficult to build a solid reputation for teaching and to professionalize it, further perpetuating shortages. Finally, the teacher shortage reflects school districts’ failure to make the kinds of investments (in smaller class sizes, in resources to meet the needs of students, and in teacher development) that the expanding teacher protest movement seeks.
EPI has published the first in a series of reports that will document some of the reasons why the demand for teachers is outstripping the supply. In our report we argue that when issues such as teacher qualifications and equity across communities are taken into consideration, shortages are more concerning than we thought.
If we consider the declining share of teachers who hold the credentials associated with teacher quality and effective teaching (they are fully certified, took the standard route into teaching, have more than five years of experience, and they have an educational background in the subject they teach), the teacher shortage grows. If we compare the share of these teachers in high-needs schools (schools with a large share of students from families living in poverty) with other schools, we see that the shortages there are even more severe in those high-needs schools.
Teacher strikes blanket the nation as a labor of love meets economic hardships
School districts around the country, faced with a historic shortage of teachers, should be scrambling to offer those educators higher pay and better working conditions. That’s what the economics of supply and demand would dictate.
Instead, we are seeing a spread of teachers’ strikes and protests, with Denver and Oakland among the latest in a series of protest waves spreading from West Virginia to Los Angeles.
The gap between the estimated number of additional teachers needed in U.S. public school classrooms and the number that are available to be hired grew from zero to over 110,000 in just the last few years.
What gives? The lack of reaction from policymakers shaping the education landscape is emblematic of a broader disrespect for teachers as professionals over time. Teachers face a curious social situation—clearly and deeply needed but demonstrably undercompensated and poorly supported at work. The spate of recent strikes suggests conditions have reached a breaking point as teachers are forced to take on second and third jobs to make ends meet, and to spend money out of their own pockets to supply classrooms.
Our new analyses for EPI suggest that breaking point is here. This week, we released the first in a series of reports on the growing teacher shortage and the working conditions and other factors behind it. Our research shows that, when we account for the shrinking share of teachers who hold credentials associated with more effective teaching, especially in high-poverty schools, the teacher shortage is worse than estimated. The reports of the series will also show that low relative pay, tough working conditions, and a lack of supports for teachers aren’t isolated problems in a handful of districts but challenges being reported by teachers nationwide. The depth and breadth of the crisis shows that the education industry—i.e., the nation’s state and local departments and boards of education—urgently need to rethink how they cultivate, train, recruit, and support teachers.
Predicting wage growth with measures of labor market slack: It’s complicated

Josh Bivens, Director of Research
Why have wages grown so slowly in recent years despite relatively low unemployment rates? This puzzle has dominated economic commentary.
Figure A below, for example, shows a scatterplot of quarterly nominal wage growth (measured against the same quarter in the previous year) and unemployment rates since 2008. The trendline showing the relationship between these variables demonstrates it’s very weak—both statistically and economically insignificant.
Unemployment does not predict wage growth after 2007 : Unemployment rate and annual change in nominal wage growth, 2008–2018
| UR | NWC | |
|---|---|---|
| 2008-Q1 | 5.00% | 3.81% |
| 2008-Q2 | 5.33% | 3.65% |
| 2008-Q3 | 6.00% | 3.73% |
| 2008-Q4 | 6.87% | 3.88% |
| 2009-Q1 | 8.27% | 3.61% |
| 2009-Q2 | 9.30% | 3.10% |
| 2009-Q3 | 9.63% | 2.72% |
| 2009-Q4 | 9.93% | 2.62% |
| 2010-Q1 | 9.83% | 2.49% |
| 2010-Q2 | 9.63% | 2.50% |
| 2010-Q3 | 9.47% | 2.32% |
| 2010-Q4 | 9.50% | 2.20% |
| 2011-Q1 | 9.03% | 2.15% |
| 2011-Q2 | 9.07% | 2.09% |
| 2011-Q3 | 9.00% | 2.08% |
| 2011-Q4 | 8.63% | 1.82% |
| 2012-Q1 | 8.27% | 1.52% |
| 2012-Q2 | 8.20% | 1.55% |
| 2012-Q3 | 8.03% | 1.42% |
| 2012-Q4 | 7.80% | 1.45% |
| 2013-Q1 | 7.73% | 1.92% |
| 2013-Q2 | 7.53% | 1.90% |
| 2013-Q3 | 7.23% | 2.13% |
| 2013-Q4 | 6.93% | 2.32% |
| 2014-Q1 | 6.67% | 2.35% |
| 2014-Q2 | 6.20% | 2.39% |
| 2014-Q3 | 6.07% | 2.36% |
| 2014-Q4 | 5.70% | 2.13% |
| 2015-Q1 | 5.53% | 1.89% |
| 2015-Q2 | 5.43% | 2.06% |
| 2015-Q3 | 5.10% | 2.03% |
| 2015-Q4 | 5.03% | 2.33% |
| 2016-Q1 | 4.93% | 2.45% |
| 2016-Q2 | 4.90% | 2.45% |
| 2016-Q3 | 4.90% | 2.53% |
| 2016-Q4 | 4.77% | 2.42% |
| 2017-Q1 | 4.60% | 2.33% |
| 2017-Q2 | 4.37% | 2.30% |
| 2017-Q3 | 4.30% | 2.38% |
| 2017-Q4 | 4.13% | 2.33% |
| 2018-Q1 | 4.07% | 2.50% |
| 2018-Q2 | 3.90% | 2.71% |
| 2018-Q3 | 3.80% | 2.83% |
| 2018-Q4 | 3.80% | 3.25% |

Note: Data are quarterly, with nominal wage changes measured from the same quarter in the previous year.
Source: Unemployment rates are from the Bureau of Labor Statistics (BLS) Current Population Survey and wages are the average hourly earnings of production and nonsupervisory workers from the BLS Current Employment Statistics.
In this newsletter, I address a number of questions raised by this weak relationship between unemployment rates and wage growth since 2008. My key conclusions are:
- Since 2008, the share of adults between the ages of 25 and 54 who are employed (or the “prime-age EPOP”) has predicted wage growth better than the unemployment rate.
- But even the prime-age EPOP has done a poor job at predicting wage growth since 2008 compared with both its own predictive power pre-2008 and the predictive power of the unemployment rate in earlier periods.
- The prime-age EPOP’s advantage in predicting wage growth seems to have started even a bit before the Great Recession, around 2001.
- Because both the unemployment rate and the prime-age EPOP have seen a large reduction in their predictive power regarding wage growth since 2008, efforts to explain this decline in predictive power should involve looking to the unique features of the Great Recession: very high rates of unemployment combined with very low rates of inflation.
- While both the unemployment rate and the prime-age EPOP are likely to be fine statistical predictors of wage growth moving forward, there has been a steady decline in how responsive wage growth is to a given change in either. In short, workers have seemingly needed ever-tighter labor markets (measured by quantity-side variables like the unemployment rate and the prime-age EPOP) to generate a given amount of wage growth.
Higher returns on education can’t explain growing wage inequality
Steep and rising wage inequality is too often blamed on growing demand for workers with higher levels of educational attainment—the more schooling you have, the more you’ll be paid. But our research shows the rising gulf in pay has little to do with rising returns to education.
A prevalent story explains wage inequality as a simple consequence of growing employer demand for skills and education—often thought to be driven by advances in technology. According to this explanation, because there is a shortage of college-educated workers, the wage gap between those with and without college degrees is widening. The expected boost to workers’ pay from a four-year college degree is known as the “college premium.”
Despite its great popularity and intuitive appeal, this story about recent wage trends driven more and more by a race between education and technology does not fit the facts well, especially since the mid-1990s. The growing inequality of note is that between the top (or very top) and everyone else. The pulling away of the very top cannot be explained by education differences, but rather the escalation of executive and financial sector pay.
Even when looking at the relative changes in the 95th percentile of wage earners compared to the 50th percentile of wage earners, and comparing that gap with the college wage premium from 2000 to 2018, it is clear that gains in the college wage premium have been very modest and far less than the continued steady growth of the 95/50 wage gap. Therefore, it is highly implausible that the growth of unmet employer needs for college graduates has driven wage inequality.
The evidence suggests the demand for college graduates has grown far less in the period since the mid-1990s than it did before then. This is difficult to square with contentions that automation or changes in the types of skills employers require have been more rapid in the 2000s than in earlier decades. Rather, automation has been slower in the recent period than in earlier decades as seen in the pace of productivity, capital, information equipment, and software investment—and in the speed of changes in occupational employment patterns.
A close look at recent increases in the black unemployment rate
Everything from weather to furloughs made it hard to draw any major conclusions from this month’s employment report, but one recent worrisome trend persisted—a continued increase in unemployment for black workers.
The Labor Department’s February employment report showed job growth effectively stalled last month, rising just 20,000. That was much lower than anticipated and substantially weaker than the prevailing trend of the last few years. The average over the last three months came in at a more solid 186,000, likely a better reflection of underlying trends, given the unusually harsh weather in February. At the same time, wages grew 3.4 percent over the year, the highest so far in the economic recovery from the Great Recession.
Turning to the separate household survey, the unemployment rate ticked down to 3.8 percent, while the labor force participation rate and the employment-to-population ratio (EPOP) held steady. The overall unemployment rate has sat at or below 4.0 percent for the last 12 months, averaging 3.9 percent over the year. The black unemployment rate, on the other hand, averaged 6.4 percent over the last year and has been increasing in recent months. For comparison, white unemployment tracked the drop in overall unemployment in February and has averaged 3.4 percent over the last year.
What to Watch on Jobs Day: Stronger wage growth as prime-age labor force participation continues to climb
Wage growth has continued to be the number one indicator to track in the monthly jobs report. Nominal wage growth has been slowly climbing over the last several months. Over the last three months, year-over-year wage growth averaged 3.3 percent, up from 3.2 percent the prior three months, and 2.8 percent the six months before that. Wage growth has still yet to reach levels fast enough—and for long enough—to reach full employment and restore labor’s share of corporate-sector income. At the pace of growth we’ve seen in recent months, however, I’m optimistic that the economy will continue on track toward genuine full employment.
One of the reasons I’m optimistic is that more and more workers are returning to the labor force. And, the vast majority of the newly employed are coming from out of the labor force, so lots of those workers who have (re)entered the labor force are getting jobs. I’m unconcerned by the slight increase in the unemployment rate over the last couple of months. The unemployment rate has sat at or below 4.0 percent for nearly a year. As the labor force participation rate continues to recover, the unemployment rate may rise, but those increases will be for the right reasons as more workers grow optimistic about their chances in the labor market.
In the figures below, I take a closer look at the labor force participation rate and the share of the population with a job. I’m going to focus on trends in the prime-age population, with attention to 25- to 54-year-olds to remove any possible confounding factors due to retiring baby boomers at the top end or longer years of schooling at the bottom end. The figure below shows the prime-age labor force participation rate (LFPR) in blue and the prime-age employment-to-population ratio (EPOP) in green. The prime-age LFPR is the share of the prime-age population either with a job (employed) or actively looking for work (unemployed). The prime-age EPOP is the share of the prime-age population with a job (employed). The denominator is the prime-age population for both lines and the space in between can be roughly thought of as the unemployment rate. (Technically, the unemployment rate is 1 – EPOP/LFPR and the space between the lines is the number of unemployed people as a share of the population, but they track each other well.)