Full Report
Glossary of acronyms and initialisms
BEV: Battery electric vehicle
CHIPS: CHIPS and Science Act of 2022
EV: Electric vehicle
FCEV: Full cell electric vehicle
ICE: Internal combustion engine
IRA: Inflation Reduction Act of 2022
MHDV: Medium- and heavy-duty vehicles, inclusive of Classes 4–8 trucks and buses
NAFTA: North American Free Trade Agreement of 1994
USMCA: United States-Mexico-Canada Agreement of 2020

This is a joint project with the BlueGreen Alliance.
This is a joint project with the BlueGreen Alliance.
Medium- and heavy-duty vehicles—big trucks and buses—are a backbone of economic life in the United States. Transitioning these vehicles from internal combustion engines (ICE) to low- and no-emission technologies is a critical step for eliminating greenhouse gas and other toxic emissions from the transportation economy. At the same time, this transition could have serious implications for the ICE vehicle manufacturing industry and auto workers.
The auto manufacturing industry was once a dependable source of good, union jobs capable of sustaining middle-class communities—particularly for workers without a four-year university degree. But these jobs have deteriorated in quantity and quality thanks to decades of corporate outsourcing and union-busting; bad trade policies; rising foreign competition; and short-sighted corporate governance strategies which caused the 2008 automotive industry crisis.1
Combined, these factors created a generation-long drain of jobs from U.S. motor vehicle industries, applying unrelenting downward pressure on the quality of jobs that remained with predictable reverberations to local economies that have borne the brunt of industry restructuring.2 After 2008, average wages in the industry fell sharply while corporate profits, executive compensation, and stock buybacks soared and crowded out investment in the technologies, manufacturing capacity, and workforce development to compete for the clean vehicle future.
Now that future is upon us. If done right, the transition to manufacturing clean trucks and buses presents a rare opportunity to reverse these trends and revitalize long-beleaguered industries to expand investment, create jobs, and raise incomes in the United States. If done wrong, the transition risks exacerbating the current trends that see companies moving production offshore or to U.S. states embracing anti-worker policies, threatening the security of the good jobs that remain.
This report assesses the potential impacts of a transition on employment, output, and labor incomes in clean truck and bus manufacturing supply chains by modeling a range of policy scenarios from 2024–2032 to understand what is required to secure a just transition for legacy auto workers and new entrants to the workforce. Our analysis shows that a just transition, broadly, must target three things:
- Maintaining a strong public commitment to low and no-emission vehicle transition, including supply-side and demand-side measures to overcome endemic market failures in the development and deployment of new clean vehicle technologies.
- Increasing the domestic market share and domestic content share for clean vehicle components in made-in-America trucks and buses by tackling the problems of bad trade policies and strongly tying financial incentives to domestic content requirements.
- Ensuring that newly created jobs are good jobs with program requirements for companies receiving financial incentives to make them good jobs; penalties and clawbacks for companies that fail to meet their commitments; and prohibitions from participating in programs for companies that can’t show “clean hands” with the National Labor Relations Board (NLRB), the Internal Revenue Service, and other relevant regulatory bodies.
The transition toward clean trucks and buses began in earnest under the Biden-Harris administration, with the 2021 Infrastructure Investment and Jobs Act, 2022 Inflation Reduction Act (IRA), and 2022 CHIPS and Science Act making big strides towards the first target. Together, this legislation allocated billions of dollars toward supporting manufacturers to make low- and no-emission heavy-duty vehicles and components, supporting owners of public and private fleets to purchase them, and building charging infrastructure to power them.3 While the Biden-Harris administration sought to attach highroad labor and domestic content standards to the tax incentives, grants, and no-interest loans to promote clean vehicles, these fell by the wayside in legislative horse-trading needed to pass the U.S. Senate.4 As a result, the law provides policymakers little leverage to hold recipients of billions of subsidies accountable, significant shares of which are flowing to companies that do not meet domestic content requirements or are expanding investments in states with anti-worker policies, undercutting goals two and three.
Now, the Trump administration is moving to drastically reorient the federal policy approach to clean vehicles by freezing disbursement of support for clean vehicle manufacturing provided by the Inflation Reduction Act and other legislation.5 This would rob the resources necessary to incentivize rapid development of domestic clean vehicle manufacturing capacity at a time when consumer demand is shifting away from ICE vehicles.6 And although President Trump took some major actions on trade in his first administration, these failed to reverse the long-term decline in motor vehicle manufacturing jobs and communities, or to advance worker rights more broadly:
- Though pledging to fix the North American Free Trade Agreement (NAFTA), Trump’s United States-Mexico-Canada Agreement (USMCA) left in the fundamental flaws that allow multinational corporations to shift production to low-cost, low-standard locations and create loopholes to import foreign content into North American supply chains. Both bolster employers’ credible threats of outsourcing or closing plants to suppress wage demands from workers in U.S. (and Canadian) manufacturing facilities.
- USMCA’s leakage problem—allowing non-USMCA content to count as being “Made in North America” in qualifying for lower tariffs—undercuts U.S. and North American workers by pitting them in competition against non-USMCA producers with lower labor, environmental, and consumer safety standards and without extending reciprocal market access to similar U.S.-based producers. Under USMCA rules, such content can even qualify for U.S. taxpayer subsidies under IRA policies.
- Since USMCA was signed into law, wages for American motor vehicle production workers have fallen more than 7%, after inflation. Meanwhile, U.S. imports from Mexico of medium- and heavy-duty trucks increased 500% and imports of motor vehicle parts increased 150%.
- Overall employment in motor vehicles and parts lost nearly 8,000 jobs in the first Trump administration. And the significant geographic churning of domestic employment toward lower-wage, non-union jobs in Southern U.S. states contributed to the decline in quality of the remaining jobs in the sector.7
- Looking forward, state-supported Chinese electric vehicle (EV) producers are positioning to exploit loopholes Trump left in USMCA that enable them to penetrate North American motor vehicle supply chains at the same preferential tariff rates as North-American-based producers, without having to compete under reciprocal opening in their home market. By routing through Mexico, Chinese producers will be able to circumvent the 60% blanket tariff President Trump proposed.
- Trump appointees to the NLRB led unprecedented attacks on workers’ rights, overturning long-established precedents, and empowering employers over workers at every turn.8
- In 2023, then-candidate Trump voiced criticisms of striking auto workers and avoided their picket lines in favor of speaking to workers at a non-union factory.9
- Trump and Tesla, Inc. CEO Elon Musk, the world’s largest EV-maker and one of just a handful of e-truck makers, are vocally anti-union, which suggests a Musk-influenced vehicles policy will not prioritize job quality.10 Moreover, Musk has not been shy about advocating for policies that will benefit his company and harm his competitors, even though these policies would be net negative for the US vehicles manufacturing sector as a whole.
Our modeling results show that eliminating financial support and domestic production incentives would fail to meet the three criteria for a clean vehicle transition and result in the worst possible outcome for industry workers and their communities. Not only will current producers fail to seize opportunities to develop new clean vehicle business—making U.S. truck consumers increasingly dependent on foreign technology leadership—but they will also face increasing cost pressures and a declining market share for ICE vehicles at the same time, giving an opportunity for new and foreign clean vehicle manufacturers to leapfrog incumbent domestic producers.
The real way to achieve a just transition to manufacturing clean vehicles is to expand the domestic content and market share for medium- and heavy-duty vehicles produced in the United States, while leveraging substantial public investments to raise job quality across the industry. After surveying the landscape for jobs in the U.S. truck and bus manufacturing industries, the report presents and compares analyses of potential economic futures under varying transition policy scenarios. We conclude with an overview of the policies needed to achieve a just transition in U.S. truck manufacturing—and looming over all these will be the deadline for the United States and partners to reauthorize USMCA in 2026, and a potential opportunity to fix some of these problems.
Summary findings
- U.S. truck and bus producers face intensifying competition from lower-wage countries, subsidized imports, and corporate offshoring. In 2023, the U.S. imported more than 14 times as many trucks and buses (342,000 units) as in 2007—11,100 units more than produced domestically, with nearly 90% of imports from Mexico.11
- Employers continue issuing credible threats to shutdown factories and relocate production in order to suppress wage demands at home, made possible by the rapidly deteriorating trade position under USMCA. Since 2020, major employers in truck supply chains—like Volvo Group’s Mack Trucks, Daimler Trucks, and Stellantis—have made threats to their workers, announced plans to move production offshore, or implemented relocation plans.12
- State-supported Chinese clean vehicle and component producers are positioning to exploit gaping loopholes left in USMCA motor vehicle content rules going forward. Overall, the Chinese foreign direct investment (FDI) foothold in Mexico grew more than 560% since 2016 and imports of core Chinese-made parts to Mexico, like chassis with engines and bodies and cabs, increased by 132 times and 670 times, respectively, since the start of the 2009 business cycle expansion. This loophole is not just open to Chinese producers. And while we have yet to see importation of complete, Chinese-made trucks or buses from Mexico, U.S. policymakers should anticipate such a probabilistic future scenario and take steps to offset the effects of bad trade policies and market-distorting Chinese-government subsidies.
- Eliminating support for clean energy vehicles would undermine domestic manufacturing industries. Revoking the IRA and related policies would kill support for manufacturing clean energy vehicles and components—stranding $145 billion in new investments and costing more than 35,000 job-years (a quantity requiring one person’s work over one year) in truck assembly and parts manufacturing of ICE and clean vehicles. In total, nearly half a million fewer clean energy trucks and buses would be produced domestically through 2032.13 This would also likely mean loss of market share for domestic content components in diesel gasoline-powered trucks and buses because legacy producers not benefitting from the clean vehicle transition will face deteriorating economies of scale in ICE vehicle production.
- For a just transition, clean energy trucks and buses must be built in the U.S. with good union jobs. Relative to current market expectations, building on current policies to better incentivize investments in domestic production and high-quality jobs could yield an additional 172,000 job-years, building at least 477,000 more clean energy trucks and buses at union wages in the United States through 2032.
- Most of these jobs (79%) would not require a college degree, and with union representation, these workers can earn middle-class wages and comprehensive benefits.
- Better wages for manufacturing workers mean better economic outcomes. Contrary to what many companies claim, it is possible to pay workers good, union wages and provide them benefits while transitioning production lines to clean trucks. We find that widespread unionization with policies to onshore truck and bus manufacturing would increase output and wages throughout the domestic supply chain by $85.9 billion and $28.8 billion, respectively. Building more trucks and buses with more workers is good for workers, good for the communities where these high-quality jobs are located, and good for the environment.
Why we wrote this
Medium- and heavy-duty vehicles are a backbone of economic life, transporting the goods, services, and people working in our economy.14 With 23 million vehicles on the road driving 430 billion miles annually, these trucks and buses serve as essential links in the chains that deliver the goods and services to people and businesses, propelling economic activity.15 Motor vehicle manufacturing employment more broadly is a critical driver of overall economic activity in the United States: Each job in the industry supports 10 additional jobs and three times the output throughout the rest of the economy.16
But the prevalence of big trucks and buses throughout the economy also carries substantial environmental—and, as a result, economic and public health—consequences. In the United States, the transportation sector is the single largest source of greenhouse gas emissions, with trucks and buses accounting for about one-fourth of those emissions, despite being just 6% of the vehicles on the road.17 Beyond global climate effects, localized air pollution from the transportation sector comes with substantial economic costs that go beyond individual health outcomes—costs borne disproportionately by the 120 million people living in low-income communities and communities of color, often in marginalized proximity to concentrated sources of emissions.18 Such chronic and pervasive exposure to toxic emissions carries macroeconomic implications for human capital accumulation and long-term productivity growth.19
Tailpipe emissions from trucks and buses account for one-fourth of total transportation emissions, in turn one-fourth of U.S. emissions from all sources, and have grown 2.2% annually, on average, since 2000.20 And the consequences for our looming climate crisis are driving an unprecedented global transition to electrify transportation—the eventual replacement of fossil fuel-powered vehicles with no-emission vehicles powered by onboard rechargeable batteries or fuel cell systems that convert hydrogen gas to electricity.21 That’s why 36 countries, including the United States, have pledged to reach 100% clean truck and bus sales by 2040, along with subnational entities like California, New York City, and a wide range of manufacturers and suppliers, fleet owners and operators, utility and infrastructure providers, and private capital investors.22
Achieving this transition will require further development of a wide range of technologies. Innovations will be required for producing the different component parts necessary for electrified vehicles, as well as for the development and installation of information technologies and capital equipment needed to manufacture those components at scale. What’s more, success will require equally ambitious and complementary investments to upgrade and expand renewable energy supply chains on which clean vehicle operations will rely—generation, storage, transmission, and distribution to end users. The challenges of clean vehicle industry development are too complex for traditional policy silos and will require policymakers to take a coordinated approach to industrial policy in order to achieve a just transition.
The stakes of failing to achieve a just transition are high given rising competition to control markets for medium- and heavy-duty vehicle manufacturing. Already, Trump’s USMCA continues NAFTA’s drain of jobs and employers’ ability to suppress worker demands with threats of relocation. But the international competitive environment is shifting and poised to disrupt U.S. markets with vehicles produced in USMCA countries but supplied by a rapidly growing overseas network of Chinese parts producers exporting market-distorting subsidized products to the United States. Without additional policy actions, the U.S. risks experiencing another “China shock”-level event, which decimated manufacturing communities across the country, focused on the broader motor vehicle manufacturing industry.23 This will mean loss of jobs and downward pressure on wages and standards in the jobs that remain, leaving U.S. labor markets and transportation supply chains exposed to risks of international disruption.
Achieving a just transition entails a significant public sector role to manage the transition: creating demand for new investments; retooling legacy internal combustion engine production facilities and training the workforce to produce the clean vehicle goods of the future; striking the right balance in foreign trade; and providing financial bridges to small and medium employers who will face less favorable access to capital markets and steeper challenges in navigating the transition. Failing to pursue a robust and comprehensive clean vehicle agenda is likely to leave workers and the industry’s small and medium enterprises in the lurch.
Sharpening international competition for and offshoring of truck and bus manufacturing
Natural barriers to trade due to the size and weight of MHDVs, as well as the importance of proximity to consumers demanding high degrees of customization, have long insulated U.S. truck and bus manufacturing industries from more intense trade competition—although parts producers in the supply chain have certainly not been immune to pressures from outsourcing and offshoring, with subsidized foreign steel and aluminum content taking a heavy toll. But now international competition is sharpening as the world races toward a transition to clean vehicles, and Chinese producers have begun establishing manufacturing footprints for homegrown Chinese firms and hallmark brands around the world.24 Supported by wide-ranging government subsidies and lax labor, environmental, and consumer protection regulations, a growing new presence of Chinese state-supported motor vehicle manufacturing on America’s doorstep portends a critical challenge to U.S. producers.
President Trump made trade competition a signature economic policy of his first term, although outcomes from his agenda largely failed to address these challenges.25 While Trump created an opportunity to renegotiate NAFTA, an agreement that had long plagued U.S. motor vehicle and parts workers, its replacement failed to rebalance trade or to address NAFTA’s fatal flaws that empower multinational producers to threaten and actually relocate work to lower-wage and more readily exploitable places like Mexico. Rules designed to promote North American production set too low a threshold for determining what counts as North American content to qualify for duty-free treatment in North American trade were not designed to effectively incentivize use of higher-wage local content in manufacturing vehicles.26
Tariffs Trump imposed in his first term aimed to tackle the challenge of state-supported exports of Chinese technology goods, including many categories of motor vehicle parts. Separate global tariffs on steel and aluminum products bound on Chinese exporters, who have upended global markets with strong state support.27 But the main effect was not to deter imports from Chinese-oriented motor vehicle supply-chains, but to divert their production to third countries subject to more favorable tariff treatment by the United States. A surge of outbound Chinese FDI and exports of manufacturing equipment followed, accompanied by surging U.S. imports of motor vehicle parts from countries where Chinese producers expanded their offshore export platforms, including Mexico, Thailand, India, Indonesia, Malaysia, the Philippines, and Vietnam.28 In Mexico, nearly one-fourth of Chinese FDI in late 2023 flowed to the auto industry.29
Figure A illustrates this rising import competition in trucks and buses in recent years, most notably the sharp growth in imports from Mexico, particularly after USMCA.30 In 2007, prior to the Great Financial Crisis and the 2008 U.S. auto industry crisis, the U.S. imported a mere 24,000 MHDVs (less than 10% of U.S. production) with two-thirds of these imports coming from Canada.31 Following the economic recovery after 2009, increasing truck and bus production in Mexico largely displaced Canadian production to serve an expanding share of the U.S. market. Amid this race to the bottom, truck and bus imports from Mexico grew to nearly 98,000 units by 2019—92% of total truck and bus imports—with imports from Canada amounting to less than 6% of total imports, and those from the rest of the world amounting to less than 3%. In total, imports grew to represent 31% of U.S. MHDV production.
By 2023, the United States imported more than 342,000 trucks and buses—88% from Mexico, or 11,100 more units than were produced domestically. This dramatic shift largely reflects growing outsourcing and migration of traditional U.S. producers to Mexico. This dynamic may be poised to change in coming years as a result of the increasing penetration of Chinese manufacturing foreign direct investment in Mexico seeking sidestep U.S. trade enforcement measures.32 With an early start and heavy subsidization under the 2013 “Made in China 2025” policy, China has become the world’s largest producer of and market for clean energy vehicles, and established supply chain dominance in critical clean vehicle components, particularly in the minerals, anodes, cathodes, and cells that go into storage batteries.33
Medium- and heavy-duty vehicle imports more than tripled since 2019: U.S. truck and bus imports from Mexico, Canada, countries #3–10, and the rest of the world, various years 2007–2023
| Mexico | Canada | Countries #3–10 | Rest of world | |
|---|---|---|---|---|
| 2007 | 5,664 | 15,824 | 2,274 | 388 |
| 2011 | 52,150 | 3,032 | 582 | 127 |
| 2015 | 86,799 | 4,601 | 888 | 72 |
| 2019 | 97,501 | 6,066 | 2,946 | 93 |
| 2023 | 300,251 | 36,396 | 5,666 | 85 |

Source: EPI analysis of DataWeb data. Countries #3–10 include Germany, South Korea, Belgium, North Macedonia, Japan, China, Turkey, and the United Kingdom.
Facing U.S. tariffs on a wide range of manufactured and technology goods and steel and aluminum products, as well as broader trade policy efforts to uphold U.S. steel and aluminum producers, Chinese firms began shifting production chains toward countries with more favorable tariff treatment. From 2018 to 2022, Chinese firms increased their direct investments in Mexico by 126%, and their exports of manufacturing equipment to Mexico increased 134% over their pre-tariff level.34 Chinese outbound investment and export of manufacturing machinery show a similar pattern with countries that have shown surging motor vehicle parts exports to the U.S. in the years following 2018 tariffs: Thailand, India, Vietnam, Malaysia, and Indonesia, among others.35 This is less an example of trade diversion (changing trade partners to the next lowest-cost country) than of production diversion—rerouting production in Chinese supply chains through third countries to gain preferential access to U.S. markets. And the most preferred access comes through USMCA partners Mexico and Canada.
A misguided USMCA panel ruling in December 2022 already undercut stronger “rules of origin”—i.e., measures to ensure that imports receiving the best access to North American markets are made with significant North American-originating (“regional value”) content, by workers earning decent wages—in the renegotiated agreement. This ruling enables substantial non-North American content to enter North American motor vehicle supply chains in vehicles that qualify for duty-free entry to U.S. markets. The more complicated an intermediate part is (i.e., the more it incorporates lower-tier components), the more foreign content can masquerade as being “Made in North America.”
USMCA was negotiated prior to policy and industry commitments to the clean vehicle transition, leaving key components and technologies inadequately addressed in existing USMCA rules of origin. The leakage to non-USMCA content undercuts U.S. and North American workers by pitting them against foreign producers operating without the same commitments to worker, environmental, and consumer safety standards—and without similarly extending reciprocal market access to U.S.-based producers. What’s more, this subterranean content can qualify for clean vehicle tax credits subsidized by U.S. taxpayers under the IRA.
Chinese clean energy vehicle and parts manufacturers are poised to exploit this foothold into USMCA markets. Already, the United States is facing surging motor vehicle parts imports from countries where Chinese producers are expanding investments in manufacturing, but complete Chinese-branded vehicles produced in Mexico are not far behind with potential for severe disruption of established producers.36 And the United States is not the only country facing risks from surging, subsidized Chinese vehicle and part imports. Following a nearly year-long investigation into Chinese electric vehicle subsidies, the European Union levied countervailing tariffs of up to 45.3% on imported Chinese vehicles.37
The case of Chinese company BYD is instructive. From an upstart mobile phone battery company that manufactured its first car in 2005, BYD is now the world’s largest EV manufacturer and the world’s second largest EV battery producer.38 BYD is already a manufacturer of battery electric vehicle (BEV) school buses in Canada and school, coach, and transit buses in the United States. These projects began with promising community engagement and $39 million in taxpayer funds but devolved into recriminations of broken promises over the number and quality of jobs created and community benefits delivered.39 A range of BYD battery electric Class 6 and Class 8 trucks are already available in the U.S. market—more models than any other clean energy vehicle manufacturer is offering.40
BYD’s current dominance in the market for light passenger vehicles should serve as a harbinger of the potential for the company—among others benefitting from direct and indirect Chinese government support—to undercut U.S. and global markets for trucks and buses as well. Analysis released by industry benchmarking firm A2Mac1 shows that BYD markets essentially the same battery electric car (the Dolphin) in both the Chinese and European Union markets, but what retails for around $14,000–$15,000 in China is priced at $33,000–$35,000 in Europe—in line with the lowest priced BEVs in the market.41 Even after accounting for slight modifications to the vehicle to comply with higher European safety standards, taxes, and transportation costs, A2Mac1’s piece-by-piece teardown of the vehicles in the two markets finds that BYD is earning roughly $7,400 in profit on each unit sold in the EU.
These super profits owe to BYD’s unparalleled low costs of production, only made possible by a complex set of complementary Chinese government policies. To be certain, BYD has produced a number of cutting-edge product and process innovations that have made the company a technological leader, but they have done so with the benefit of robust and comprehensive industrial policies providing favorable access to credit and land; tax and regulatory forbearance; investments in critical mineral development and refining; investments in workforce development; demand-side policies providing consumer incentives and charging infrastructure; and suppression of worker rights, health, and safety concerns.
At present, BYD is content to reap these profits rather than upend market structures with price wars that are now squeezing other electric vehicle manufacturers.42 Insulated from the same kind of financial market pressures to return short-term profits to investors faced by peer companies in the United States, BYD can instead expand on their competitive lead by returning those earnings to investment in developing new technologies and markets for their products.43 But the mere realization of such super profits signals to competitors BYD’s ability to wage a decisive price war, which is certain to deter future investments by others or potential new entrants in the market for clean energy vehicles without a change to the market dynamic.
The situation for clean trucks and buses will be no different. Without additional policy actions to ensure development of viable domestic clean vehicle manufacturing, increasing permeation of BYD and other Chinese motor vehicle assembly and parts firms in Mexican manufacturing with potential preferential access to U.S. markets through USMCA is set to sharply disrupt U.S. truck and bus (and light-duty vehicle) manufacturing.
Assessing the jobs and economic impact of battery electric (and fuel cell electric) trucks and buses
Our modeling analysis focuses on how U.S. industry employment and output in truck and bus manufacturing and supply chain industries would be impacted by strengthening or curtailing policies intended to promote onshoring of domestic clean vehicle manufacturing, high-quality union jobs, and financial support for infant clean vehicle industries. We use the IMPLAN input-output model to assess the impacts of a shift from manufacturing diesel trucks and buses to ones with battery electric or fuel cell electric powertrains and a range of policy scenarios over the medium-term outlook from 2024–2032. Input-output models divide the economy into constituent industries and trace the complex interdependencies between them—546 discrete industries in IMPLAN’s case.44
In this report, we limit our consideration to impacts on the truck and bus assembly industry and the business-to-business purchases of inputs required for manufacturing of final vehicles, and so on down the supply chain. This excludes so-called “induced effects” on the macroeconomy created when workers directly engaged in truck and bus supply chains spend their incomes, which can—statistically speaking—suffer from aggregation bias in such analysis.
We take S&P Global Mobility’s Medium- and Heavy-Commercial Vehicle Forecast as the baseline scenario for our analysis against which to measure impacts of potential policy changes.45 S&P Global Mobility surveys market participants and producers; their database covers more than 95% of global MHDV production at the plant and vehicle model level for medium- and heavy-duty trucks and buses (Class 4–8 vehicles), a representation of which is pictured in Table 1.46 In total, S&P Global projects U.S. production of nearly 3.9 million MHDVs from 2024–2032, including nearly 600,000 battery electric vehicles and 115,000 full cell electric vehicles (FCEVs). Under current expectations and market and policy conditions, S&P Global projects that by 2032, 28% of U.S. heavy truck production will be clean vehicles and 42% of medium-duty trucks and buses will be clean energy-powered.47
Vehicle model-level breakdown for trucks and buses
| Vehicle types | Description | Examples | |
|---|---|---|---|
| Medium-duty
(Classes 4–6) |
Gross vehicle weight ratings (GVWRs): 14,001–26,000 lbs | Box, delivery, utility, and construction trucks |  |
| Heavy-duty
(Classes 7–8) |
GVWR: >26,001 lbs | The largest trucks, day cabs and sleeper tractor trailers, garbage and cement trucks, fire engines |  |
| Coach bus
(Classes 7–8/ Type A) |
Passenger vehicle with GVWR: >26,001 lbs |  |
|
| Transit bus (Class 7) | Conventional or articulating local public transportation |  |
|
| School bus (Class 6/Types A–D) |  |
BEVs and FCEVs are too new to receive unique treatment in the IMPLAN model’s array of industries. Therefore, first we must estimate the requisite component inputs for these new manufacturing industries. This goes well beyond just the different powertrains propelling the trucks and buses forward—batteries, motors, and fuel cell systems. E-drive systems in both battery electric vehicles and full cell electric vehicles necessitate redesigning chassis to accommodate battery and electrical systems. Essential functions powered by the burn of a diesel engine like power-steering and power-braking, cabin and cargo HVAC, and thermal management all need to be adapted to high-voltage electrical systems. Upgraded tires are needed to handle additional torque at the wheel from e-drive and regenerative braking. All of this requires using substantially more semiconductors and related content than are found in a clean energy vehicle’s diesel counterpart.
Technological advances in recent years, in tandem with increased investments to meet growing consumer demand for clean vehicles, will bring light-duty BEVs to cost parity with diesel vehicles—even before accounting for current IRA consumer tax incentives—and medium- and heavy-duty clean energy vehicles are not far behind.48 Industry executives regularly claim that BEVs will require 30–40% less labor content than diesel internal combustion engine vehicles.49 Auto executives certainly should have inside information on the production engineering process, but they also have incentives to mislead shareholders (about the potential costs of the transition) and workers (in order to suppress wage demands).
However, independent engineering data do not bear out this reduction in labor content required for clean vehicle production, suggesting that EVs should be expected to embody more labor content than ICE vehicles.50 As a result, it is reasonable and conservative to treat the labor content of ICE and BEV vehicles to be roughly equivalent. Still, such technical engineering analysis leaves open the questions of where and under what conditions those alternative powertrain components will be developed and produced.
Beginning with IMPLAN’s model for ICE heavy-duty vehicle manufacturing, we adjust the contributions of various motor vehicle input industries to substitute costs for components that will replace existing diesel parts. The International Council on Clean Transportation and Ricardo, Plc., a private motor vehicle industry consulting group, provide a teardown analysis identifying cost breakdowns for clean energy components relative to other costs of a complete vehicle, as well as future cost trajectories, as technologies and manufacturing economies of scale improve in the near term.51 Replacing—or, in some cases, supplementing—industry inputs to diesel truck and bus manufacturing with content for low- and no-emission vehicles and scaling overall costs to 100% allow us to create new clean energy vehicle industries that can be modeled within IMPLAN. Thus, we can jointly model the impacts of projected U.S. trucks and buses production for nine discrete groups of vehicles: medium- and heavy-duty trucks and buses produced with diesel, battery electric, and fuel cell electric powertrains.
The baseline S&P Global forecast embodies the current policy environment under Biden-Harris administration policies, as well as market expectations for truck and bus, consumer preferences for drivetrains, and the landscape of international competition within motor vehicle supply chains. We then vary these assumptions in a variety of scenarios to test the impacts of different possible directions for U.S. clean energy vehicle manufacturing policy on employment and output:52
- 50% clean truck and bus adoption: The U.S. has joined a group of 36 nations pledging 100% of new sales will be clean trucks and buses by 2040.53 Given the rapidly converging cost differences and expected lower total cost of operation for clean energy vehicles, as well as private sector commitments to decarbonize and reduce operational costs, we consider an intermediate scenario where adoption of electrified trucks and buses may outpace S&P Global projections.54 Here, we assume that U.S. output of clean trucks and buses reaches 50% of the total by 2032—with increased production primarily coming from more BEVs—as opposed to the 28% for heavy-duty trucks and 42% for medium-duty trucks and buses currently predicted by S&P.
- Baseline + increased domestic market share: Unlike the IRA’s Section 30D light-duty clean vehicle tax credits, clean commercial vehicles qualifying for up to $40,000 each under Section 45W do not come with the same requirements for North American assembly or for critical mineral and battery components. To test the potential impact of policies incentivizing increased domestic production of complete trucks and buses and parts, we assume a 10% increase in U.S. production with a doubling of U.S.-originating content in storage battery production.
- 50% clean trucks and buses + increased domestic market share: This scenario applies the assumption of increased domestic market share in the second scenario with the assumption of more rapid end-user clean vehicle adoption.
- Scenario 3 + widespread unionization. As discussed above, policies supporting the development of clean energy truck and bus manufacturing industries eschewed requirements that public resources be used to support good jobs. Although political compromise necessary to pass legislation stripped motor vehicle manufacturing workers of labor protections extended to construction work, there are a variety of policy options available that can ensure public resources are being used to support good jobs and not just corporate profits. To test this scenario, we adjust total labor income in the truck and bus manufacturing industry to a union-equivalent rate, based on the current union-wage premium and industry unionization rate, while holding employment constant.
- Trump’s likely approach: retreat from the clean vehicle transition. Despite the pressures from ballooning greenhouse gases and other toxic emissions from trucks and buses and the rapid expansion of private investment into U.S. clean vehicle manufacturing, not a single Republican official supported IRA legislation. Now, many have pledged to undo public policies supporting this green transition—President Trump, Sen. John Barasso, Sen. Shelly Moore Capito, Rep. Cathy McMorris Rodgers—and at least nine Republican-sponsored bills would repeal or rescind IRA programs.55 In this scenario, we assume the loss of support for investment in domestic manufacturing cuts the domestic content shares of key clean vehicle components by as much as one-half, while loss of demand-side tax credits for MHDV purchases and declining production efficiencies at lower-scale operations cut U.S. clean vehicle production to one-fourth of the S&P Global baseline. Disruption and uncertainty from the policy reversal make consumers less likely to choose low- and no-emission powertrains over diesel trucks and buses, and those opting for clean vehicles are more likely to be supplied by foreign manufacturers or by domestic manufacturers using significantly higher foreign parts.
Results
Figures B–D present visualizations of our topline modeling results for employment, labor income, and economic output impacts, respectively, relative to the S&P Global baseline scenario. When interpreting these results as a whole, it is important to keep in mind that truck manufacturing is an unusually high capital-intensive activity, where a relatively small number of workers can produce large value of output. In Scenario 1, where we assume faster than expected adoption of clean trucks and buses (50% of the market by 2032), employment in truck and bus manufacturing would increase by more than 31,000 job-years while employment in truck and bus supply chain industries would increase by more than 93,000 job-years. Combined, a more rapid expansion of clean truck and bus adoption in the U.S. market would support nearly 125,000 more job-years of work in motor vehicle and parts manufacturing than the status quo. As a group, these workers will earn $11.2 billion over this time. Reaching 50% clean truck and bus adoption by 2032 will mean an additional $61 billion in economic activity in U.S. motor vehicle and parts industries.
Even if the path of clean energy vehicle adoption remains the same through 2032, policies that work to increase the onshore manufacturing and domestic content of U.S. trucks and buses and parts (Scenario 2)—resulting in more domestic manufacturing activity for the same quantity of vehicles—will also improve the situation of workers and businesses in the industry. Increasing market share for U.S. medium- and heavy-duty motor vehicle and parts manufacturing is a boon for workers in the industry, supporting a total of more than 148,000 additional job-years—more than 33,000 in vehicle manufacturing and 115,000 in supply chains, earning an additional $13.3 billion. In total, output in the industry is expected to increase $72 billion by 2032, relative to S&P Global’s baseline scenario.
With an increased clean vehicle share and increased domestic market share separately improving employment and output prospects for truck and bus manufacturing and parts, it should be no surprise that combining the effects (Scenario 3) yields even more positive results. In this scenario, higher demand for clean trucks and buses combined with greater U.S. production capacity translates into more work and more GDP incentivized by green transition policies, supporting more than 171,000 additional job-years, $15 billion in labor income, and $82 billion in industry output.
Ideally, strong labor protection policies would work in concert with supply- and demand-side policies to support good jobs alongside emerging clean vehicle manufacturing industries as they develop. Thus, we model a scenario (4) where widespread unionization raises wages to union levels, strong U.S. content requirements expand domestic market share by 10%, and consumer preferences bring clean trucks and buses to a 50% market share. Here, we assume the same number of workers is employed assembling these vehicles, but that they are paid a union wage. With labor inputs representing only a marginal share of the total cost of a vehicle, it is expected that firms adjust through a combination of lower corporate profits and executive compensation. Given historic profitability and CEO pay, companies have ample space to absorb these costs.56 In certain market dynamics, producers may be able to pass some of this additional cost onto consumers, but the price difference would be imperceptible—less than the cost of purchasing floor mats with a new vehicle.
In this maximal policy scenario, total employment supported in the industry would increase by 172,000 job-years, paying $19.1 billion in labor income, while output would expand by $85.9 billion over the baseline forecast scenario. These results suggest that policies supporting increased domestic manufacturing and unionization yield 28% more labor income for workers over the status quo. What’s more, rather than adversely impacting business with increased labor costs, unionization increases industry output by 4% relative to merely increasing clean energy vehicle quotas and domestic content (Scenario 3).
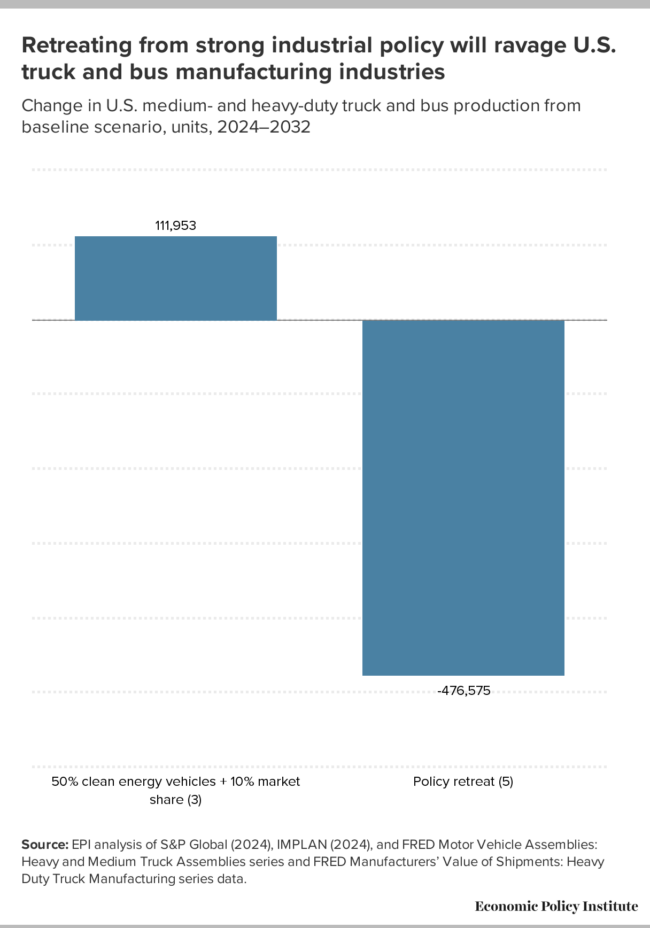
By now, we can see a pattern emerging: The stronger and more comprehensive the policy support for a clean truck and bus manufacturing, the greater the overall job and economic benefits we should expect for the industry. However, many conservative politicians—including President Trump—are pledging to undo signature legislation supporting a green transition in motor vehicle manufacturing (Scenario 5). Our analysis shows that such a move creates a lose-lose-lose outcome. A policy retreat from greening U.S. truck and bus manufacturing would cull more than 35,000 job-years from the industry (7,200 in vehicles and 28,000 in parts); drive the loss of $3.3 billion in labor income; and shrink industry output by $15.8 billion relative to the baseline scenario, as the United States misses out on newly resurgent motor vehicle manufacturing industries and becomes reliant on foreign technology and manufacturing imports.
Figure E further shows the damage that such a policy move would wreak. Relative to the baseline scenario, 477,000 fewer trucks and buses would be made in America, compared with an additional 112,000 trucks in Scenario 4. The intuition is clear: producing more vehicles with higher shares of U.S.-made content requires more workers (or work hours) who are paid decent wages. The policy retrenchment from clean vehicle transition proposed by President Trump not only moves in the opposite direction, but it runs counter to global trends. Because the rest of the world will be transitioning to clean vehicles, this could effectively shut U.S. producers out of future truck and bus export markets.
Even these figures likely significantly understate the potential economic costs of a clean vehicle policy retrenchment. Job losses predicted by the IMPLAN model only capture the mechanical production relationships between truck and bus manufacturing and their demands on motor vehicle supply chain industries. We should anticipate in practice, given real-world complexities, that economic uncertainty and chaos in the sector following such a policy whiplash will impose more severe job and economic costs.57 In particular, small- and medium-sized suppliers with less favorable access to credit markets than multinational corporations or subsidized foreign producers will find it harder to adapt to shifting targets and could face elimination from the market.
Our results show that, whether battery- or hydrogen fuel cell-driven, electrifying truck and bus manufacturing with high policy standards is a clear winner for workers and the industry overall. However, it is important to highlight that these results do not suggest that all firms and workers will automatically be winners under the transition to electrified trucks and buses. Workers and plants producing legacy ICE vehicles and parts will need retraining and retrofitting to take advantage of new opportunities; smaller businesses with less favorable access to capital than multinational manufacturers will have more difficulty adapting to these changes. Policies must pay careful attention to both ensure that dislocations from churning are managed to avoid creating political resistance to transition policies or to erode the overall benefits promised by the transition.
Change in employment from baseline scenario: Job-years, 2024–2032
| Scenario | Assembly | Supply chain | Total |
|---|---|---|---|
| 50% clean energy vehicles (1) | 31,404 | 93,456 | 124,860 |
| Baseline + 10% market share (2) | 33,108 | 115,235 | 148,343 |
| 50% clean energy vehicles + 10% market share (3) | 39,268 | 132,062 | 171,330 |
| 50% clean energy vehicles + 10% market share + union wages (4) | 40,203 | 131,774 | 171,977 |
| Baseline w/ policy retreat (5) | -7,247 | -27,971 | -35,218 |
Source: EPI analysis of S&P Global (2024), IMPLAN (2024), and FRED Motor Vehicle Assemblies: Heavy and Medium Truck Assemblies series and FRED Manufacturers’ Value of Shipments: Heavy Duty Truck Manufacturing series data.
Change in output from baseline scenario: Millions of dollars, 2024–2032
| Assembly | Supply chain | Total | |
|---|---|---|---|
| 50% clean energy vehicles (1) | $28,857 | $32,208 | $61,065 |
| Baseline + 10% market share (2) | 30,349 | 41,577 | 71,926 |
| 50% clean energy vehicles + 10% market share (3) | 36,087 | 46,143 | 82,230 |
| 50% clean energy vehicles + 10% market share + union wages (4) | 39,735 | 46,152 | 85,887 |
| Baseline w/ policy retreat (5) | -5,926 | -9,831 | -15,757 |
Source: EPI analysis of S&P Global (2024), IMPLAN (2024), and FRED Motor Vehicle Assemblies: Heavy and Medium Truck Assemblies series and FRED Manufacturers’ Value of Shipments: Heavy Duty Truck Manufacturing series data.
Change in labor income from baseline scenario: Millions of dollars, 2024–2032
| Assembly | Supply chain | Total | |
|---|---|---|---|
| 50% clean energy vehicles (1) | $2,904 | $8,278 | $11,182 |
| Baseline + 10% market share (2) | 3,054 | 10,218 | 13,272 |
| 50% clean energy vehicles + 10% market share (3) | 3,631 | 11,810 | 15,441 |
| 50% vehicles + 10% market share + union wages (4) | 7,356 | 11,766 | 19,122 |
| Baseline w/ policy retreat (5) | -596 | -2,736 | -3,332 |
Source: EPI analysis of S&P Global (2024), IMPLAN (2024), and FRED Motor Vehicle Assemblies: Heavy and Medium Truck Assemblies series and FRED Manufacturers’ Value of Shipments: Heavy Duty Truck Manufacturing series data.
Retreating from strong industrial policy will ravage U.S. truck and bus manufacturing industries: Change in U.S. medium- and heavy-duty truck and bus production from baseline scenario, units, 2024–2032
| Total trucks and buses | |
|---|---|
| 50% clean energy vehicles + 10% market share | 111,953 |
| Policy retreat | -476,575 |
Source: EPI analysis of S&P Global (2024), IMPLAN (2024), and FRED Motor Vehicle Assemblies: Heavy and Medium Truck Assemblies series and FRED Manufacturers’ Value of Shipments: Heavy Duty Truck Manufacturing series data.
Policy recommendations and conclusion
Federal incentives to build clean vehicles and their components in the United States and to buy domestically manufactured vehicles have spurred a manufacturing renaissance in this country.58 The future of U.S. truck and bus manufacturing industries will be determined by whether policymakers take steps to ensure a just transition toward manufacturing clean vehicles. President Trump’s move to scuttle financial incentives for U.S. clean vehicle manufacturing will likely accelerate the decline in U.S. truck and bus manufacturing employment and job quality, as well as the communities these support.
This outcome is not inevitable, but could result from a series of bad policy choices that would empower companies over workers. Our modeling shows that another path is possible where clean trucks and buses are made with domestically manufactured components (particularly batteries) and when workers are paid union wages, the economic benefits of a clean truck and bus transition can more than offset losses in sunset ICE manufacturing industries. Doing so will require that policymakers build on current policies and other legislation to tackle problems created by past trade policy mistakes and offer policy support to develop the market for clean vehicles from the supply and demand sides.
For the transition to succeed, broadly, the policy approach must:
- Maintain a strong public commitment to the low- and no-emissions vehicle transition, including supply-side and demand-side measures to overcome endemic market failures in the development and deployment of new clean vehicle technologies.
- Increase the domestic market share and domestic content share for clean vehicle components in made-in-America trucks and buses by tackling the problems of bad trade policies and strongly tying financial incentives to domestic content requirements.
- Ensure that newly created jobs are good jobs with program requirements for companies receiving financial incentives to make them good jobs, penalties and clawbacks for companies that fail to meet their commitments, and prohibitions from participating in programs for companies that can’t show “clean hands” with the NLRB.
Domestic manufacturing requirements and incentives ensure that taxpayer support for the industry ends up supporting good jobs and investment to build the clean trucks of the future and their key components at home, rather than just contributing to corporate profits. Labor protections for manufacturing workers ensure that the permanent jobs are desirable, high-quality, and community-sustaining jobs, where workers have the free and fair choice to join a union.
From this perspective, strong supply-side programs are those that require applicant manufacturers to build clean trucks and batteries in the U.S. and source components from other domestic manufacturers. They require applicants to meaningfully engage with organized labor and together build frameworks to negotiate community benefit and workforce agreements, which pave the path to unionization. Strong demand-side programs drive fleet owners to purchase vehicles only from manufacturers that assemble their vehicles in the United States, and source U.S.-made batteries and other components. They require or incentivize the purchase of vehicles made by union workers, or in facilities where workers have the free and fair choice to join a union.
Specifically, policymakers designing incentives to support clean truck manufacturing and deployment should consider adopting the following policies:
Trade policy recommendations
- Raise the MFN tariff rate on trucks and buses to incentivize companies to invest and operate in compliance with the North American Rules of Origin requirements—rather than simply choosing to pay the current tariff rate—while tightening these rules to cover critical clean vehicle components and to ensure content is truly made in North America.
- Leverage the USMCA July 1, 2026 sunset to negotiate to raise standards for wages and working conditions across all three countries by tightening Rules of Origin for what qualifies as “Made in North America,” improving USMCA’s labor chapter, strengthening enforcement of the Labor Value Content calculations, more aggressive implementation of USMCA’s Rapid Response Mechanism to expand labor rights in the region, and establishing meaningful wage standards for manufacturing workers.
- Restrict any goods subject to China Section 301 and Section 232 tariffs from gaining preferential access to U.S. markets under trade agreements or preference programs, including the USMCA and the Generalized System of Preferences (GSP) granting favorable U.S. market access to select low-income and developing economy countries.
- Restrict any goods produced by an entity based in, supported by, or owned by a nonmarket economy from gaining preferential access under trade agreements or preference programs, including USMCA and GSP.
- Proceed quickly on the Department of Commerce, Bureau of Industry and Security’s “connected vehicles” notice of proposed rulemaking (2024) to exclude vehicles and sensitive technology and components from countries of concern from operating in the United States.59
Supply-side policy recommendations
- Utilize program requirements to ensure that applicant manufacturers have made enforceable commitments to card check neutrality, indicating the company’s pledge to voluntarily recognize and bargain a contract with the union once the majority of workers indicate they would like to be represented by that union. Card check neutrality commitments secure workers’ right to organize without illegal intimidation from employers.60
- Require applicant manufacturers to submit detailed Community Benefits Plans modeled after the Department of Energy’s Battery Manufacturing & Recycling and Battery Materials Processing Grants, wherein employers are asked to submit letters of support from labor unions and required to build plans that advance community and labor engagement, as well as job quality and worker continuity.61
- Predicate the awarding of government support for applicant manufacturers on a “clean” record with the National Labor Relations Board, which helps to indicate an employer’s observance of, and respect for, existing labor law.
- Utilize clawback provisions with penalties to hold applicant manufacturers to their labor commitments on an ongoing basis, and beyond authoring the initial Community Benefits Plan.62
Demand-side policy recommendations
- Require domestic assembly and domestic content requirements to access clean truck deployment incentives, including grants and tax credits.The current policy for commercial clean vehicle tax credits (Section 45W) available to truck and bus consumers requires neither. For all consumer incentives, ensure that only vehicles undergoing final assembly in the U.S. and with domestically manufactured battery cells (including cell components such as anodes, cathodes, and separators) are eligible.
- Add additional “bonus” incentives for the purchase of vehicle models assembled in facilities where manufacturing workers are protected by a collective bargaining agreement, as certified by a labor union. Add further incentives for the purchase of vehicle models using battery cells made in union manufacturing facilities, as certified by a labor union.
- Apply Build America, Buy America to school buses as part of the nation’s critical rolling stock—just like public transit buses and mobile port equipment are now.
- Implement Build America domestic content rules in a manner that distinguishes batteries and non-battery components. Batteries can comprise more than half of the cost of a clean energy vehicle; as written, current content rules are likely to push other non-battery components (currently or with potential for domestic manufacturing) offshore.
- Expand Transit Infrastructure Vehicle Security Act restrictions to cover all federal assistance applicable to trucks and buses, currently only applied to Federal Transit Administration and Federal Aviation Administration programs.
Smart industrial policy uses a host of tools—like grants, loans, and tax credits—to proactively shape a nascent industry to maximize particular benefits or realize specific outcomes. The recommendations offered above may, where feasible, be applied to existing programs in future rounds of funding or help to guide the creation of new supply- and demand-side programs at all levels of government.
However, it is important to note that manufacturers are free to contribute to a strong, domestic, and union-dense clean truck supply chain without government intervention or coercion. They can choose to be high-road companies, competing on the basis of the quality of their products—rather than on the low costs of their production processes, materials, and labor. That they have historically chosen not to do so is the reason why smart industrial policy is so essential.
Acknowledgements
The authors would like to thank the following people for valuable input on earlier drafts: Candace Archer, Jim Barrett, Josh Bivens, Katherine deCourcy, Anna Fendley, Ted Fertik, Katherine Garcia, Alice Henderson, Basma Hussein, Eddie Iny, Roxanne Johnson, Jori Kandra, Jennifer Kelly, Alison Kirsch, Stevie Marvin, Terin Mayer, Ray Minjares, Eric Ribbentrop, Ellen Robo, Kevin Rudiger, Megan Sarlin, Luke Tonachel, Yihao Xie, and Peter Zalzal.
Appendix
S&P Global Mobility projections for U.S. medium- and heavy-duty vehicle production: Units, 2020–2032
| Actual production | Projected production | |
|---|---|---|
| 2020 | 265,046 | |
| 2021 | 330,913 | |
| 2022 | 350,534 | |
| 2023 | 387,293 | 387,293 |
| 2024 | 381,791 | |
| 2025 | 418,842 | |
| 2026 | 470,277 | |
| 2027 | 391,898 | |
| 2028 | 432,513 | |
| 2029 | 438,264 | |
| 2030 | 445,848 | |
| 2031 | 442,823 | |
| 2032 | 459,550 |
Source: EPI analysis of S&P Global Mobility (2024), FRED Motor Vehicle Assemblies: Heavy and Medium Truck Assemblies series, and FRED Manufacturers' Value of Shipments: Heavy Duty Truck Manufacturing series data.
U.S. heavy-duty truck production: Projections, 2024–2032
| Diesel | Electric | Fuel cell | |
|---|---|---|---|
| 2024 | 154,887 | 4,145 | 175 |
| 2025 | 161,641 | 9,914 | 400 |
| 2026 | 200,492 | 15,369 | 2,620 |
| 2027 | 147,239 | 14,242 | 3,884 |
| 2028 | 169,638 | 21,463 | 6,579 |
| 2029 | 164,652 | 26,367 | 8,653 |
| 2030 | 163,050 | 31,399 | 10,283 |
| 2031 | 155,857 | 36,294 | 11,756 |
| 2032 | 148,007 | 42,531 | 15,286 |
Source: EPI analysis of S&P Global Mobility (2024), FRED Motor Vehicle Assemblies: Heavy and Medium Truck Assemblies series, and FRED Manufacturers' Value of Shipments: Heavy Duty Truck Manufacturing series data.
U.S. medium-duty truck production: Projections, 2024–2032
| Diesel | Electric | Fuel cell | |
|---|---|---|---|
| 2024 | 184,522 | 2,696 | |
| 2025 | 204,195 | 5,056 | |
| 2026 | 203,602 | 10,396 | 455 |
| 2027 | 166,702 | 20,811 | 2,905 |
| 2028 | 162,117 | 33,275 | 4,329 |
| 2029 | 151,199 | 42,953 | 6,928 |
| 2030 | 142,284 | 51,313 | 10,318 |
| 2031 | 135,464 | 54,907 | 11,312 |
| 2032 | 124,425 | 73,182 | 18,582 |
Source: EPI analysis of S&P Global Mobility (2024), FRED Motor Vehicle Assemblies: Heavy and Medium Truck Assemblies series, and FRED Manufacturers' Value of Shipments: Heavy Duty Truck Manufacturing series data.
Notes
1. Frank Levy and Peter Temin, “Inequality and Institutions in 20th Century America,” National Bureau of Economic Research Working Paper no. 13106, May 2007.
Henry S. Farber, Daniel Herbst, Ilyana Kuziemko, and Suresh Naidu, “Unions and Inequality over the Twentieth Century: New Evidence from Survey Data,” Quarterly Journal of Economics 136, no. 3 (August): 1325–1385.
Joel Cutcher-Gershenfeld, Dan Brooks, and Martin Mulloy, The Decline and Resurgence of the U.S. Auto Industry, Economic Policy Institute, May 2015.
Lawrence Mishel and Josh Bivens, Identifying the Policy Levers Generating Wage Suppression and Wage Inequality, Economic Policy Institute, May 2021.
Chandra Childers, Rooted in Racism and Economic Exploitation, Economic Policy Institute, October 2023.
Adam S. Hersh, “UAW-Automakers Negotiations Pit Falling Wages Against Skyrocketing CEO Pay,” Working Economics Blog (Economic Policy Institute), September 12, 2023.
U.S. Bureau of Labor Statistics, All Employees, Motor Vehicles and Parts [CES3133600101], retrieved from FRED, Federal Reserve Bank of St. Louis; https://fred.stlouisfed.org/series/CES3133600101, last updated November 1, 2024.
2. The heavy-duty vehicles comprise a unique segment of the industry with its unique challenges, though also sharing some commonalities with the transition in light-duty vehicle manufacturing; for some data, official statistics do not disaggregate between light-duty and heavy-duty industry segments. Where available, we present industry-specific data; elsewhere we rely on higher industry aggregation for motor vehicles and parts manufacturing.
3. The White House, President Biden Announces up to $6.1 Billion Preliminary Agreement with Micron under the CHIPS and Science Act (fact sheet), April 25, 2024.
4. Department of Labor, “Protections for Workers in Construction Under the Bipartisan Infrastructure Law” (web page), accessed May 2024.
Internal Revenue Service, “IRA Prevailing Wage Requirements” (web page), accessed May 2024.
CHIPS for America, Building a Skilled and Diverse Workforce (fact sheet), published February 28, 2023.
5. The White House, Unleashing American Energy (executive order), January 20, 2025.
6. The Economist, “Why Chinese Companies Are Flocking to Mexico,” November 23, 2023.
Meritt Enright, “How China Became the Leading Car Supplier to Mexico and What It Means for the U.S.,” CNBC, August 24, 2024.
Mexico News Daily, “BYD Weighs 3 States for Electric Vehicle Plant,” August 26, 2024.
Elizabeth Machuca, “China’s BYD Plans Expansion Into Mexico, Rules Out U.S.,” Wards Auto, May 24, 2024.
Reuters, “MG Motor to Build Manufacturing Plant, R&D Center in Mexico,” August 8, 2024.
Noi Mahoney, “China-Based Automaker to Invest $3B in Mexico EV Plant,” Freight Waves, April 3, 2023.
7. U.S. Bureau of Labor Statistics, All Employees, Motor Vehicles and Parts [CES3133600101], retrieved from FRED, Federal Reserve Bank of St. Louis; https://fred.stlouisfed.org/series/CES3133600101, last updated November 1, 2024.
Chandra Childers, Southern Economic Policies Undermine Job Quality for Auto Workers, Economic Policy Institute, September 4, 2024.
8. Celine McNicholas, Margaret Poydock, and Lynn Rhinehart, Unprecedented: The Trump NLRB’s Attack on Workers’ Rights, Economic Policy Institute, October 16, 2019.
9. Jill Colvin and Tom Krisher, “Trump Goes to Michigan to Rail Against Biden’s Electric Vehicle Push While GOP Rivals Debate,” Associated Press, September 28, 2023.
10. Grant Schwab, “UAW Claims Illegal Labor Threats in X Talk Between Musk and Trump,” The Detroit News, August 13, 2024.
11. Board of Governors of the Federal Reserve System (US), Motor Vehicle Assemblies: Heavy and Medium Truck Assemblies [MVAHMTRCKS], retrieved from FRED, Federal Reserve Bank of St. Louis; https://fred.stlouisfed.org/series/MVAHMTRCKS, last updated November 15, 2024.
12. AB Volvo, “Volvo Group to Increase North American Heavy Truck Production Capacity,” April 11, 2023.
Rick Holmes, “’Slap in the face’: Union criticizes company’s decision to build some Mack trucks in Mexico,” WFMZ-TV News, April 11, 2024.
Geert De Lombaerde, “Daimler Truck signals production ‘flexibility’ if Trump tariffs require it,” Fleet Owner, November 8, 2024.
Michael Mayland, “Automaker Stellantis has discussed moving pickup truck production from the U.S. to Mexico, union leader says,” CNBC, August 20, 2023.
13. BlueGreen Alliance Foundation, “EV Jobs Hub” (web page), last updated November 2024.
14. Medium- and heavy-duty vehicles encompass Class 4–8 trucks and buses—but not light-duty pick-up trucks like the Ford F-150, Chevrolet Silverado, or Dodge Ram—as well as school, transit, and coach buses; they do not include agricultural machinery or motor homes. Generally, these vehicles have a gross vehicle weight rating (GVWR) above 14,000 pounds and encompass most, but not all, of the list of “Medium- and Heavy-Duty Truck HTS 10-Digit Import Codes,” identified by the U.S. International Trade Administration (2023).
15. Dana Lowell and Jane Culkin, Medium- & Heavy-Duty Vehicles: Market Structure, Environmental Impact, and EV Readiness, Environmental Resources Management, July 2021.
16. Historically, motor vehicle jobs and output multipliers were even higher before so much of the supply chain moved offshore. Industries including wholesale and retail distribution of motor vehicles and parts and maintenance services comprise additional vast industries with broad economic impacts of their own.
IMPLAN (2024). IMPLAN Regions Multiplier Summary.
Josh Bivens, Updated Employment Multipliers for the U.S. Economy, Economic Policy Institute, January 2019.
17. Environmental Protection Agency, Inventory of U.S. Greenhouse Gas Emissions and Sinks: 1990–2022, April 2024.
American Lung Association, Delivering Clean Air: Health Benefits of Zero-Emission Trucks and Electricity, October 2022.
18. American Lung Association, State of the Air, April 2023.
19. MHDVs are a major source of nitrogen oxide and particulate matter emissions—smog-forming pollutants that are strongly associated with a wide range of poor health and individual development outcomes, including adverse childhood cognitive and health development; increased incidence of chronic cardiovascular disease; and cancer. And these costs tend to be disproportionately borne by historically disadvantaged groups, often living in marginalized proximity to concentrated sources of emissions. Roughly 72 million people in disproportionately low-income communities and communities of color live in “fenceline” communities near warehouses, ports, railyards, airports, and major freight routes and highway corridors that experience heavy MHDV traffic. Particularly in the case of MHDVs, the American Lung Association (ALA) estimates that a full transition to zero-emission MHDVs by 2050 in just the U.S. counties with the highest levels of MHDV traffic would yield up to $735 billion in public health benefits. More specifically, ALA estimates that a full transition to zero-emission MHDVs by 2050 could avoid more than 8,500 lost workdays, 1.75 million asthma attacks, and 66,800 premature deaths. When including the impact of electrifying light-duty vehicles as well, these numbers increase to 13.4 million lost workdays, 2.78 million asthma attacks, and 110,000 premature deaths.
American Lung Association, Delivering Clean Air: Health Benefits of Zero-Emission Trucks and Electricity, October 2022.
Environmental Protection Agency, “Final Standards to Reduce Greenhouse Gas Emissions from Heavy-Duty Vehicles for Model Year 2027 and Beyond” (regulatory announcement), March 2024.
American Lung Association, Zeroing in on Healthy Air, March 2022.
20. International Energy Agency 50, “Trucks and Buses” (web page), accessed May 2024.
21. A similar transition is underway in passenger vehicles and light trucks, with much overlap of producers in light-duty and medium- and heavy-duty motor vehicle supply chains.
International Energy Agency 50, “Trucks and Buses” (web page), accessed May 2024.
22. Global Commercial Vehicle, “Global Memorandum of Understanding on Zero-Emission Medium- and Heavy-Duty Vehicles” (web page), accessed May 2024.
23. EPI analysis of the Current Population Survey Basic monthly microdata, EPI Current Population Survey Extracts, Version 1.0.52 (2024), https://microdata.epi.org.
24. International Energy Agency 50, Global EV Outlook 2023, April 2023.
25. Trade in steel and aluminum products offers some exception.
Adam S. Hersh and Robert Scott, Why Global Steel Surpluses Warrant U.S. Section 232 Import Measures, Economic Policy Institute, March 2021.
Adam S. Hersh and Robert Scott, Aluminum Producing and Consuming Industries Have Thrived Under U.S. Section 232 Import Measures, Economic Policy Institute, May 2021.
26. Adam S. Hersh, “Testimony prepared for the U.S. International Trade Commission report on the USMCA Automotive Rules of Origin,” October 16, 2024.
Adam S. Hersh, “EPI comments to the Office of the United States Trade Representative on the US-Mexico-Canada Agreement with respect to automotive goods,” January 22, 2024.
27. Adam S. Hersh and Robert Scott, Why Global Steel Surpluses Warrant U.S. Section 232 Import Measures, Economic Policy Institute, March 2021.
Adam S. Hersh and Robert Scott, Aluminum Producing and Consuming Industries Have Thrived Under U.S. Section 232 Import Measures, Economic Policy Institute, May 2021.
28. Adam S. Hersh, “EPI comments to the Office of the United States Trade Representative on the US-Mexico-Canada Agreement with respect to automotive goods,” January 22, 2024.
29. Isabella Cota, “Growth of China’s Automotive Sector in Mexico Worries the US,” EL PAÍS English, November 13, 2023.
30. Adam S. Hersh and Robert E. Scott, Why Global Steel Surpluses Warrant U.S. Section 232 Import Measures, Economic Policy Institute, March 2021.
Adam S. Hersh and Robert E. Scott, Aluminum Producing and Consuming Industries Have Thrived under U.S. Section 232 Import Measures, Economic Policy Institute, May 2021.
Robert E. Scott, The Manufacturing Footprint and the Importance of U.S. Manufacturing Jobs, Economic Policy Institute, January 2015.
31. Board of Governors of the Federal Reserve System (US), Motor Vehicle Assemblies: Heavy and Medium Truck Assemblies [MVAHMTRCKS], retrieved from FRED, Federal Reserve Bank of St. Louis; https://fred.stlouisfed.org/series/MVAHMTRCKS, last updated November 15, 2024.
32. These include anti-dumping and countervailing duty enforcements and Section 232 and Section 301 tariffs enacted under U.S. trade law in response to anti-competitive practices in the Chinese economy.
Adam Hersh, “Docket Number USTR–2023–0013: 2024 USMCA Autos Report,” January 17, 2024.
Connor Pfeiffer, “Will China Drive Its Electric Cars in From Mexico?” Wall Street Journal, March 5, 2024.
Alliance for American Manufacturing, On a Collision Course: China’s Existential Threat to America’s Auto Industry and Its Route Through Mexico, February 2024.
33. Scott Kennedy, Made in China 2025, Center for Strategic and International Studies, June 1, 2015.
Usha C.V. Haley, Putting the Pedal to the Metal: Subsidies to China’s Auto-Parts Industry from 2001 to 2011, Economic Policy Institute, January 2012.
Agnes Chang and Keith Bradsher, “Can the World Make an Electric Car Battery Without China?” New York Times, May 16, 2023.
34. Adam Hersh, “Docket Number USTR–2023–0013: 2024 USMCA Autos Report.” January 17, 2024.
35. Adam Hersh, “Docket Number USTR–2023–0013: 2024 USMCA Autos Report.” January 17, 2024.
36. Reuters, “China’s BYD to Launch First Pick Up Truck at Event in Mexico.” May 7, 2024.
Daniel J. McCosh, “BYD Seagull Lands in Mexico as Dolphin Mini,” Wards Auto, March 1, 2024.
37. Philip Blenkinsop, “EU slaps tariffs on Chinese EVs, risking Beijing backlash,” Reuters, October 30, 2024.
Jorge Valero and Alberto Nardelli, “EU Moves Toward Hitting China with Tariffs on Electric Vehicles,” Bloomberg, March 6, 2024.
38. Heejin Kim, “China’s CATL, BYD Dominate EV Battery Market as Demand Grows,” Bloomberg, October 11, 2023.
39. Mass Transit, “BYD Receives Largest Battery-Electric Bus Order in U.S. History,” November 14, 2019.
Emily Alpert Reyes, “Electric Vehicle Firm BYD Accused of Violating L.A. Wage Rules,” Los Angeles Times, December 1, 2015.
Jobs to Move America, “Protest Denounces Broken Promises by BYD Motors, Inc., Chinese Electric Bus Manufacturer to Taxpayers of LA” (press release), December 1, 2015.
Jennifer Medina, “Chinese Company Falling Short of Goal for California Jobs,” New York Times, October 25, 2013.
40. BYD, BYD Truck Fact Sheet (fact sheet), accessed May 2024.
41. Author’s discussion with A2Mac1 representatives.
Nick Carey and Ben Klayman, “Insight: Why BYD’s EV Exports Sell for Twice the China Price,” Reuters, April 26, 2024.
42. Laura He, “Tesla Cuts Prices in US, China and Germany as Competition Heats Up,” CNN Business, April 22, 2024.
Andrew J. Hawkins, “Ford Slashes Mustang Mach-E Prices Again as EV Price War Enters Its Second Year,” The Verge, February 20, 2024.
Riz Akhtar, “Nissan Slashes Driveaway Price of Electric Leaf to Below $40,000 as EV Price War Deepens,” The Driven, May 9, 2024.
43. Adam Hersh, China’s Path to Financial Reform, Center for American Progress, October 2014.
44. Like all models, input-output models including the IMPLAN model, make necessary simplifying assumptions about the real world we are trying to understand, which condition our interpretation of the results. IMPLAN® model. 2024. Data, using inputs provided by the user and IMPLAN Group LLC, IMPLAN System (data and software), 16905 Northcross Dr., Suite 120, Huntersville, NC 28078 www.IMPLAN.com.
45. S&P Global Mobility, Medium- and Heavy-Commercial Vehicle Forecast, May 2024.
S&P Global Mobility, Medium- and Heavy-Commercial Vehicle Forecast Services Dictionary, September 2023.
46. The historical S&P Global data correspond closely to publicly available industry economic data on MHDV production from the Federal Reserve. We estimate projected output values based on the linear regression of inflation-adjusted manufacturers’ vehicle shipment on truck assemblies.
Board of Governors of the Federal Reserve System (US), Motor Vehicle Assemblies: Heavy and Medium Truck Assemblies [MVAHMTRCKS], retrieved from FRED, Federal Reserve Bank of St. Louis; https://fred.stlouisfed.org/series/MVAHMTRCKS, last updated November 15, 2024.
U.S. Census Bureau, Manufacturers’ Value of Shipments: Heavy Duty Truck Manufacturing [A36CVS], retrieved from FRED, Federal Reserve Bank of St. Louis; https://fred.stlouisfed.org/series/A36CVS, last updated Novemver 4, 2024.
47. For more detail, see Appendix Figures A–D.
48. UBS, “The Electric Vehicle Revolution Is Shifting into Overdrive” (web page), March 3, 2021.
International Council on Clean Transportation, E-Truck Virtual Teardown Study, June 2021.
Ben Sharpe and Hussein Basma, “A Meta-Study of Purchase Costs for Zero-Emission Trucks,” International Council on Clean Transportation Working Paper no. 2022-09, February 2022.
49. Zachary Shahan, “Ford CEO: 40% Less Labor To Build Electric Vehicles,” Clean Technica, November 16, 2022.
Jim Barrett and Josh Bivens, The Stakes for Workers in How Policymakers Manage the Coming Shift to All-Electric Vehicles, Economic Policy Institute, September 2021.
50. Turner Cotterman, Erica R. Fuchs, Kate Whitefoot, and Christophe Combemale, “The Transition to Electrified Vehicles: Evaluating the Labor Demand of Manufacturing Conventional Versus Battery Electric Vehicle Powertrains,” Energy Policy 188, 114064 (June 2022).
Andrew Weng, Omar Y. Ahmed, Gabriel Ehrlich, and Anna Stefanopoulou, “Higher Labor Intensity in US Automotive Assembly Plants After Transitioning to Electric Vehicles,” Nature Communications 15, 8088 (September 2024).
51. International Council on Clean Transportation, E-Truck Virtual Teardown Study, June 2021.
Ben Sharpe and Hussein Basma, “A Meta-Study of Purchase Costs for Zero-Emission Trucks,” International Council on Clean Transportation Working Paper no. 2022-09, February 2022.
52. Given current tight labor market conditions near full employment levels, our results should be interpreted as supporting employment in MHDV manufacturing and parts industries, rather than creating new jobs. This likely would entail job-shifting—drawing workers employed in other industries into motor vehicle manufacturing. On average, these jobs are better paid and yield higher productivity than other jobs, meaning there will be individual and social welfare gains from such job shifting even if there is no net change in total employment.
53. Global Commercial Vehicle, “Global Memorandum of Understanding on Zero-Emission Medium- and Heavy-Duty Vehicles” (web page), accessed May 2024.
54. Hussein Basma, Claire Buysse, Yuanrong Zhou, and Felipe Rodriguez, Total Cost of Ownership of Alternative Powertrain Technologies for Class 8 Long-Haul Trucks in the United States, International Council on Clean Transportation, April 2023.
North American Council for Freight Efficiency, “Medium-Duty Electric Trucks: Cost of Ownership” (web page), accessed May 2024.
Andrew Burnham, David Gohlke, Luke Rush, Thomas Stephens, Yan Zhou, Mark A. Delucchi, Alicia Birky, Chad Hunter, Zhenhong Lin, Shiqi Ou, Fei Xie, Camron Proctor, Steven Wiryadinata, Nawei Liu, and Madhur Boloor, Comprehensive Total Cost of Ownership Quantification for Vehicles with Different Size Classes and Powertrains, Argonne National Laboratory, April 2021.
55. James Temple, “Trump Wants to Unravel Biden’s Landmark Climate Law. Here Is What’s Most at Risk,” MIT Technology Review, February 26, 2024.
Senate Committee on Energy & Natural Resources, “Barrasso, Rodgers Pen Op-Ed: The Biden Climate Legacy: American Weakness,” Republican News, October 19, 2023.
Houston Keene, “One Year Later, Senate Republicans Give Inflation Reduction Act an ‘F’: ‘Reckless Spending Spree’,” Fox News, August 16, 2023.
House Committee on Appropriations, “House Republican Bills Attack and Undermine the Inflation Reduction Act and Bipartisan Infrastructure Law,” n.d.
56. Al Root, “How Much UAW Wage Increases Will Really Raise Car Prices,” Barron’s, October 1, 2023.
Adam S. Hersh, “UAW-Automakers Negotiations Pit Falling Wages Against Skyrocketing CEO Pay,” Working Economics Blog (Economic Policy Institute), September 12, 2023.
57. Disruptions can be expected to plague both the supply- and demand-sides, as consumers will face greater uncertainty in committing to invest in long-lived durable goods with more uncertain prospects for future operational costs.
58. Leo Banks, How Inflation Reduction Act Electric Vehicle Incentives Are Driving a U.S. Manufacturing Renaissance, Center for American Progress, November 2023.
59. Department of Commerce Bureau of Industry and Security, “Securing the Information and Communications Technology and Services Supply Chain: Connected Vehicles,” Docket No. 240227-0060. March 1, 2024.
60. Teamsters Local 492, “What Is Card Check Neutrality?” (web page), October 4, 2017.
61. Community Benefits Plan template, accessible here.
62. Good Jobs First, “Key Reforms: Clawbacks” (web page), accessed May 2024.