Full Report
Many states across the Southern United States1 employ an economic model that prioritizes business interests and the wealthy over ordinary citizens. This model—which we refer to in this report as the “Southern economic development model”—is characterized by low wages, low taxes, few regulations on businesses, few labor protections, a weak safety net, and vicious opposition to unions. The model is marketed as the way to attract businesses into Southern states, with the implicit promise that this will lead to an abundance of jobs and shared economic prosperity for all Southerners.
The reality is this economic development model is fundamentally flawed as a strategy for improving living conditions for most Southerners. In fact, the Southern economic development strategy was never designed to help the vast majority of working Southerners; rather, it reflects efforts to ensure continued access to the cheap labor of Black people following emancipation. Today the cheap labor sought is increasingly diverse, yet it is still overwhelmingly made up of Black and brown workers across the region.
In this report, we use empirical data to show that the Southern economic development model has failed to provide economic security for workers and families across the South. In fact, the South lags other regions of the country on most indicators of economic health.2 We also show—through historical context and case examples—how the Southern economic development model continues to serve as a means of maintaining racial hierarchies across the South.3
What characterizes the Southern economic development model?
To maintain the disproportionate levels of wealth and power enjoyed by many Southern politicians, corporate interests, and many wealthy and powerful people across the nation, businesses in the South have relied on access to large pools of cheap labor.
Businesses in the South have particularly depended on the labor of Black and brown Southerners. These laborers are used in cotton and tobacco fields, to produce the food we eat, to care for our children and the elderly, to build the nation’s infrastructure, and to perform many other jobs for little or no compensation.
Enslaved Africans were not paid at all. After the end of slavery, many Black workers, such as the Pullman porters, were forced to rely on tips. Today, while slavery is illegal in most cases, incarcerated workers can be—and often are—required to work without pay (ACLU and GHRC 2022). Below, we discuss other ways worker’s wages are kept low or kept from them entirely.
The racist roots of this model have been obscured and have been replaced by a more acceptable “pro-business” narrative. The pro-business narrative suggests that low wages, low taxes, anti-union policies, a weak safety net, and limited regulation on businesses creates a rising tide that “lifts all boats.”
Below we examine the key features of the Southern economic development model in detail.
Low wages
Many states across the South promote low wages for many workers by the policies they implement or, in many cases, the policies they choose not to implement.
For example, five Southern states—Mississippi, Louisiana, Alabama, Tennessee, and South Carolina—have no state minimum wage at all. Georgia has a minimum wage set at $5.15 per hour. Because the federal minimum wage is set at $7.25 per hour and $2.13 per hour for tipped workers, all workers across the South are supposed to be paid at least these minimums (EPI 2023).
Fewer than half of the Southern states (six states plus D.C.) have a minimum wage higher than the federal minimum wage of $7.25 per hour. In every other region, more than half of states have minimum wages higher than $7.25 (EPI 2023).
Because many Southern states have weak, if any, labor enforcement, wage theft is common across the South. That means some workers are not even paid these too-low minimum wages. This is especially true in industries like food and drink services, agriculture, and retail (Cooper and Kroeger 2017).
Cooper and Kroeger (2017) analyze data on the share of workers who have experienced minimum wage violations—i.e., were paid less than the applicable minimum wage—in the 10 most populous U.S. states. They find that large shares of workers in Florida (24.9%), North Carolina (12.3%), Texas (10.8%), and Georgia (9.4%) have experienced minimum wage violations.
Failing to pay the minimum wage is just one of the ways employers cheat workers out of their earnings.4 Employers who commit wage theft are rarely punished (Cooper and Kroeger 2017). In Florida, for example, there isn’t a state department of labor to enforce wage standards; employers therefore have no reason to fear being caught or punished. In Alabama, Delaware, Georgia, Louisiana, Mississippi, and South Carolina—which technically do have departments of labor (DOLs)—the DOLs do not in practice make any effort to recover wages that are stolen by employers (Mangundayao et al. 2021).
Notably, some Southern states have actively fought against federal government efforts to raise wages in their states. In 2022, the attorneys general of Texas, Louisiana, and Mississippi sued the federal government to prevent an increase in the wages of federal contractors.5
It is important to understand that federal standards governing minimum wages, overtime, and even what activities are to be included in the number of hours worked were designed to keep wages low in the South. When the Fair Labor Standards Act (FLSA) was enacted in 1938, establishing these rules, large categories of workers—primarily agricultural workers, domestic workers, tipped workers, and public-sector workers—were excluded from the FLSA’s protections.
Agricultural workers, domestic workers, and tipped workers were excluded specifically because the formerly enslaved were limited almost entirely to these lines of work across the South; Southern lawmakers would not agree to vote for the legislation without these exclusions (Dixon 2021; Perea 2011). As noted above, the practice of using tips to compensate service workers in the United States began in the 19th century after the end of slavery. This practice allowed businesses to hire the formerly enslaved without actually having to pay them (Dixon 2021; Tye 2005).
When the FLSA was amended in 1966 to include service workers—among other coverage expansions—a special “tip credit” was created that allowed employers to count tips received by staff against a portion of the minimum wage the employer was required to pay—effectively creating a separate, lower minimum wage (Allegretto and Cooper 2014). Today, Southern tipped workers continue to rely heavily on their tips. As noted above, the federal minimum wage for tipped workers, which applies in most Southern states, is only $2.13 per hour—a level that has remained unchanged since 1991 (Schweitzer 2021).
We continue to see the influence of racism and sexism in the low wages and lack of protections offered to workers in jobs that were historically held by enslaved people. Domestic work, for example, historically has been—and continues to be—performed by Black, brown, and immigrant women. These women work as nursing, psychiatric, and home health aides; personal and home care aides; and nursing assistants in private households. Across the South, Black women make up 43% of home health care workers, followed by Hispanic women at 17% (Childers, Sawo, and Worker 2022). But workers in these jobs remain undercompensated despite the clear value of this work—providing care that allows families to work and that allows elderly and disabled Southerners to age in their homes (Childers, Sawo, and Worker 2022; Robertson, Sawo, and Cooper 2022).
Minimal levels of regulation
Another key component of the Southern economic development model is ensuring that businesses aren’t “hampered” by regulation. This includes minimal regulation of business activities that pollute the air, water, and soil. It also means lack of regulation or enforcement around labor laws such as federal minimum wage laws, overtime laws, or safety standards for workers (Cooper and Kroeger 2017; Fleischman and Franklin 2017; Florida Policy Institute 2022; Terrell and St. Julien 2023; Waldman 2017).
Issues resulting from weak regulatory standards can be particularly widespread in Black and brown communities (Donaghy et al. 2023). Terrell and St. Julien (2023), for example, found that, due to a lax state permitting process, these communities across Louisiana had a seven to 21 times greater exposure to air pollutants, especially those from chemical manufacturers, compared with white communities. Black and brown communities experience similar disproportionate impacts from coal ash, which contains toxic metals that pollute the air and water in North Carolina and other states (Bienkowski 2016; SELC 2019).
Low income and corporate taxes
Next, the Southern economic development model seeks to limit corporate and personal income taxes, particularly any that would increase the tax burden of higher-income households and individuals.
The roots of the South’s tax structure
To understand attitudes toward taxes across the South, it is important to understand the roots of the current stance on taxes in the Southern economic development model. Before the Civil War, taxes on enslaved people—considered the private property of slaveholders—were paid primarily by wealthy plantation owners and constituted a significant source of revenue for states across the South (Williamson 2021).
After slavery was abolished, plantation owners represented themselves as “concerned taxpayers” who opposed rising property taxes. They were joined by poor white farmers who would now also be subject to rising property taxes raised by newly—and temporarily—empowered Black political leaders.
These leaders were raising taxes to provide basic services such as public education and to rebuild infrastructure after the devastation of the Civil War. But wealthy Southerners stoked racial animus to divide poor and working-class Southerners along the lines of race and ensure majority support to implement highly regressive tax policies (Williamson 2021; Young 2023).
Low corporate and income taxes force reliance on regressive sales taxes
Today, Southern politicians, business interests, and other wealthy Southerners continue to seek to eliminate or limit corporate and personal income taxes. For example, several Southern states used temporary budget surpluses—surpluses resulting from the distribution of federal dollars to states intended to address COVID-19 and the associated recession—as an excuse to further cut already low income-tax rates (Das 2022a).
Corporate and personal income taxes tend to be progressive, meaning they are structured such that higher-income earners pay a larger share of their income in taxes, while lower-income earners pay a smaller share. But when collection of corporate and personal income taxes declines, states are forced to rely more heavily on sales and property taxes, which are regressive. When sales and property taxes are assessed, lower-income people end up paying a larger share of their income for those taxes than higher-income people do (Wiehe et al. 2018; Young 2023).
Texas, Florida, and Tennessee have no income tax. In other Southern states, income tax rates fail to raise adequate revenue, requiring those states to rely on sales and property taxes and fees and fines to pay for many public services, including education, public health, public safety, infrastructure, and other services.
In 2019, for example, more than 40% of all state and local tax revenue came from sales taxes in many Southern states. These included Tennessee (56.6%), Louisiana (53.3%), Florida (50.9%), Arkansas (49.6%), Alabama (48.0%), and Mississippi (45.5%). These shares are substantially higher than the 34.4% of state and local tax revenue that sales taxes account for nationally (Das 2022a).
To generate this revenue, these states had sales taxes ranging from 4.0% in Alabama to 7.0% in Mississippi and Tennessee. And while most states at least exempt food from sales taxes, as of January 2023 Mississippi, Alabama, and Oklahoma did not (Tax Policy Center 2023).6
This approach to taxes means that public services are underfunded in the South
Proponents of this tax model argue that it increases the incomes of all households by allowing them to keep more of their money. Further, they argue that it allows businesses to reinvest and grow their businesses, thereby increasing tax revenue. In reality, this regressive approach to taxes simply means there is not sufficient revenue to properly fund education, health care, public transportation, water and sewer system maintenance, and the many other public services Southerners rely on (Das 2022b).
The lack of resources to provide services for ordinary Southerners is further exacerbated when state governments give huge subsidies to private companies. For example, Mississippi gave a $247 million subsidy to Steel Dynamics in 2022, and South Carolina spent $1.3 billion on a subsidy for Scout Motors in 2023 (Good Jobs First 2023b, 2023c).
A weak safety net
The Southern economic development model is further characterized by a weak social safety net. Unemployment insurance (UI), for example, is a crucial component of the social safety net, meant to ensure families have economic security in the face of a job loss by replacing some percentage of their prior earnings (Bivens and Banerjee 2021). During times of crisis, such as the COVID-19 recession, it also helps stabilize the broader economy (Bivens et al. 2021).
Southerners face greater insecurity when they lose their jobs
While the UI system is funded jointly by federal and state funds, it is the state that has primary control over who is eligible to receive benefits, the level and duration of those benefits, and how the system is financed (Bivens et al. 2021).
The fact that the states where most Black Americans live have the least accessible UI systems with the least generous benefits and some of the most onerous requirements is not a coincidence or an accident. The UI system as structured is rooted in a racist agenda: Southern Democrats agreed to support the New Deal only if states controlled access to UI and other social benefits. This allowed them to design systems that would limit Black workers’ access to benefits (Edwards 2020; Traub and Diehl 2022).
Data show that of the 10 states with the lowest maximum weekly UI benefit amounts, seven—Mississippi ($235), Alabama ($275), Florida ($275), Louisiana ($275), Tennessee ($275), South Carolina ($326), and North Carolina ($350)—are in the South and have large Black populations (The Century Foundation 2023).
Southerners face barriers to health care access
The South is also the least likely of any region to ensure its constituents have access to health care. This is particularly concerning given high rates of illness and comorbidities across the South (Akinyemiju et al. 2016).
The 2010 Patient Protection and Affordable Care Act (ACA) included an expansion of Medicaid eligibility to adults with incomes up to 138% of the official poverty line. While most states have adopted and implemented the expansion, 10 states have failed to adopt it, and seven of these—Mississippi, Alabama, Georgia, South Carolina, Florida, Tennessee, and Texas—are in the South (KFF 2023).7
Southern states have some of the lowest levels of cash assistance for families with children
Aid to Families with Dependent Children (AFDC), a cash assistance program for poor families with children, was established in 1935 as Aid to Dependent Children (ADC).8 In 1996 the Personal Responsibility and Work Opportunity Act (PRWORA) replaced AFDC with the Temporary Assistance for Needy Families (TANF).
TANF differs from AFDC in several important ways. Under AFDC, states could receive unlimited federal matching funds; under TANF, federal support is distributed to states through a block grant. TANF also has five-year lifetime benefit limits and requires that states increase their work participation rates for TANF recipients (DHHS n.d.).
While the federal government funds TANF, states determine benefit levels and income and resource limits, and they administer or oversee administration of the program. States have a great deal of discretion in how they use TANF funds because the specific goals of the program are so broad. The stated goals of the program are to (1) assist families in need so children can be cared for in their own homes; (2) reduce parental dependence on government by promoting job training, work, and marriage; (3) prevent out-of-wedlock pregnancies; and (4) encourage two-parent families (CBPP 2022; DHHS n.d.).
Under the first goal, states can provide direct cash assistance to families to provide for their children (CBPP 2022; DHHS n.d.). In 1997, 71% of TANF dollars were spent for this purpose, but by 2020 this share had fallen to just 22% nationally (Azevedo-McCaffrey and Safawi 2022).
There are large variations in spending by state. In 2021, 15 states spent 10% or less of TANF dollars to provide cash assistance to families. Seven of these states—Alabama, Arkansas, Delaware, Louisiana, Mississippi, North Carolina, and Texas—are in the South and have large Black and Hispanic populations. Of the remaining states spending 10% or less of funds in direct assistance, six were in the Midwest and two were in the Northeast.9 Across the South, only the District of Columbia and Kentucky spent 30% or more of their TANF funds for direct assistance (Azevedo-McCaffrey and Safawi 2022).
Benefit levels are also low in many states, especially in the South. The maximum monthly benefit for a single mother with two children ranges from $204 in Arkansas to a high of $1,151 in New Hampshire. Only four Southern jurisdictions—the District of Columbia ($665), Maryland ($727), Virginia ($587), and West Virginia ($542)—have a benefit amount greater than $500 for a three-person family (Thompson, Azevedo-McCaffrey, and Carr 2023).
In 16 states, the nominal TANF benefit in 2022 is the same as or lower than it was in 1996. Seven of these states—Arkansas, Delaware, Florida, Georgia, Kentucky, North Carolina, and Oklahoma—are in the South. The failure to raise the nominal benefit means that in these states, the inflation-adjusted value of the benefit is 45% to 56% lower than it was in 1996 (Thompson, Azevedo-McCaffrey, and Carr 2023).10
The current structure of TANF in many Southern states reflects efforts of politicians to control the behavior and reproduction of Black women and compel their labor into the low-wage labor market (Floyd et al. 2021; CBPP 2022).11 Historically, states like Alabama and Louisiana have used “deservingness,” “suitable homes,” and “man in the house” rules to exclude Black families from the program. States began to pass these morals-based eligibility rules in the 1940s as the ADC rolls began to become more diverse (Floyd et al. 2021; Gordon and Batlan 2011; O’Connor 1969).
To be “deserving,” a mother needed to be widowed, have a husband that was unable to provide for the family’s needs due to disability, or have been abandoned by the children’s father “through no fault of the mother.” A home was “unsuitable,” by definition, if the mother was unwed or engaged in sexual activity outside of marriage (Floyd et al. 2021; Floyd and Pavetti 2022).
The “man in the house” rule denied mothers benefits if a man was found to be living in the house or if the mother was found to be sexually active, even if no man lived in the house with her and her children. In either case, it did not matter whether the man involved was the children’s father or not (Floyd et al. 2021; O’Connor 1969).12
Today, those states with larger Black populations—primarily Southern states where the majority of the Black population lives—tend to have more stringent requirements to access TANF benefits, and those benefits tend to be more meager (Shrivastava and Thompson 2022).
Anti-union policies
Finally, and perhaps most importantly, advocates of the Southern economic development model vociferously oppose unions and other collective actions in which workers band together, especially across racial, ethnic, and immigration statuses.
Research has shown that higher rates of unionization are associated with higher wages, better working conditions, less inequality, less racial animosity, greater economic mobility, and greater civic participation (Banerjee et al. 2021; Freeman et al. 2015; Frymer and Grumbach 2021; Mishel 2021; Mishel, Rhinehart, and Windham 2020). Despite this, states across the South have adopted policies that hamstring workers’ ability to form unions because they pose a threat to the Southern economic development model.
First, unions threaten the Southern economic development model because they have historically been the primary counterweight against businesses seeking to keep wages and benefits low. Second, the labor movement in the U.S. today is one of the foremost institutions promoting cross-racial solidarity. Third, unions are a key driver of greater equity in the workplace (Bivens et al. 2023).
Labor unions have not always fulfilled the roles of cross-racial solidarity or racial equity in the workplace—many unions have a history of anti-Black racism. Throughout the 20th century, businesses would pit Black and white workers against one another, including by using Black workers as strikebreakers (Arnesen 2003).
Many white workers viewed Black workers as competition. This—coupled with the belief that Black workers were inferior to them—led them to oppose including Black workers in their unions. Unions such as the American Federation of Labor and many trade unions would not organize Black workers (Hill 1959). In response, Black workers began forming their own unions. A. Philip Randolph, for example, organized Black porters in the Brotherhood of Sleeping Car Porters (AFL-CIO 2014; Tye 2005).
Not all unions were opposed to organizing workers across race, though. Some, like the Congress of Industrial Organizations, realized that as long as workers were divided, their power would continue to be undermined. As noted above, when Black workers or any other group of workers are systematically excluded from joining a union, they can then be used as strikebreakers. This makes it less likely that a strike will be effective and less likely that workers’ demands will be met.
Despite the negative experiences many Black workers had with discriminatory unions, many civil rights leaders were also labor leaders who wanted to bring workers together to demand economic justice and equality for all workers. The organizers of the 1963 March on Washington for Jobs and Freedom, which everyone remembers for Dr. Martin Luther King Jr.’s “I Have a Dream” speech, included A. Philip Randolph. Randolph had not only led the Brotherhood of Sleeping Car Porters but had also demanded racial integration of the military and called for a march on Washington in the 1940s to force President Roosevelt to issue an executive order banning discrimination in war industries (AFL-CIO n.d.).

Figure A. Racist flyer used to drive opposition to the Congress of Industrial Organizations (CIO) in the 1940s. (Photo by David Haberstich. Courtesy of Donald McKee, cited in Griffith 1988.)
In pushing back against interracial labor organizing, wealthy and powerful Southerners would invoke white supremacy to thwart these efforts for collective economic justice. During a campaign to get a so-called right-to-work (RTW) law on the books in Arkansas, advocates made clear that RTW was critical to maintaining racial segregation. (RTW laws require unions to represent all workers but restrict their ability to collect dues, thereby weakening the unions.) To advance their cause, they drew on the racial animus of white Southerners with the warning that
White women and White men will be forced into organizations with Black African Apes…whom they will have to call “brother” or lose their jobs. (Pierce 2017)
In another instance, those trying to mobilize racial prejudice in the 1940s against the Congress of Industrial Organizations (CIO)—which supported interracial organizing—produced the flyer shown in Figure A. The flyer shows a photo of George Benjamin, a Black man, with a caption noting that Benjamin had been put in charge of organizing the tobacco workers. In all capital letters it states, “INCLUDING THE WHITE EMPLOYEES.” Ironically, the Tobacco Workers International Union under attack was in fact an American Federation of Labor (AFL) affiliate and was not as supportive of interracial organizing as the CIO (Griffith 1988).
In many Southern states, the campaigns to get RTW laws passed were successful (NCSL 2023). In the 1940s, Florida and Arkansas were the first two states to adopt these anti-worker laws. It is important to emphasize that—contrary to the “right to work” moniker—these laws in no way guarantee workers a right to a job or a right to work; instead, they simply make it more difficult for workers to form and maintain unions.13
Across the South, states have continued to adopt RTW laws, with some legislatures enshrining them in their state constitutions (Ballotpedia 2022). One result is that Southern states have some of the lowest rates of union coverage in the country. While nationally union coverage rates stand at 11.3%, rates were as low as 1.9% in South Carolina, 3.9% in North Carolina, and 5.4% in Georgia in 2022 (BLS 2023).14
The Southern economic development model: A summary
Collectively, these economic policy positions form what we refer to as the Southern economic development model. Most states across the South census region—with the exception of Maryland, Delaware, and the District of Columbia15—adhere to most, if not all, of these components and have adopted a wide range of policies consistent with this model. Some Southern states—such as Alabama, Mississippi, Louisiana, Arkansas, South Carolina, Kentucky, and West Virginia—adhere to this model particularly closely.
Future reports from EPI will delve deeper into the Southern economic development model and how it manifests in specific states across the region.
Throughout the rest of this report, we examine several key indicators of economic well-being for workers and families across the South. We compare the South with other regions and look at variations across states within the South. The data show that those states that adhere most closely to the Southern economic development model fare worse in general than those states that have taken a different path.
The Southern economic development model has failed to promote the economic well-being of workers and families across the South
On the surface, the Southern economic development model may seem purely like a set of economic policy choices. However, as we describe above, it in fact emerged out of efforts in the late 1800s and beyond to maintain racial hierarchies across the South—hierarchies that would ensure continued access to the cheap labor of the newly freed Black population (Harris 1993; Perea 2011).
Below, we use empirical data to refute proponents’ argument that this model creates jobs and overall prosperity. We show that it actually produces worse outcomes for workers and families across the South.
Southern states are well represented among the lowest-GDP states
If the Southern economic development model led to better economic performance, one likely place that would show up would be in measures of state GDP. The gross domestic product, or GDP, is the total value of goods and services produced in an economy. It is a comprehensive measure that represents overall spending by government, the output of businesses and their workers, investments made by actors in the economy, and the trade conducted with economic actors in other jurisdictions. It is an important measure of overall economic trends; a rising per-worker GDP is necessary (although insufficient on its own) to achieve rising living standards for the broad population.
The data indicate that on this overall measure of economic growth, the South does not perform particularly well. Figure B lists the 15 states with the lowest per-worker GDP in 2019 before the COVID-19 recession. Nine of these states are in the South. Mississippi has the lowest per-worker GDP in the nation. The other eight Southern states on the list are Arkansas, Alabama, Kentucky, South Carolina, Florida, Oklahoma, West Virginia, and Tennessee.
Nine of the 15 states with the lowest per-worker GDP are in the South: Per-worker GDP for the U.S. and for the 15 U.S. states with the lowest per-worker state GDP, 2019
| State | Per-worker GDP |
|---|---|
| Mississippi | $75,986 |
| Montana | $80,688 |
| Vermont | $81,715 |
| Idaho | $82,737 |
| Arkansas | $82,916 |
| Maine | $83,807 |
| Alabama | $88,377 |
| Kentucky | $88,737 |
| South Carolina | $90,414 |
| Missouri | $91,061 |
| Florida | $91,205 |
| Oklahoma | $91,626 |
| West Virginia | $93,362 |
| South Dakota | $94,331 |
| Tennessee | $94,890 |
| United States | $111,448 |

Note: States are ranked by the value of their 2019 per-worker GDP. All values are in 2021 dollars.
Source: EPI analysis of Bureau of Economic Analysis, “SAGDP9N Real GDP by State.”
Of the remaining states in the South census region (not shown in Figure B), the majority have per-worker GDPs below the U.S. average. Only Maryland, Delaware, and the District of Columbia have per-worker GDPs above the national average. As noted above, these three jurisdictions adhere less closely to the Southern economic development model than other Southern states.
Job growth across the South largely reflects population growth, not economic growth
The health of an economy is also frequently assessed by looking at job growth. As demand for goods and services grows among the general population, workers are hired to provide those goods and services. When demand is weak or constrained, workers are not hired and some may lose their jobs, further dampening GDP and weakening the growth that can improve living standards.
Many Southern politicians have argued that the policies associated with the Southern economic development model produce greater job growth and that this exceptional job growth creates a “rising tide that lifts all boats.” They point to the strong job growth across the South that has occurred since the late 1970s—i.e., the larger increase in the total number of jobs in the South compared with other regions of the country. When we examine the data, however, we find that job growth across the South largely reflects a growing Southern population.
Various factors largely unrelated to the South’s economic development strategy (e.g., the widespread adoption of air conditioning, proximity to the Southern U.S. border, and increased domestic and international migration) have driven strong population growth in the South (Arsenault 1984; Frey 2023). Yet job growth across the region has lagged population growth since the early 2000s.
Figure C shows that between 1976 and 2001, job growth in the South generally moved in tandem with population growth but never exceeded growth in the working-age population. Since 2001, job growth has failed to keep up with population growth, especially after the Great Recession of 2008–2009. This is in contrast to the Northeast and Midwest regions, where job growth has exceeded population growth for the majority of the more-than-four-decade period.
Job growth across the South fails to keep up with population growth: Job and population growth by region relative to 1976, 1976–2019
South
| Year | Cumulative population growth | Cumulative job growth |
|---|---|---|
| 1976 | 0 | 0 |
| 1977 | 1,267,416 | 1,284,911 |
| 1978 | 2,532,334 | 2,935,998 |
| 1979 | 3,867,584 | 4,059,991 |
| 1980 | 5,201,833 | 4,751,510 |
| 1981 | 6,433,496 | 5,518,831 |
| 1982 | 7,630,166 | 5,620,934 |
| 1983 | 8,669,414 | 6,176,813 |
| 1984 | 9,630,667 | 7,952,282 |
| 1985 | 10,623,832 | 9,113,601 |
| 1986 | 11,513,750 | 9,748,660 |
| 1987 | 12,306,080 | 10,824,988 |
| 1988 | 12,978,833 | 12,122,672 |
| 1989 | 13,662,914 | 13,061,495 |
| 1990 | 14,926,611 | 13,969,456 |
| 1991 | 15,920,162 | 13,933,847 |
| 1992 | 16,877,144 | 14,444,984 |
| 1993 | 17,950,796 | 15,813,687 |
| 1994 | 19,038,362 | 17,142,019 |
| 1995 | 20,133,601 | 18,720,949 |
| 1996 | 21,271,247 | 19,937,982 |
| 1997 | 22,401,896 | 21,446,810 |
| 1998 | 23,498,718 | 22,905,917 |
| 1999 | 24,564,534 | 24,028,049 |
| 2000 | 25,532,544 | 25,459,512 |
| 2001 | 26,581,086 | 25,589,803 |
| 2002 | 27,645,876 | 25,662,589 |
| 2003 | 28,668,719 | 26,159,567 |
| 2004 | 29,824,155 | 27,453,926 |
| 2005 | 31,083,266 | 29,067,334 |
| 2006 | 32,408,346 | 30,734,429 |
| 2007 | 33,769,067 | 32,297,997 |
| 2008 | 34,952,955 | 32,349,656 |
| 2009 | 36,004,988 | 30,545,345 |
| 2010 | 37,706,291 | 30,436,865 |
| 2011 | 39,020,863 | 31,779,969 |
| 2012 | 40,139,552 | 32,850,120 |
| 2013 | 41,230,256 | 34,116,058 |
| 2014 | 42,395,433 | 35,728,792 |
| 2015 | 43,656,009 | 37,341,321 |
| 2016 | 44,927,358 | 38,576,692 |
| 2017 | 45,833,735 | 40,002,604 |
| 2018 | 46,817,141 | 41,765,484 |
| 2019 | 47,814,181 | 43,215,009 |
Midwest
| Cumulative population growth | Cumulative job growth | |
|---|---|---|
| 1977 | 561,002 | 835,704 |
| 1978 | 1,081,584 | 1,813,172 |
| 1979 | 1,521,166 | 2,393,300 |
| 1980 | 1,898,665 | 1,875,964 |
| 1981 | 2,170,500 | 1,644,785 |
| 1982 | 2,287,085 | 968,459 |
| 1983 | 2,349,835 | 1,098,890 |
| 1984 | 2,523,334 | 2,168,187 |
| 1985 | 2,680,416 | 2,774,166 |
| 1986 | 2,970,750 | 3,305,687 |
| 1987 | 3,329,916 | 4,135,027 |
| 1988 | 3,652,667 | 4,896,430 |
| 1989 | 3,844,001 | 5,583,191 |
| 1990 | 3,470,007 | 6,142,720 |
| 1991 | 3,889,290 | 6,112,862 |
| 1992 | 4,289,818 | 6,349,528 |
| 1993 | 4,733,427 | 6,963,787 |
| 1994 | 5,122,040 | 7,960,062 |
| 1995 | 5,534,234 | 8,921,049 |
| 1996 | 5,958,930 | 9,536,491 |
| 1997 | 6,282,790 | 10,163,573 |
| 1998 | 6,579,400 | 10,863,329 |
| 1999 | 6,897,678 | 11,413,574 |
| 2000 | 7,207,812 | 12,104,673 |
| 2001 | 7,558,560 | 11,826,122 |
| 2002 | 7,890,482 | 11,462,053 |
| 2003 | 8,205,664 | 11,411,266 |
| 2004 | 8,499,267 | 11,784,466 |
| 2005 | 8,821,137 | 12,215,113 |
| 2006 | 9,178,117 | 12,606,555 |
| 2007 | 9,507,140 | 13,086,421 |
| 2008 | 9,800,189 | 12,840,347 |
| 2009 | 10,070,862 | 11,435,412 |
| 2010 | 10,295,249 | 11,247,783 |
| 2011 | 10,558,826 | 11,897,743 |
| 2012 | 10,830,835 | 12,349,477 |
| 2013 | 11,102,890 | 12,848,484 |
| 2014 | 11,355,746 | 13,408,073 |
| 2015 | 11,553,299 | 13,986,591 |
| 2016 | 11,760,714 | 14,349,753 |
| 2017 | 12,256,532 | 14,626,495 |
| 2018 | 12,459,014 | 15,084,556 |
| 2019 | 12,656,723 | 15,536,381 |
Northeast
| Cumulative population growth | Cumulative job growth | |
|---|---|---|
| 1977 | 276,082 | 422,204 |
| 1978 | 529,499 | 1,148,365 |
| 1979 | 788,751 | 1,760,831 |
| 1980 | 1,012,084 | 1,912,979 |
| 1981 | 1,317,416 | 2,008,549 |
| 1982 | 1,557,666 | 1,914,197 |
| 1983 | 1,811,251 | 2,162,643 |
| 1984 | 2,063,417 | 3,114,721 |
| 1985 | 2,243,583 | 3,794,339 |
| 1986 | 2,485,333 | 4,418,142 |
| 1987 | 2,737,417 | 4,881,080 |
| 1988 | 2,933,666 | 5,601,253 |
| 1989 | 3,004,751 | 5,786,778 |
| 1990 | 3,312,218 | 5,644,832 |
| 1991 | 3,406,538 | 4,854,629 |
| 1992 | 3,454,512 | 4,824,665 |
| 1993 | 3,581,985 | 5,035,361 |
| 1994 | 3,694,873 | 5,264,244 |
| 1995 | 3,837,681 | 5,567,799 |
| 1996 | 4,035,820 | 5,891,059 |
| 1997 | 4,237,876 | 6,356,642 |
| 1998 | 4,467,515 | 6,882,609 |
| 1999 | 4,712,572 | 7,474,755 |
| 2000 | 4,931,019 | 8,280,281 |
| 2001 | 5,202,122 | 8,359,551 |
| 2002 | 5,478,548 | 8,201,931 |
| 2003 | 5,734,418 | 8,237,511 |
| 2004 | 5,955,742 | 8,645,927 |
| 2005 | 6,180,024 | 9,062,673 |
| 2006 | 6,436,047 | 9,480,184 |
| 2007 | 6,691,971 | 10,108,142 |
| 2008 | 6,954,025 | 10,235,631 |
| 2009 | 7,217,799 | 9,476,141 |
| 2010 | 7,525,380 | 9,440,562 |
| 2011 | 7,831,076 | 9,995,304 |
| 2012 | 8,079,448 | 10,346,035 |
| 2013 | 8,285,356 | 10,831,335 |
| 2014 | 8,463,328 | 11,379,946 |
| 2015 | 8,580,227 | 12,031,171 |
| 2016 | 8,678,966 | 12,482,870 |
| 2017 | 9,689,991 | 12,833,107 |
| 2018 | 9,876,022 | 13,422,552 |
| 2019 | 10,017,315 | 13,972,918 |
West
| Cumulative population growth | Cumulative job growth | |
|---|---|---|
| 1977 | 904,332 | 908,181 |
| 1978 | 1,875,417 | 2,197,865 |
| 1979 | 2,842,750 | 3,341,778 |
| 1980 | 3,774,998 | 3,851,547 |
| 1981 | 4,498,916 | 4,150,635 |
| 1982 | 5,164,500 | 4,068,510 |
| 1983 | 5,763,666 | 4,616,154 |
| 1984 | 6,458,165 | 5,701,710 |
| 1985 | 7,168,249 | 6,523,394 |
| 1986 | 7,874,917 | 7,168,611 |
| 1987 | 8,598,584 | 8,116,105 |
| 1988 | 9,315,082 | 9,352,345 |
| 1989 | 10,056,333 | 10,155,136 |
| 1990 | 11,738,841 | 10,982,692 |
| 1991 | 12,372,253 | 11,120,262 |
| 1992 | 13,150,428 | 10,955,723 |
| 1993 | 13,809,853 | 11,370,365 |
| 1994 | 14,435,776 | 12,239,075 |
| 1995 | 15,065,619 | 13,114,803 |
| 1996 | 15,762,044 | 14,099,468 |
| 1997 | 16,622,385 | 14,982,975 |
| 1998 | 17,484,563 | 16,238,145 |
| 1999 | 18,316,568 | 17,023,722 |
| 2000 | 19,086,338 | 17,935,134 |
| 2001 | 19,932,891 | 18,155,524 |
| 2002 | 20,725,595 | 18,177,327 |
| 2003 | 21,457,733 | 18,521,956 |
| 2004 | 22,216,178 | 19,364,181 |
| 2005 | 23,008,526 | 20,402,080 |
| 2006 | 23,862,658 | 21,456,232 |
| 2007 | 24,653,887 | 22,459,940 |
| 2008 | 25,446,337 | 22,197,066 |
| 2009 | 26,188,500 | 20,588,602 |
| 2010 | 27,046,378 | 20,185,290 |
| 2011 | 27,788,208 | 20,827,484 |
| 2012 | 28,498,237 | 21,842,868 |
| 2013 | 29,186,275 | 22,938,023 |
| 2014 | 29,923,226 | 24,125,789 |
| 2015 | 30,708,957 | 25,375,517 |
| 2016 | 31,520,160 | 26,378,385 |
| 2017 | 32,115,153 | 27,283,694 |
| 2018 | 32,725,780 | 28,420,408 |
| 2019 | 33,272,323 | 29,493,992 |
Notes: Population growth refers to growth of the working-age population ages 16 and older. The composition of each region follows the census definitions.
Population growth refers to growth of the working-age population ages 16 and older. The composition of each region follows the census definitions. The South includes Alabama, Arkansas, Delaware, the District of Columbia, Florida, Georgia, Kentucky, Louisiana, Maryland, Mississippi, North Carolina, Oklahoma, South Carolina, Tennessee, Texas, Virginia, and West Virginia. The Midwest includes Illinois, Indiana, Iowa, Kansas, Michigan, Minnesota, Missouri, Nebraska, North Dakota, Ohio, South Dakota, and Wisconsin. The Northeast includes Connecticut, Maine, Massachusetts, New Hampshire, New Jersey, New York, Pennsylvania, Rhode Island, and Vermont. The West includes Alaska, Arizona, California, Colorado, Hawaii, Idaho, Montana, Nevada, New Mexico, Oregon, Utah, Washington, and Wyoming.
Sources: Population growth based on EPI analysis of population data from the state-level “Employment status of the civilian noninstitutional population, annual averages” from the Bureau of Labor Statistics (https://www.bls.gov/lau/rdscnp16.htm). Data on job growth based on analysis of Regional Economic Information System data from the Bureau of Economic Analysis, U.S. Department of Commerce.
Southern states are well represented among the states with the lowest prime-age employment-to-population (EPOP) ratios
Arguably the best way to assess labor market health is to evaluate whether job growth is providing adequate employment for everyone in their prime working years. We can measure this by looking at the prime-age employment-to-population (EPOP) ratio, which is the share of workers ages 25 to 54 with a job. If the Southern model provided exceptionally strong job growth, we would expect Southern states to have relatively high EPOPs.
Figure D shows the 10 states with the lowest prime-age EPOP. Of the 10 states with the lowest EPOP nationally, seven are Southern states. The five states with the lowest EPOPs—Louisiana, Alabama, New Mexico, Mississippi, and West Virginia—have more than a fourth of their prime-age population out of the workforce; four of these are in the South.
Southern states are well represented among the states with the lowest prime-age EPOPs: Prime-age (ages 25–54) employment-to-population ratios (EPOPs) for the 10 states with the lowest prime-age EPOPs and the U.S. overall
| State | Prime-age EPOP |
|---|---|
| United States | 78.2% |
| Oklahoma | 75.9% |
| California | 75.6% |
| Kentucky | 75.3% |
| Alaska | 75.3% |
| Arkansas | 75.2% |
| Louisiana | 74.6% |
| Alabama | 74.4% |
| New Mexico | 73.0% |
| Mississippi | 73.0% |
| West Virginia | 72.7% |
Note: The prime-age employment-to-population ratio is the share of the population ages 25–54 who are employed.
Source: EPI analysis of 2017–2021 Current Population Survey microdata.
Of the remaining states in the South census region (not shown in Figure D), the majority have prime-age EPOPs below the U.S. average. Only Maryland, Virginia, Delaware, and the District of Columbia have prime-age EPOPs above the national average. As noted above, Maryland, Delaware, and D.C. adhere less closely to the Southern economic development model than other Southern states.
Many of the workers missing from the EPOPs are not in the labor force at all—they are not employed and they are not looking for work. While there are a variety of reasons why prime-age workers would leave the labor market, one of the most common reasons is they have become discouraged. They have been unable to find suitable work or they face obstacles—such as the need for child care or transportation—that prevent them from seeking or keeping employment.
Workers in Southern states tend to have lower earnings even after adjusting for regional differences in the cost of living
Table 1 shows the nominal median annual earnings and median annual earnings adjusted for regional differences in the cost of living for all 50 states and the District of Columbia. States are ranked from highest to lowest cost-of-living-adjusted earnings. States in the South census region are marked with an asterisk.
Three Southern states—Maryland, Virginia, Delaware—and the District of Columbia are among the top 20 highest-earning states. As noted previously, three of these jurisdictions—Maryland, Delaware, and D.C.—do not adhere to the Southern economic development model as closely as the nine Southern states that fall into the 20 lowest-earning states. Three states that adhere particularly closely to this model—Florida, South Carolina, and Mississippi—fall into the 10 lowest-earning states.
State median earnings adjusted for cost of living, 2019
| State | Median earnings | Cost-of-living-adjusted median earnings |
|---|---|---|
| *District of Columbia | $74,936 | $65,049 |
| Connecticut | $61,573 | $58,641 |
| Massachusetts | $62,870 | $56,947 |
| *Maryland | $60,227 | $55,921 |
| North Dakota | $49,190 | $55,084 |
| Minnesota | $52,924 | $54,004 |
| Ohio | $47,369 | $53,585 |
| Illinois | $52,185 | $53,578 |
| *Virginia | $53,540 | $52,853 |
| New Jersey | $60,929 | $52,525 |
| Rhode Island | $53,194 | $52,511 |
| Michigan | $48,463 | $52,506 |
| Wyoming | $48,707 | $52,486 |
| Iowa | $46,671 | $52,439 |
| Wisconsin | $48,112 | $52,353 |
| Alaska | $54,638 | $51,987 |
| Pennsylvania | $50,200 | $51,753 |
| Washington | $55,975 | $51,637 |
| *Delaware | $51,095 | $51,403 |
| Nebraska | $45,814 | $51,189 |
| Colorado | $52,122 | $51,150 |
| Kansas | $45,585 | $51,104 |
| Indiana | $45,072 | $50,814 |
| New Hampshire | $53,961 | $50,668 |
| *Alabama | $42,852 | $49,944 |
| *Louisiana | $43,842 | $49,877 |
| Utah | $48,055 | $49,798 |
| Missouri | $44,158 | $49,784 |
| *Kentucky | $43,021 | $49,223 |
| South Dakota | $42,733 | $48,671 |
| *Georgia | $44,775 | $48,042 |
| Oregon | $49,064 | $48,008 |
| *Oklahoma | $41,808 | $47,945 |
| *West Virginia | $41,614 | $47,777 |
| *Texas | $46,073 | $47,744 |
| *North Carolina | $43,409 | $47,338 |
| *Tennessee | $42,415 | $47,285 |
| *Arkansas | $39,967 | $47,187 |
| New York | $54,473 | $46,838 |
| Maine | $46,215 | $46,541 |
| Arizona | $44,816 | $46,538 |
| Vermont | $47,865 | $46,426 |
| *Mississippi | $39,178 | $46,419 |
| Idaho | $42,417 | $46,005 |
| *South Carolina | $42,021 | $45,925 |
| Montana | $42,697 | $45,665 |
| New Mexico | $41,368 | $45,409 |
| California | $52,683 | $45,260 |
| Nevada | $43,392 | $44,550 |
| *Florida | $41,636 | $41,224 |
| Hawaii | $48,703 | $40,824 |
Notes: Earnings are adjusted for state-level variations in cost of living. States in the South census region are marked with asterisks.
Sources: Unadjusted 2019 median earnings for full-time, year-round workers by states are taken from the American Community Survey Table S2001. The 2019 Regional Price Parities are taken from the U.S. Department of Commerce, Bureau of Economic Analysis Regional Price Parity by State and Metropolitan Statistical Areas.
Wages are even lower for some groups in the South. Table 2 highlights dramatic differences in earnings across the region by gender and race/ethnicity. The state-level median earnings listed in Table 1 may not be representative of the typical earnings of Black and Hispanic workers in those states, especially Black and Hispanic women, who are generally paid even less than their male counterparts. On average, Black women in the South are paid $35,884 at the median and Hispanic women just $30,984, compared with $58,008 for white men.
Median earnings in the South by gender and race/ethnicity, 2019
| Men | Women | |
|---|---|---|
| All | $50,427 | $40,516 |
| White | $58,008 | $45,193 |
| Black | $40,419 | $35,884 |
| Hispanic | $37,632 | $30,984 |
Note: White workers are non-Hispanic, while Hispanic workers can be of any race.
Source: Author’s analysis of American Community Survey tables B20017, B20017H, B20017B, and B20017I.
Poverty rates in most Southern states are higher than the national rate
Arguably the best-known measure of economic well-being is the official poverty rate. According to the official poverty measure, a family of four with two minor children in 2019 would fall below the poverty line if their family income was less than $26,000. Figure E shows official poverty rates for each state in the South and for the nation as a whole in 2019. The data provide a clear indicator that the Southern economic development model is leaving large numbers of Southerners in dire economic conditions.
Most Southern states have poverty rates above the national average: Poverty rates in Southern states and the U.S., 2019
| State | Poverty rate |
|---|---|
| Mississippi | 19.6% |
| Louisiana | 19.0% |
| Kentucky | 16.3% |
| Arkansas | 16.2% |
| West Virginia | 16.0% |
| Alabama | 15.5% |
| Oklahoma | 15.2% |
| Tennessee | 13.9% |
| South Carolina | 13.8% |
| Texas | 13.6% |
| North Carolina | 13.6% |
| District of Columbia | 13.5% |
| Georgia | 13.3% |
| Florida | 12.7% |
| United States | 12.3% |
| Delaware | 11.3% |
| Virginia | 9.9% |
| Maryland | 9.0% |
Source: Author’s analysis of American Community Survey table S1703 for 2019.
The poverty rate nationally, at 12.3%, is much higher than it should be in a nation as wealthy as the United States. However, the poverty rate is significantly higher in many states across the South. Almost 1 in 5 residents in Mississippi and Louisiana fall below the poverty line. Only three states in the South have a poverty rate below the national rate: Delaware, Virginia, and Maryland. As noted above, Maryland and Delaware do not adhere as closely to the Southern economic development model as other states in the South census region.
While overall poverty rates across the South are appalling, when we consider differences by race and ethnicity they become even more so. Black women across the South have a poverty rate of 20.0% and Hispanic women are at 18.5% (see Figure F).
One in 5 Black women and almost as many Hispanic women live in poverty across the South: Poverty rates in the South by gender and race/ethnicity, 2019
| Race/ethnicity | Men | Women |
|---|---|---|
| White | 8.2% | 10.8% |
| Black | 15.7% | 20.0% |
| Hispanic | 12.4% | 18.5% |
| AAPI | 8.7% | 9.6% |
Notes: White is non-Hispanic white, while Hispanic can be of any race. AAPI stands for Asian American and Pacific Islander.
Source: EPI analysis of the 2019 American Community Survey.
These extremely high rates of poverty—roughly 1 in 5 women—are not due to unwillingness to work. Black women in fact have a higher prime-age employment-to-population ratio than women from any other racial or ethnic group in the South.16
Table 3 shows that Black women in the South have a higher poverty rate than Black women in the Northeast (19.0%) or the West (19.2%), although Black women’s poverty rates are highest in the Midwest (23.4%). Black men’s poverty rates across the South (15.7%) are higher than in the West (15.5%) but lower than in the Northeast (16.0%) and the Midwest (20.1%). Extreme disparities by race/ethnicity and gender in the U.S. are not limited by geographic boundaries.
Poverty rates by race/ethnicity, gender, and region, 2019
| White | Black | Hispanic | AAPI | |||||
|---|---|---|---|---|---|---|---|---|
| Region | Men | Women | Men | Women | Men | Women | Men | Women |
| South | 8.2% | 10.8% | 15.7% | 20.0% | 12.4% | 18.5% | 8.7% | 9.6% |
| Midwest | 7.5% | 10.1% | 20.1% | 23.4% | 11.6% | 16.9% | 11.0% | 11.2% |
| Northeast | 6.7% | 8.6% | 16.0% | 19.0% | 13.9% | 20.6% | 10.4% | 11.4% |
| West | 7.8% | 9.5% | 15.5% | 19.2% | 11.3% | 15.7% | 8.9% | 9.8% |
Notes: White workers are non-Hispanic, while Hispanic workers can be of any race. AAPI stands for Asian American and Pacific Islander.
Source: EPI analysis of the 2019 American Community Survey.
Hispanic men and women have the highest poverty rates in the Northeast (13.9% and 20.6%, respectively), followed by the South (12.4% and 18.5%). Their lowest poverty rates are in the West (11.3% and 15.7%) and the Midwest (11.6% and 16.9%).
Asian American and Pacific Islander (AAPI) men and women living in the South actually have lower poverty rates than AAPI men and women in other regions. In the South, their poverty rates are 8.7% and 9.6%, respectively. These are lower than in the West (8.9% and 9.8%), the Northeast (10.4% and 11.4%), or the Midwest (11.0% and 11.2%). Lower rates of poverty among AAPI men and women in the South likely reflect the fact that they tend to live in higher-earning Southern states such as Maryland (Childers 2023c).
Finally, white men and women across the South have much lower poverty rates than Black and Hispanic Southerners but have higher poverty rates than white men and women in any other region. In the South, white men and women have poverty rates of 8.2% and 10.8%, respectively, while in the Midwest their poverty rates are 7.5% and 10.1% and, in the West, 7.8% and 9.5%. Their poverty rates are lowest in the Northeast, at 6.7% and 8.6%.
One reason Black women’s poverty rates remain high in the South—despite a relatively high EPOP—is that they are disproportionately employed in jobs consistent with the occupations they were largely limited to during and after the end of slavery: care work, cleaning, and food production, including agricultural and animal slaughter work. Because this work is largely done by Black, brown, and immigrant workers, consistent with the Southern economic development model, these jobs pay very low wages.
While Black and Hispanic men are paid more than Black and Hispanic women in the South, their earnings are lower than white men’s earnings. This means that among two-adult households, Black and Hispanic households are more likely to rely on Black and Hispanic women’s earnings to meet household needs than white households do. Black women in particular are frequently co-breadwinners in their households (Banks 2019; Glynn 2019).
Child poverty is higher in the South than in any other region
Low wages across the South also mean that many children will suffer economic hardships. Their parents’ earnings determine to a great degree the resources available to them, especially when public safety nets are as limited as they are across most of the South. Figure G shows the geographic distribution of all U.S. children living in households where the household head is paid less than $10.00 per hour. More than half of these children, 53.4%, live in Southern states.
More than half of all children in households where the head is paid less than $10 per hour are in the South: Share of all children in households earning less than $10 per hour by region, 2018–2021
| Region | Share of all children in households earnings less than $10/hr |
|---|---|
| South | 53.4% |
| Midwest | 20.2% |
| Northeast | 11.7% |
| West | 14.8% |
Source: EPI analysis of 2018–2021 pooled Current Population Survey Outgoing Rotation Group data.
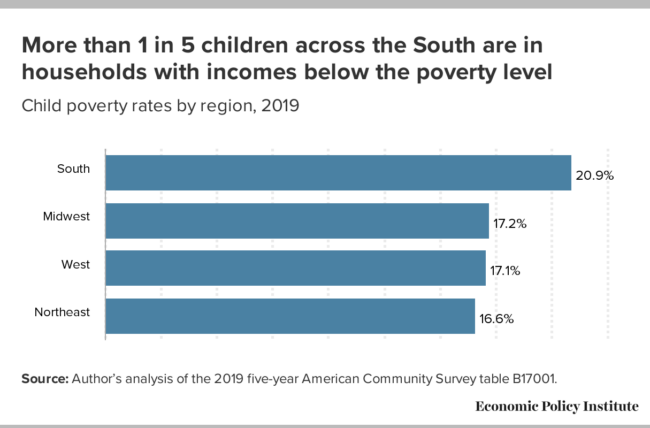
The large number of Southern children in households where the head of household is paid less than $10.00 per hour, and high rates of poverty overall, mean that many children across the South live in poverty. Figure H shows that child poverty is significantly higher in the South than in other regions. At 20.9%, child poverty rates in the South are 3.7 percentage points higher than the region with the next-highest child poverty rate, the Midwest at 17.2%. While child poverty across the South is clearly worse than in other regions, it is troubling that the lowest regional rate nationwide is as high as 16.6%, in the Northeast.
More than 1 in 5 children across the South are in households with incomes below the poverty level: Child poverty rates by region, 2019
| Region | Child poverty rate |
|---|---|
| South | 20.9% |
| Midwest | 17.2% |
| West | 17.1% |
| Northeast | 16.6% |
Source: Author’s analysis of the 2019 five-year American Community Survey table B17001.
The high overall child poverty rates obscure extreme racial inequities in child poverty. As seen in Figure I, across Southern states, Asian American children have the lowest poverty rates, at 9.9%, followed by 12.5% of non-Hispanic white children. The next-highest rate is more than double that; 26.3% of American Indian and Alaska Native children, 28.1% of Hispanic children, and 33.0% of Black children live in poverty across the South.
Child poverty is particularly high among Black, Hispanic, and AIAN children in the South: Child poverty rates by race and ethnicity in the South, 2019
| Race/ethnicity | Child poverty rate |
|---|---|
| Black | 33.0% |
| Hispanic | 28.1% |
| AIAN | 26.3% |
| White | 12.5% |
| Asian | 9.9% |
Notes: AIAN stands for American Indian and Alaska Native. White is non-Hispanic white, while Hispanic can be of any race.
Source: Author’s analysis of the 2019 five-year American Community Survey tables B17001B, B17001C, B17001D, B17001H, B17001I.
High levels of income inequality are seen in every state across the South
In this final section, we consider how the Southern economic development model has performed in addressing income inequality. Figure J shows the share of all household income that goes to the top 5%, the top 20%, and the bottom 20% of households in each Southern state and across the U.S.
Policies across Southern states do not reduce inequality: Share of aggregate income going to the top and bottom quintiles, U.S. and Southern states, 2019
| State | Share to bottom 20% | Share to top 5% | Share to top 20% |
|---|---|---|---|
| United States | 3.2% | 23.3% | 51.6% |
| Delaware | 3.5% | 21.0% | 48.7% |
| Maryland | 3.3% | 21.0% | 49.1% |
| West Virginia | 3.2% | 21.3% | 49.6% |
| Virginia | 3.3% | 21.7% | 50.5% |
| Alabama | 3.1% | 21.8% | 50.5% |
| Kentucky | 3.2% | 23.1% | 50.8% |
| Oklahoma | 3.3% | 23.3% | 50.9% |
| South Carolina | 3.2% | 22.7% | 50.9% |
| Arkansas | 3.4% | 23.1% | 51.0% |
| North Carolina | 3.3% | 23.0% | 51.0% |
| Texas | 3.3% | 22.8% | 51.1% |
| Tennessee | 3.4% | 23.5% | 51.1% |
| Georgia | 3.2% | 23.3% | 51.4% |
| Florida | 3.4% | 24.1% | 51.9% |
| Mississippi | 3.0% | 23.4% | 52.0% |
| Louisiana | 2.6% | 23.2% | 52.3% |
| District of Columbia | 2.0% | 23.7% | 53.4% |
Source: EPI analysis of American Community Survey table B19082, “Shares of Income by Quintile.”
In every Southern state, more than 20% of all household income goes to just the richest 5% of households. In most Southern states, more than 50.0% of all household income goes to the richest 20%. The bottom 80% of households share the remaining 50%, with the bottom 20% sharing between 2.0% and 3.5% of all household income. Further, the share to the top 5% has increased over the last decade and the share to the bottom 20% has declined (not shown in Figure J).17
It is important to note here that this is the one indicator on which the South does not differ from the rest of the nation. Though the South has not performed worse than the rest of the country on this particular measure, it also has not performed any better. Indeed, this pattern of inequality holds for every state in the nation.
Conclusion
Efforts to instigate racial division today may not be as overt as the flyers featuring George Benjamin, but we know that racial dog whistles are still at play across the South. When states gerrymander maps to dilute the voting strength of Black and brown residents or engage in voter suppression, or when wages are kept low in jobs held primarily by Black, brown, and immigrant workers, this is all done in the service of maintaining a racial hierarchy across the South.
Many Southerners may believe their politician’s arguments that the Southern economic development model will deliver good, well-paying jobs. However, the data presented here show clearly and emphatically that this model has failed those living in Southern states. This economic model has garnered vast amounts of riches for the wealthiest and most powerful people across the region but is leaving most Southerners with low wages, underfunded public services, a weak safety net in times of economic downturns, deep racial divisions, and high rates of poverty.
The failed Southern economic development model is still being used to maintain the color line across the South and to exploit and oppress Black, Hispanic, Indigenous, poor, and women residents. While these exploited groups face the greatest hurdles to social and economic security, all Southerners are harmed by this failed model.
Notes
1. In this report we follow the definition of the South used by the U.S. Census Bureau, which includes Alabama, Arkansas, Delaware, the District of Columbia, Florida, Georgia, Kentucky, Louisiana, Maryland, Mississippi, North Carolina, Oklahoma, South Carolina, Tennessee, Texas, Virginia, and West Virginia.
2. Census-defined regions outside the South include the Midwest, the Northeast, and the West. The Midwest includes Illinois, Indiana, Iowa, Kansas, Michigan, Minnesota, Missouri, Nebraska, North Dakota, Ohio, South Dakota, and Wisconsin. The Northeast includes Connecticut, Maine, Massachusetts, New Hampshire, New Jersey, New York, Pennsylvania, Rhode Island, and Vermont. The West includes Alaska, Arizona, California, Colorado, Hawaii, Idaho, Montana, Nevada, New Mexico, Oregon, Utah, Washington, and Wyoming.
3. States in other regions may draw on some components of the Southern economic development model, for example, lowering tax rates or implementing so-called right-to-work laws. States across the South, however, are much more likely to consistently implement all or almost all components of the model and to implement them to a greater degree.
4. See Cooper and Kroeger 2017 for descriptions of other forms of wage theft.
5. Texas v. Biden (S.D. Tx. 2022).
6. As of September 1, 2023, the sales tax on food in Alabama dropped from 4.0% to 3.0%. For more information, see Sell 2023.
7. North Carolina has adopted the expansion, but as of September 2023 it had not yet been implemented; implementation is dependent on the passage of the 2023–2024 budget. Virginia and Oklahoma adopted the Medicaid expansion in 2019 and 2021, respectively (KFF 2023).
8. ADC was changed to AFDC in 1962.
9. The Midwest states spending 10% or less are North Dakota, Michigan, Illinois, Indiana, Missouri, and Kansas. The Northeastern states are Connecticut and New Jersey. See this map (Azevedo-McCaffrey and Safawi, Figure 2).
10. For a graphic representation of change in the real value of TANF benefits, see this chart (Thompson, Azevedo-McCaffrey, and Carr 2023, Figure 2).
11. See also King v. Smith, 392 U.S. 309 (1968).
12. See also King v. Smith, 392 U.S. 309 (1968).
13. For more information on RTW, see Sherer and Gould 2023.
14. See BLS 2023 for union membership and union coverage rates for all states.
15. For simplicity, we refer to the District of Columbia as a state in this report.
16. EPI analysis of the 2017–2021 Current Population Survey Basic data. Data on the prime-age EPOP by race/ethnicity and gender in the South will be examined in more detail in a forthcoming report (Childers 2023a).
17. EPI analysis of American Community Survey Table B19082, “Shares of Income by Quintile,” from the U.S. Census Bureau. Analysis of income distribution in the Southern states over time will be discussed in a forthcoming report (Childers 2023b).
References
AFL-CIO. 2014. “A Brief History of Labor, Race and Solidarity” (web page). American Federation of Labor and Congress of Industrial Organizations.
AFL-CIO. n.d. “A. Philip Randolph” (web page). American Federation of Labor and Congress of Industrial Organizations.
Akinyemiju, Tomi, Megha Jha, Justin Xavier Moore, and Maria Pisu. 2016. “Disparities in the Prevalence of Comorbidities Among US Adults by State Medicaid Expansion Status.” National Institute of Health.
Allegretto, Sylvia, and David Cooper. 2014. Twenty-Three Years and Still Waiting for Change: Why It’s Time to Give Tipped Workers the Regular Minimum Wage. Economic Policy Institute, July 2014.
American Civil Liberties Union and Global Human Rights Clinic (ACLU and GHRC). 2022. Captive Labor: Exploitation of Incarcerated Workers.
Arnesen, Eric. 2003. “Specter of the Black Strikebreaker: Race, Employment, and Labor Activism in the Industrial Era.” Labor History 44, no. 3: 319–335. https://doi.org/10.1080/002365603200012946.
Arsenault, Raymond. 1984. “The End of the Long Hot Summer: The Air Conditioner and Southern Culture.” Journal of Southern History 50, no. 4: 597–628.
Azevedo-McCaffrey, Diana, and Ali Safawi. 2022. To Promote Equity, States Should Invest More TANF Dollars in Basic Assistance. Center on Budget and Policy Priorities, January 2022.
Ballotpedia. 2022. Tennessee Constitutional Amendment 1, Right-to-Work Amendment (2022).
Banerjee, Asha, Margaret Poydock, Celine McNicholas, Ihna Mangundayao, and Ali Sait. 2021. Unions Are Not Only Good for Workers, They’re Good for Communities and for Democracy. Economic Policy Institute, December 2021.
Banks, Nina. 2019. “Black Women’s Labor Market History Reveals Deep-Seated Race and Gender Discrimination.” Working Economics Blog (Economic Policy Institute), February 19, 2019.
Bienkowski, Brian. 2016. “Toxic Coal Ash Hits Poor and Minority Communities Hardest.” Scientific American, January 14, 2016.
Bivens, Josh, and Asha Banerjee. 2021. How to Boost Unemployment Insurance as a Macroeconomic Stabilizer: Lessons from the 2020 Pandemic Programs. Economic Policy Institute, October 2021.
Bivens, Josh, Melissa Boteach, Rachel Deutsch, Francisco Díez, Rebecca Dixon, Brian Galle, Alix Gould-Werth, Nicole Marquez, Lily Roberts, Heidi Shierholz, William Spriggs, and Andrew Stettner. 2021. “Primer: How the Unemployment Insurance System Operates.” In Reforming Unemployment Insurance: Stabilizing a System in Crisis and Laying the Foundation for Equity, a joint project of Center for American Progress, Center for Popular Democracy, Economic Policy Institute, Groundwork Collaborative, National Employment Law Project, National Women’s Law Center, and Washington Center for Equitable Growth, June 2021.
Bivens, Josh, Celine McNicholas, Kyle K. Moore, and Margaret Poydock. 2023. Unions Promote Racial Equity. Economic Policy Institute, July 2023.
Bureau of Economic Analysis (BEA). 2023. “SAGDP9N Real GDP by State.”
Bureau of Labor Statistics (BLS). 2023. “Union Members—2022” (news release). January 19, 2023.
Center on Budget and Policy Priorities (CBPP). 2022. Policy Basics: Temporary Assistance for Needy Families. Updated March 2022.
The Century Foundation. 2023. Unemployment Insurance Data Dashboard. Accessed July 2023.
Childers, Chandra. 2023a. Rooted in Racism and Economic Exploitation: A Closer Look at the “Southern Miracle.” Economic Policy Institute, forthcoming 2023.
Childers, Chandra. 2023b. Rooted in Racism and Economic Exploitation: Poverty, Inequality, and Mobility Across the South. Economic Policy Institute, forthcoming 2023.
Childers, Chandra. 2023c. Rooted in Racism and Economic Exploitation: The Racist Roots and Evolution of the Southern Economic Development Strategy. Economic Policy Institute, forthcoming 2023.
Childers, Chandra, Marokey Sawo, and Jaimie Worker. 2022. “State Policy Solutions for Good Home Health Care Jobs—Nearly Half Held by Black Women in the South—Should Address the Legacy of Racism, Sexism, and Xenophobia in the Workforce.” Working Economics Blog (Economic Policy Institute), August 15, 2022.
Cooper, David, and Teresa Kroeger. 2017. Employers Steal Billions from Workers’ Paychecks Each Year: Survey Data Show Millions of Workers Are Paid Less Than the Minimum Wage, at Significant Cost to Taxpayers and State Economies. Economic Policy Institute, May 2017.
Das, Kamolika. 2022a. Creating Racially and Economically Equitable Tax Policy in the South. Institute on Taxation and Economic Policy, June 2022.
Das, Kamolika. 2022b. Most States Used Surpluses to Reduce Taxes but Not in Sustainable or Progressive Ways. Institute on Taxation and Economic Policy, July 2022.
Department of Health and Human Services (DHHS). n.d. “Aid to Families with Dependent Children (AFDC) and Temporary Assistance for Needy Families (TANF)—Overview” (web page). Office of the Assistant Secretary for Planning and Evaluation.
Dixon, Rebecca. 2021. From Excluded to Essential: Tracing the Racist Exclusion of Farmworkers, Domestic Workers, and Tipped Workers from the Fair Labor Standards Act. National Employment Law Project, May 2021.
Donaghy, Timothy Q., Noel Healy, Charles Y. Jiang, and Colette Pichon Battle. 2023. “Fossil Fuel Racism in the United States: How Phasing Out Coal, Oil, and Gas Can Protect Communities.” Energy Research and Social Science, vol. 100 (June 2023).
Economic Policy Institute (EPI). 2023. Minimum Wage Tracker. Last updated July 1, 2023.
Edwards, Kathryn A. 2020. “The Racial Disparity in Unemployment Benefits.” RAND Blog, July 15, 2020.
Fleischman, Lesley, and Marcus Franklin. 2017. Fumes Across the Fence-Line: The Health Impacts of Air Pollution from Oil and Gas Facilities on African American Communities. NAACP and Clean Air Task Force, November 2017.
Florida Policy Institute. 2022. “Enforcing the Minimum Wage: Statewide Wage Theft Threatens the Potential Gains of Amendment 2.”
Floyd, Ife, and LaDonna Pavetti. 2022. Improvements in TANF Cash Benefits Needed to Undo the Legacy of Historical Racism. Center on Budget and Policy Priorities, January 2022.
Floyd, Ife, LaDonna Pavetti, Laura Meyer, Ali Safawi, Liz Schott, Evelyn Bellew, and Abigail Magnus. 2021. TANF Policies Reflect Racist Legacy of Cash Assistance: Reimagined Program Should Center Black Mothers. Center on Budget and Policy Priorities, August 2021.
Freeman, Richard, Eunice Han, David Madland, and Brendan V. Duke. 2015. “How Does Declining Unionism Affect the American Middle Class and Intergenerational Mobility?” National Bureau of Economic Research (NBER) Working Paper no. 21638.
Frey, William H. 2023. “Table C. State Net International Migration, Natural Increase, and Net Domestic Migration, 2018–2019, 2019–2020, 2020–2021, and 2021–2022” (downloadable Excel file). In New Census Estimates Show a Tepid Rise in U.S. Population Growth, Buoyed by Immigration. Brookings, January 2023.
Frymer, Paul, and Jacob M. Grumbach. 2021. “Labor Unions and White Racial Politics.” American Journal of Political Science 65, no. 1: 225–240. https://doi.org/10.1111/ajps.12537.
Glynn, Sarah Jane. 2019. Breadwinning Mothers Continue to Be the U.S. Norm. Center for American Progress, May 2019.
Good Jobs First. 2023a. Subsidy Tracker. Accessed June 2023.
Good Jobs First. 2023b. “Subsidy Tracker Individual Entry: Scout Motors.” Accessed June 2023. Data for 2023.
Good Jobs First. 2023c. “Subsidy Tracker Individual Entry: Steel Dynamics.” Accessed June 2023. Data for 2022.
Gordon, Linda, and Felice Batlan. 2011. “The Legal History of the Aid to Dependent Children Program.” Social Welfare History Project.
Griffith, Barbara S. 1988. The Crisis of American Labor: Operation Dixie and the Defeat of the CIO. Philadelphia: Temple University Press.
Haney López, Ian. 2014. Dog Whistle Politics: How Coded Racial Appeals Have Reinvented Racism and Wrecked the Middle Class. New York: Oxford University Press.
Harris, Cheryl I. 1993. “Whiteness as Property.” Harvard Law Review 106, no. 8: 1707–1791.
Hill, Herbert. 1959. “Labor Unions and the Negro: The Record of Discrimination.” Commentary, December 1959.
Kaiser Family Foundation (KFF). 2023. Status of State Medicaid Expansion Decisions: Interactive Map. October 2023.
Mangundayao, Ihna, Celine McNicholas, Margaret Poydock, and Ali Sait. 2021. More Than $3 Billion in Stolen Wages Recovered for Workers Between 2017 and 2020. Economic Policy Institute, December 2021.
McGhee, Heather. 2021. The Sum of Us: What Racism Costs Everyone and How We Can Prosper Together. New York: One World.
Mishel, Lawrence. 2021. The Enormous Impact of Eroded Collective Bargaining on Wages. Economic Policy Institute, April 2021.
Mishel, Lawrence, Lynn Rhinehart, and Lane Windham. 2020. Explaining the Erosion of Private-Sector Unions: How Corporate Practices and Legal Changes Have Undercut the Ability of Workers to Organize and Bargain. Economic Policy Institute, November 2020.
National Conference of State Legislatures (NCSL). 2023. Right-to-Work Resources.
O’Connor, Michael. 1969. “Welfare Law—Aid to Dependent Children and the Substitute Parent Regulation—The State Loses a Scapegoat, the ‘Man-in-the-House.’” DePaul Law Review 18, no. 2: 897–906.
One Fair Wage, Food Labor Research Center at University of California, Berkeley, and National Black Workers’ Center Project. 2021. Ending a Legacy of Slavery: How Biden’s COVID Relief Plan Cures the Racist Subminimum Wage. February 2021.
Perea, Juan F. 2011. “The Echoes of Slavery: Recognizing the Racist Origins of the Agricultural and Domestic Worker Exclusion from the National Labor Relations Act.” Loyola University Chicago, School of Law.
Pierce, Michael. 2017. “The Origins of Right-to-Work: Vance Muse, Anti-Semitism, and the Maintenance of Jim Crow Labor Relations.” LaborOnline (The Labor and Working-Class History Association blog), January 12, 2017.
Robertson, Cassandra, Marokey Sawo, and David Cooper. 2022. All States Must Set Higher Wage Benchmarks for Home Health Care Workers. Economic Policy Institute, June 2022.
Sawo, Marokey, and Asha Banerjee. 2021. “The Racist Campaign Against ‘Critical Race Theory’ Threatens Democracy and Economic Transformation.” Working Economics Blog (Economic Policy Institute), August 9, 2021.
Schweitzer, Justin. 2021. Ending the Tipped Minimum Wage Will Reduce Poverty and Inequality. Center for American Progress, March 2021.
Sell, Mary. 2023. “Grocery Sales Tax Cut Kicks in on Friday.” Alabama Daily News, August 31, 2023.
Sherer, Jennifer, and Elise Gould. 2023. “Why ‘Right-to-Work’ Was Always Wrong for Michigan: Restoring Workers’ Rights Is Key to Reversing Growing Income Inequality in Michigan.” Working Economics Blog (Economic Policy Institute), March 13, 2023.
Shrivastava, Aditi, and Gina Azito Thompson. 2022. Cash Assistance Should Reach Millions More Families to Lessen Hardship: Access to TANF Hits Lowest Point Amid Precarious Economic Conditions. Center on Budget and Policy Priorities, February 2022.
Southern Environmental Law Center (SELC). 2019. “NC Settlement Results in Largest Coal Ash Cleanup in America: Community Groups, N.C. DEQ and Duke Energy Reach Settlement to Clean Up Coal Ash at Six North Carolina Sites” (press release). December 31, 2019.
Tax Policy Center. 2023. State Sales Tax Rates. Rates as of January 1, 2023.
Terrell, Kimberly A., and Gianna St. Julien. 2022. “Air Pollution Is Linked to Higher Cancer Rates Among Black or Impoverished Communities in Louisiana.” Environmental Research Letters 17.
Terrell, Kimberly A., and Gianna St. Julien. 2023. “Discriminatory Outcomes of Industrial Air Permitting in Louisiana, United States.” Environmental Challenges, vol. 10. https://doi.org/10.1016/j.envc.2022.100672.
Thompson, Gina Azito, Diana Azevedo-McCaffrey, and Da’Shon Carr. 2023. Increases in TANF Cash Benefit Levels Are Critical to Help Families Meeting Rising Costs. Center on Budget and Policy Priorities, February 2023.
Traub, Amy, and Kim Diehl. 2022. Reforming Unemployment Insurance Is a Racial Justice Imperative. National Employment Law Project, February 2022.
Tye, Larry. 2005. Rising from the Rails: Pullman Porters and the Making of the Black Middle Class. New York: Henry Holt.
Waldman, Peter. 2017. “Inside Alabama’s Auto Jobs Boom: Cheap Wages, Little Training, Crushed Limbs: The South’s Manufacturing Renaissance Comes with a Heavy Price.” Bloomberg, March 23, 2017.
Wiehe, Meg, Aidan Davis, Carl Davis, Matt Gardner, Lisa Christensen Gee, and Dylan Grundman. 2018. Who Pays? A Distributional Analysis of the Tax Systems in All 50 States. Institute on Taxation and Economic Policy, October 2018.
Williamson, Vanessa. 2021. “The Austerity Politics of White Supremacy.” Dissent, Winter 2021.
Young, Caitlin. 2023. “What Policymakers Need to Know About Racism in the Property Tax System.” Urban Institute, March 15, 2023.
Correction
Figure B was corrected to indicate that it shows per-worker GDP in the U.S. and by state. A prior version incorrectly identified it as per capita GDP. (October 18, 2023)