NLRB uses new tool to help us understand our rights
Not long ago, I blogged about the fact that our key labor law, the National Labor Relations Act, protects workers even if they don’t have a union or seek to have one represent them. When workers join together to protest working conditions, to petition management for raises or plead against pay cuts, or to report unsafe conditions to government agencies, the National Labor Relations Board backs them up. The NLRB can protect workers against retaliation by the employer, can order reinstatement for fired workers, and can obtain back pay.
It isn’t widely known, but since its inception, the National Labor Relations Act has given employees the right “to engage in … concerted activities for the purpose of collective bargaining or other mutual aid or protection.”
Now, for the first time, the NLRB has a nice-looking, somewhat interactive webpage devoted to this issue of “other mutual aid or protection.” Visitors to the site can read some heartening stories about how employers overreacted—almost always by firing someone—, to employees organizing to protest or to make a problem known to management and how the NLRB intervened to restore the job or lost wages of the workers.
It’s great to see the government helping people understand their rights and how to enforce them.
Failure to stimulate recovery is costing trillions in lost national income
In a recent blog post on the (negligible, if not nonexistent) long-run economic cost of deficit-financed fiscal stimulus at present, I noted in passing that the Congressional Budget Office (CBO) has downwardly revised potential economic output for 2017 by 6.6 percent since the start of the recession. This may seem trivial, but for a $15 trillion economy, this dip reflects roughly $1.3 trillion in lost future income in a single year, on top of years of cumulative forgone income (already at roughly $3 trillion and counting). The level of potential output projected for 2017 before the recession is now expected to be reached between 2019 and 2020—representing roughly two-and-a-half years of forgone potential income. This represents a failure of economic policy and merits considerably more attention than received, especially when weighing the benefit of near-term fiscal stimulus versus deficit reduction.
Potential output is the estimated level of economic activity that would occur if the economy’s productive resources were fully utilized—in the case of labor, this means something like a 5 percent unemployment rate rather than today’s 8.2 percent. Potential output is not a pure ceiling for economic activity, but the level of economic activity above which resource scarcity is believed to build inflationary pressures. As of the first quarter of 2012, the U.S. economy was running $861 billion (or 5.3 percent) below potential output—the shortfall known as the “output gap.” This has a number of implications for federal fiscal policy:
- Deficit-financed fiscal stimulus will have a very high bang-per-buck while large output gaps persist. The government spending multiplier is much larger in recessions than expansions (see Figure 3 of Auerbach and Gorodnichenko 2011) and the U.S. remains mired in recessionary conditions, where economic growth is insufficient to restore full employment.
- Deficit-financed fiscal stimulus is largely self-financing because every dollar of increased output relative to potential output is associated with a cyclical $0.37 reduction in budget deficits, and this feedback effect is greatly amplified by the large government spending multiplier.
- There is so much slack in the U.S. economy—i.e., supply of resources in excess of demand—that government borrowing will not “crowd-out” productive private investment; this can be seen in the near record-low 1.6 percent yield on 10-year U.S. Treasuries.
So deficit-financed fiscal stimulus is highly cost-effective, largely self-financing, has a very low opportunity cost, and poses no risk to inflation. But there is another potential benefit: closing today’s output gap can increase potential future output (thereby also increasing the ability to repay debt incurred). The reason is simple—if long bouts of inactivity leave permanent “scars” on the potentially productive resources (and they do), then the longer the economy operates below potential, the more future potential is damaged. Concretely, factories aren’t built because firms can’t even sell what existing factories are producing. Children’s educational outcomes are damaged as economic distress forces their families to move and as they lose access to decent nutrition and health. Desirable early-career jobs for recent graduates that could impart valuable skills throughout their working lives aren’t available to them, so lifetime earnings suffer. And so on.
The CBO certainly is worried about this scarring—look at the annual revisions to real potential GDP made by them since the onset of the recession: Estimates have consistently been revised downwards except between Jan. 2009 and Jan. 2010, when the deficit-financed $831 billion Recovery Act arrested economic contraction and began shrinking the output gap.

The Recovery Act, however, was nowhere near large enough to restore full employment and close the output gap—the 10-year cost of the stimulus, after all, was smaller than the annual output gaps that have persisted since 2009. As the economy has slowed as fiscal support waned, CBO’s potential output forecasts have withered as well. So why did Congress pivot from job creation (i.e., stimulus) to deficit reduction at the start of the 112th Congress?
The whole point of long-term deficit reduction, after all, is to raise future income. But failure to restore full employment decreases potential future income. Worse, while the economy remains depressed below potential output, near-term deficit reduction—particularly spending cuts—greatly exacerbate the output gap because the government spending multiplier is so high. (We’ve seen this play out across much of Europe, where government “austerity” programs have cut spending, pushed economies back into recession, pushed up unemployment, and cyclical deterioration in the budget deficit has rendered spending cuts entirely counterproductive.)
The downward revisions to potential output in CBO’s forecast reflect a failure of Congress to resuscitate the economy and restore full employment, but it’s a policy failure that can still be reversed. Fiscal stimulus can increase employment and industrial capacity utilization today and actually “crowd-in” private investment, thereby increasing today’s capital stock and future potential output. With respect to fiscal tradeoffs, cost effective deficit-financed fiscal stimulus will actually decrease the near-term debt-to-GDP ratio (the relevant metric for fiscal sustainability), whereas deficit reduction cannot raise future income until the output gap is closed and the private sector is competing with government for savings instead of plowing cash into Treasuries. The full cost of Congress’ misguided pivot from job creation to austerity is larger than even just today’s mass underemployment—trillions of dollars of potential future income will also be lost unless we pivot back to addressing the real crisis at hand.
New Fed data shows families falling even farther behind in retirement saving
The Federal Reserve just published findings from the 2010 Survey of Consumer Finances, a triennial survey of household finances. Though it’s no surprise that these took a dive with the collapse of the housing and stock bubbles, the extent of the plunge is still shocking as the median family saw their net worth fall by 39 percent between 2007 and 2010.1
By 2010, the economy had begun its slow recovery. Housing prices had leveled off and stocks rebounded, recouping about half their losses by the end of the year. But this wasn’t just a temporary setback. Households—especially younger households—were in serious trouble long before the twin asset bubbles burst.
Families headed by someone age 35 to 44—the age when workers typically start getting serious about saving for retirement—had seen declines in net worth in the wake of two previous recessions (1990-91 and 2001) without fully regaining the lost ground in the intervening years (see chart below). So the financial meltdowns that precipitated the Great Recession only exacerbated an existing problem. As a result, GenXers had only accumulated $42,100 in 2010, less than half what the Baby Boomers had accumulated at the same age adjusted for inflation (in the chart, Depression and War Babies are indicated by squares, Early Boomers by triangles, Late Boomers by circles, and GenXers by an X).2
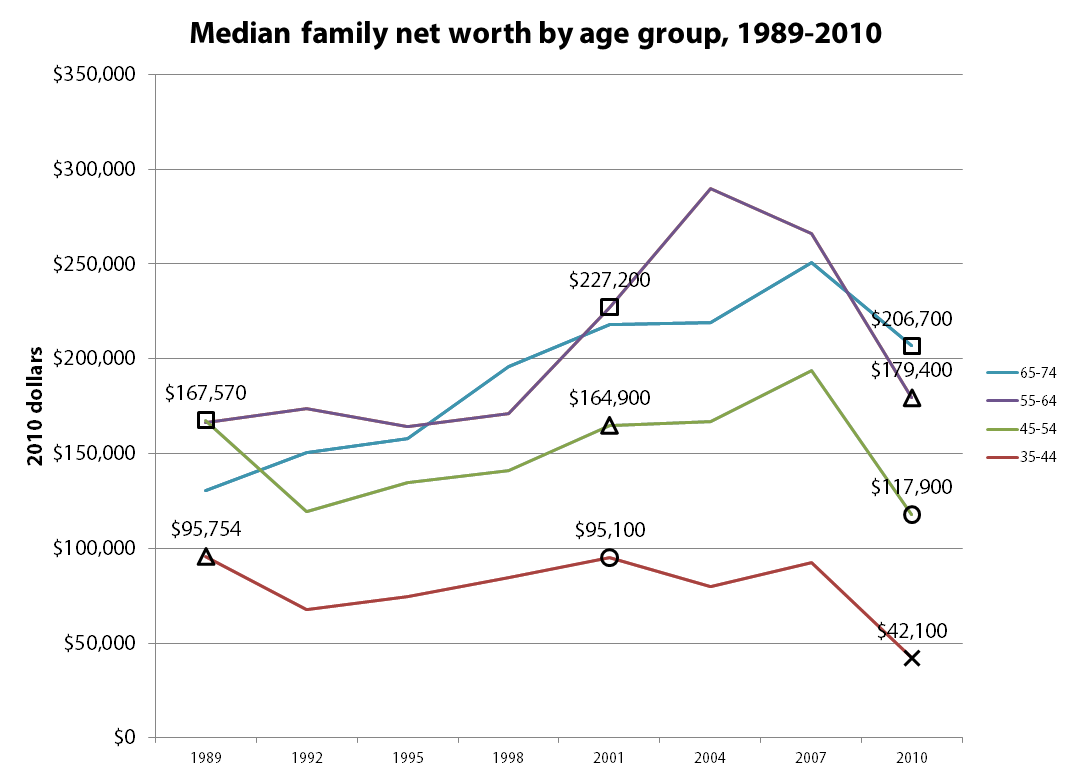
The fact that net worth declined for younger age groups even before the Great Recession is remarkable when you consider that the economy grew by a third on a per capita inflation-adjusted basis between 1989 and 2010, though this growth was not widely shared. Furthermore, families should have been saving more to make up for declines in pension coverage and Social Security benefits. As a result, the Center for Retirement Research has estimated that the average family in the broad 35-64 age range had a Retirement Income Deficit of $90,000 in 2010, a measure of how far behind they were in saving and accumulating benefits for retirement.
Even a generation that fared relatively well—the cohort born during the last years of the Great Depression and World War II—had only accumulated $227,000 as it approached retirement in 2001. This is roughly four times the median income for that age group in 2001, or enough to purchase a 20-year annuity worth $3,750 a year at a 3 percent real interest rate.3 As these Depression and War Babies began tapping their retirement savings during the boom and bust years of the new millennium, their net worth fell to $206,700 in 2010, whereas the preceding generation had seen increases in net worth during their early retirement years.
Baby Boomers fared much worse than the Depression and War Babies, lulled into complacency by asset bubbles that inflated during their prime earning years and popped as the leading edge of the Boomer generation approached retirement. Early Boomers born in the late 1940s and early 1950s saw their net worth increase by around $69,000 between 1989 and 2001 (a 4.6 percent annual rate), but only by a meager $14,500 between 2001 and 2010 (a 0.9 percent annual rate). Late Boomers fared no better, and, like GenXers, are now far behind where earlier generations had been at the same age.
Though it may be tempting to chastise families for not saving enough for retirement, most of the blame lies with former Federal Reserve Chairman Alan Greenspan and others in positions of responsibility who watched asset bubbles inflate without warning that these paper gains weren’t real, and promoted homeownership and 401(k)s as the path to a secure retirement without acknowledging the extent of the risks involved.
1. A special 2009 survey that re-interviewed families who had participated in the 2007 survey found a much smaller 19 percent drop in median net worth between 2007 and 2009.
2. The published survey results don’t allow precise tracking of generational cohorts because demographic breakdowns are by 10-year age group and the survey is conducted every three years. However, the 45-54 “Depression and War Baby” cohort in 1989 approximately corresponds to the 55-64 age group in 2001 and with the 65-74 age group in 2010, etc.
3. In practice, the typical household holds most of their wealth in the form of home equity and doesn’t annuitize liquid assets.
Another suicide at Apple’s key supplier in China
The latest suicide of a worker at Apple Computer’s Foxconn supplier plant in Chengdu, China may be another indication that Apple has not appreciably improved conditions for its manufacturing workers. Apple and Foxconn, working with the Fair Labor Association, announced that they would make changes in grueling overtime work schedules and in working conditions, including a promise to gradually come into compliance with China’s overtime laws. Yet this suicide, in conjunction with recent worker protests and new reports, suggests that needed reforms have not been made.
There are mixed reports from SACOM and China Labor Watch about whether work schedules have been reduced in any systematic way at Foxconn. Problematically, it appears that when the schedules are reduced, the reductions are not adequately balanced with hourly pay increases. So the already-inadequate monthly pay drops, leaving workers—72 percent of whom at the Chengdu plant told the FLA they could not meet their basic needs—in a desperate situation.
Ultimately, Apple has the power and moral responsibility to improve wages and conditions for Foxconn workers in Chengdu and elsewhere. Certainly, Apple and its executives can afford to do the right thing.
Congress should fix Postal Service pension problem it created
The Heritage Foundation’s latest attack on the Postal Service is a convoluted collection of half-truths and untruths. The author, David John, doesn’t want the Postal Service to benefit from $11.6 billion in overpayments it made for its pension obligations even though he grudgingly admits “this surplus appears to exist.” The overpayment should be refunded to the Postal Service to help it met its operating costs, but Heritage wants those funds locked up in the pension plan, which it claims would “follow the private-sector practice of using the current surplus—whatever it is—to defray future retirement payments.” This is baloney. When a private corporation overfunds its pension plan, it can transfer excess funds to pay retiree health obligations. In the case of USPS, it could use the funds to pay both current obligations ($2.4 billion a year) and the congressionally mandated pre-funding for future obligations ($5.6 billion a year).
When it’s inconvenient, Heritage abandons its suggestion that the Postal Service should be treated like the rest of the private sector. Private sector employers are not required to pre-fund their retiree health benefits, and most of them fund retiree health benefits on a pay-as-you-go basis. If USPS “followed the private-sector practice,” it wouldn’t contribute a nickel to the future retiree health obligations; it would pay them as they came due, yet Heritage supports a requirement that USPS “fully prefund this benefit.”
Heritage also glosses over the findings of two independent agencies that the Postal Service was treated unfairly by Congress and the Office of Personnel Management in the allocation of its pension obligations. EPI published a report in 2010 that took the same position as the Postal Service’s Office of Inspector General and the Postal Rate Commission: USPS and its ratepayers were overcharged approximately $75 billion for past service obligations, and taxpayers were undercharged the same amount. But for Congress’ misallocation of costs, the Postal Service’s short-term finances would be manageable despite the Great Recession and the growth of electronic communication and payments.
Heritage shades the truth in its claim that the Government Accountability Office “bluntly rejected” the agencies’ claims that the Postal Service had been treated unfairly. In fact, GAO admitted that the cost allocation methodology is “a policy choice” whose fairness is debatable:
“Although the USPS OIG [Office of Inspector General] and PRC [Postal Rate Commission] reports present alternative methodologies for determining the allocation of pension costs, this determination is ultimately a policy choice rather than a question of accounting or actuarial standards. Some have referred to “overpayments” that USPS has made to the CSRS fund, which can imply an error of some type—mathematical, actuarial, or accounting. We have not found evidence of error of these types. While the USPS OIG and PRC reports make judgments about fairness, the 1974 law also implicitly reflected fairness.”
GAO does not dispute that the PRC and USPS OIG methodologies for allocating the pension costs are sound, it simply prefers a different policy choice, which burdens the Postal Service:
“All three methodologies (current, PRC, and USPS OIG) fall within the range of reasonable actuarial methods for allocating cost to time periods. However, the allocation of costs between two entities is ultimately a business or policy decision.”
In its ideological zeal to see the Postal Service destroyed or dismembered, Heritage has been careless with its facts and inconsistent in its arguments.
Job chart in Romney’s economic plan seems wrong still funky
UPDATE, June 15, 11:37 a.m.: Ah, mystery of the funky-seeming Mitt Romney jobs numbers revealed (see below for my puzzlement)—it’s a measure of full-time jobs reported in the household survey. I guess half of this is my fault—they do reference the “full-time” aspect when talking about data from the 1970s—but the rest of the chart and paragraph just talk about “job growth.”
But I will note that this is the first time I’ve ever seen full-time jobs from the household survey used to measure job market performance over business cycles. And I’m not convinced it’s a useful innovation; in fact, I think it’s pretty obvious cherry-picking.
Say five people get brand-new jobs that provide 30 hours of work per week while five more see their hours cut from 40 to 34 hours. I’d say this is 120 hours of net new additional work being demanded in the economy; but using the full-time jobs from the household survey would simply say that it’s five “jobs” lost. This just doesn’t seem useful to me.
Also, since the Romney chart ends in June 2011, it might be useful to know what happened to their preferred number in the 11 months since then: 2.25 million jobs added. The industry-standard of economists measuring recessions and recoveries—the payroll survey—has 1.7 million jobs added over those same 11 months, so I do wonder which the campaign would cite if asked.
Lastly, I’d note that there is an obvious sector, full of full-time jobs, that has seen a particularly hard time since the June 2009 beginning of recovery: the public sector. Since June 2009, 600,000 state and local jobs have been lost, and in 2009, about three-fourths of these jobs were full-time.
I was asked to comment on the speech Mitt Romney made in front of the Business Roundtable, so I decided to do some light background reading: Believe in America: Mitt Romney’s Plan for Jobs and Economic Growth.
I noticed something odd in the jobs section of the plan—this chart (ripped directly from the Romney PDF):

I know jobs numbers and recoveries, and these looked wrong to me. For one, the absolute peak-to-trough employment loss following 2007’s Great Recession was 8.8 million jobs (between Jan. 2008 and Feb. 2010) not the 8.9 million that the chart claims.
And given that this is the peak job loss, this means, by definition, that anything measured after this trough couldn’t be negative, as the chart implies. I also know that the U.S. economy didn’t begin adding jobs after the 2001 recession until the second half of 2003, so the 2001 numbers looked off, too.
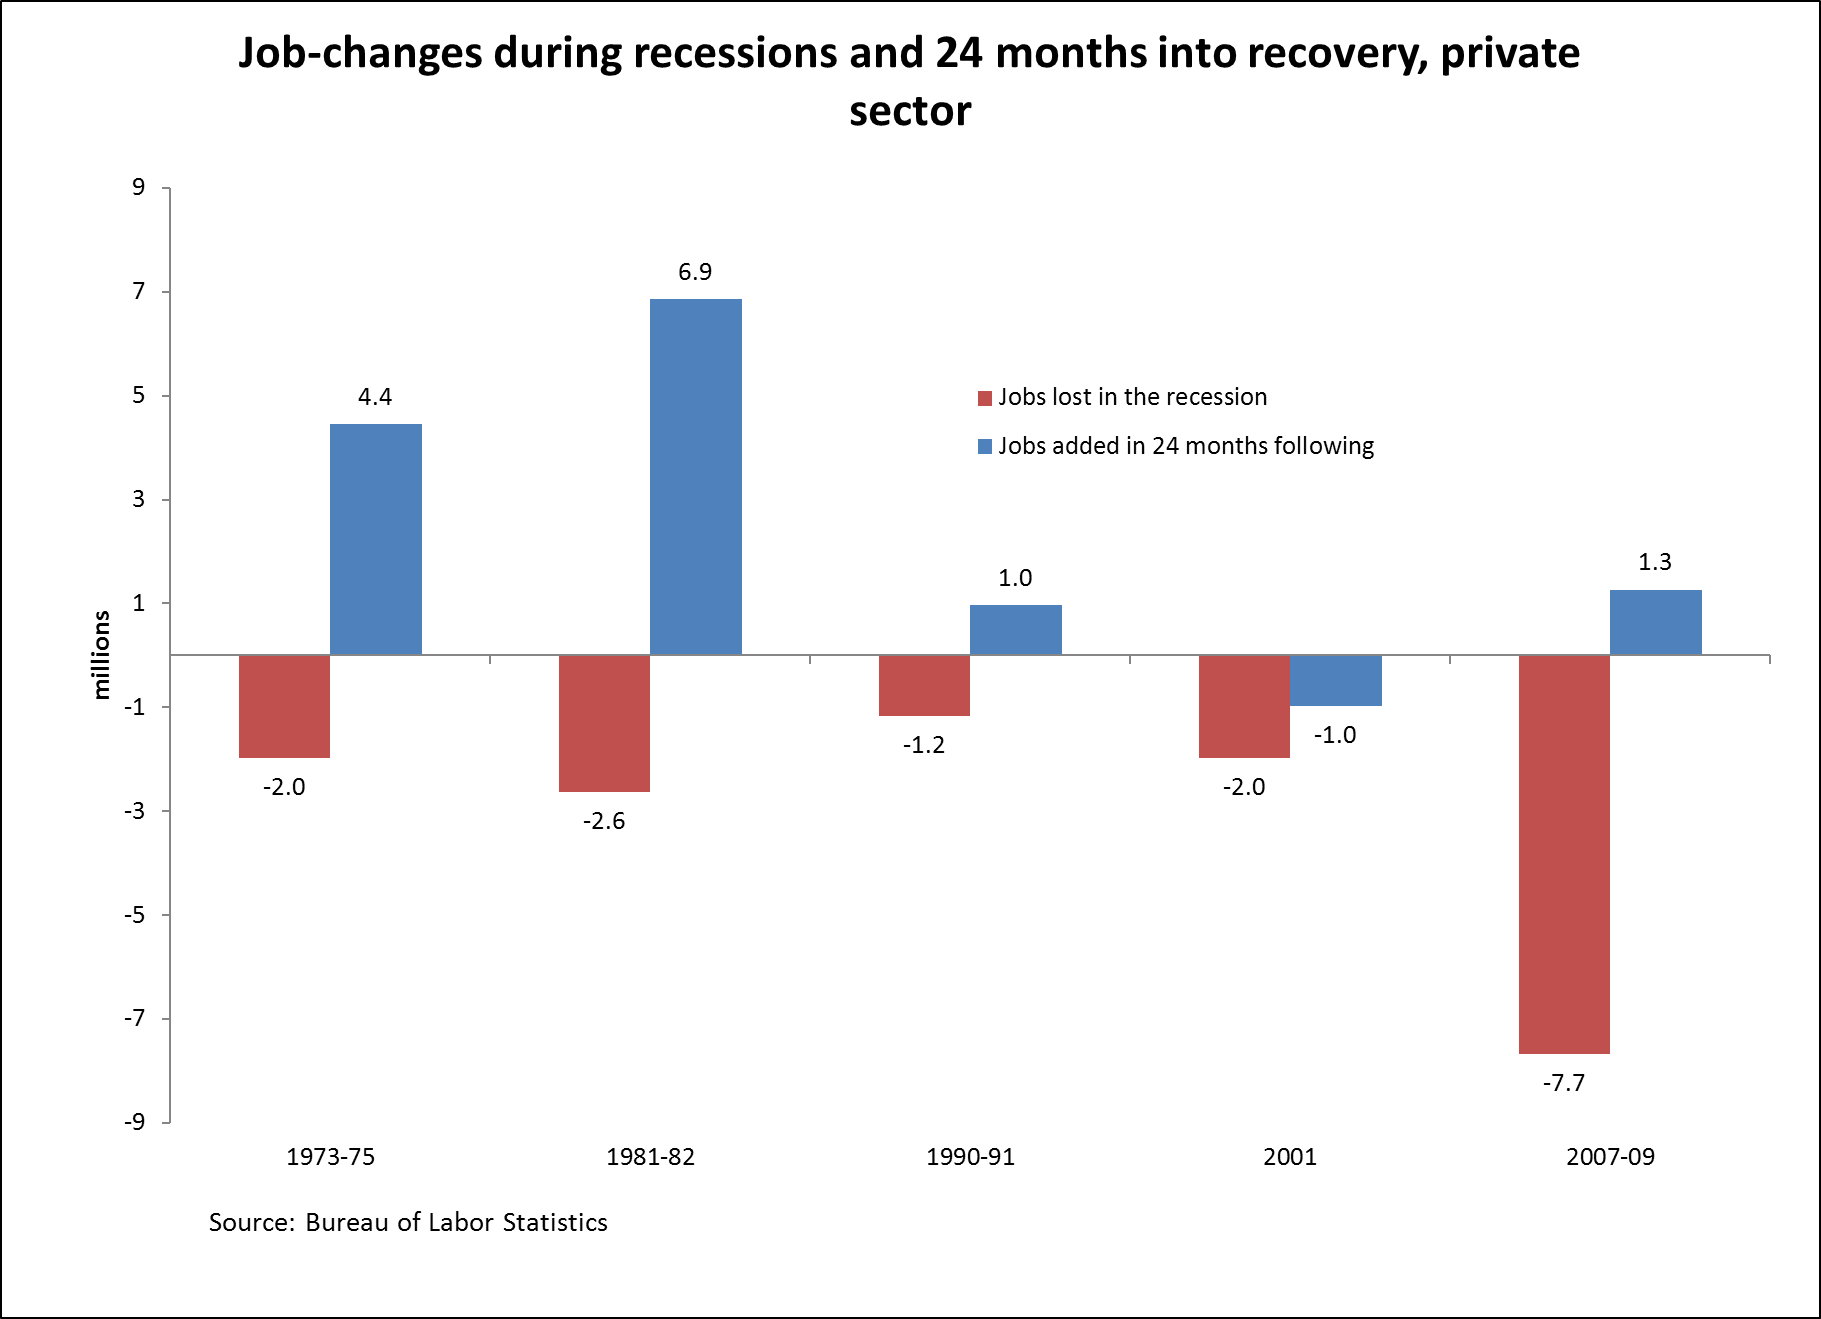
So I decided to do the chart correctly—actually show job losses during the official recessions (i.e., not just employment peak to trough) and the 24 months following and sure enough:

Romney’s numbers are all slightly off, which is odd.
Odder is that the respective performance of the recoveries following the 2001 and 2007-2009 recession are reversed. Look closely at the the last two sets of bars in the respective figures.
The Romney chart has jobs growing in the first 24 months of recovery following the 2001 recession, but shrinking in the first 24 months following the 2007-2009 recession. That’s the opposite pattern of what actually occurred—jobs shrank for the first two years after the 2001 recession and grew modestly in the first two years after the 2007-2009 recession.
I’ll note that we also tried to match the Romney numbers with quarterly data, with household-survey employment counts, with household-adjusted-for-payroll concepts survey data … nothing worked.
A little curious as to what’s going on here.
And since there’s been lots of discussion about the relative health of the private and public sectors, here’s the correct graph for private-sector jobs only.
Update to yesterday’s blog post “Fiscal hawks’ double standard for Social Security cuts vs. tax cuts”
This is an update to yesterday’s blog post “Fiscal hawks’ double standard for Social Security cuts vs. tax cuts.”
The Committee for a Responsible Federal Budget (CRFB) subsequently updated the table in their blog post, adding a column with average scheduled (i.e., promised) initial Social Security benefits for 2050. This is certainly an improvement, but their revised table still only depicts the relative comparison between initial benefits under the Bowles-Simpson plan and payable benefits. Here’s what their table would show with the additional relative comparison between initial benefits under the Bowles-Simpson plan and scheduled benefits (the lightly shaded column).

Under the Bowles-Simpson plan, medium earners reaching the normal retirement age in 2050 would see an initial benefit cut of 6 percent relative to scheduled benefits. And as CRFB duly notes in their blog post, the Bowles-Simpson proposal to use a “chained” consumer price index for cost-of-living adjustments would further reduce all beneficiaries’ benefits in subsequent years relative to scheduled benefits—a benefit cut that compounds annually, as explained in this EPI Briefing Paper.
Claims about the efficacy of fiscal stimulus in a depressed economy are based on as-flimsy evidence as the Laffer Curve?! Seriously false equivalence
Peter Orzsag calls the claim that the debt-to-GDP ratio can be lowered by providing a fiscal boost to a depressed economy the “Laffer curve of the left.” For those who have real lives and may not get the reference, the “Laffer curve” refers to the theoretical possibility that one can raise overall tax revenues by cutting tax rates. The intuition is that cutting tax rates provides incentives for working longer and saving more. In turn, this will boost economic growth sufficiently to bring in more revenue despite rates having been cut. The claim that it is relevant to the U.S. economy has been discredited empirically (and a long time ago).
In light of this, Orzsag’s claim that the “Laffer curve of the left seems to have as much empirical relevance as the original Laffer curve” is not only odd but also flat wrong.
Orzsag’s target is clearly a recent paper by DeLong and Summers that shows fiscal stimulus in a depressed economy has multiple salutary effects, not just on economic growth but even on long-run budget measures (like the debt-to-GDP ratio). The paper shows stimulus boosts near-term growth directly by relieving the constraint of insufficient demand; it boosts productive investments by giving firms an incentive (i.e., more customers coming in the door) to expand capacity; and it keeps chronic long-term unemployment from turning into a permanent erosion of workers’ skills (i.e., economic “scarring”). The assumptions about the strength of each of these effects that are needed to make fiscal stimulus debt-improving in a depressed economy are probably pretty close to real-life parameters.
Let’s do some simple math with widely-agreed upon parameters, even ignoring some of the supply-side measures DeLong and Summers examine. I’m going to round very aggressively here, but it doesn’t affect results much.
Today’s publicly-held debt is about 70 percent of GDP (call it $10.5 trillion on a base of GDP that is $15 trillion). Let’s say we decided to undertake fiscal stimulus in the form of $150 billion spent on high-multiplier activities like extending unemployment insurance, giving aid to states, or investing in infrastructure (we actually need more than this, but it’s a nice round 1 percent of overall GDP, so we’ll stick with it).
The “fiscal multipliers” on these activities are roughly 1.5, meaning they generate $1.50 in economic activity for every dollar spent on them (actually, it may be quite a bit higher, but we’ll take 1.5 as given).
So, (roughly) a year from now, this stimulus has increased the level of GDP by $225 billion (i.e., the $150 billion stimulus multiplied by 1.5). This extra GDP does indeed lower the budget deficit by bringing in more revenue. A reasonable estimate, based on CBO data, is that when the economy is operating below potential, each 1 percent increase in GDP growth yields a cyclical reduction in the budget deficit of about 0.35 percent of GDP. So, this $225 billion in additional output leads to a $79 billion improvement in the budget deficit, making the “net” fiscal cost of the stimulus just $71 billion ($150 billion minus the $79 billion offset from higher growth).
This $71 billion “net” cost of stimulus increases debt by roughly 0.7% ($71 billion divided by the current $10.5 trillion public debt). But GDP has increased by 1.5 percent. Given the current debt-to-GDP ratio of 70 percent, this means that this measure actually declines because the stimulus has increased debt by 0.7 percent but GDP by 1.5 percent.
None of these parameters, by the way, are particularly contested.1 And let’s say they’re slightly wrong, and that instead of outright improving the debt-to-GDP ratio, providing fiscal stimulus in today’s depressed economy actually makes it slightly worse – say it’s only 80 percent self-financing in terms of its impact on debt-to-GDP ratios. Would this really justify calling claims that providing fiscal stimulus in depressed economies does not damage public finances “the Laffer Curve of the left”? Not by my read of the evidence.
1. For those who like analytical solutions, all of the preceding boils down to: So long as the initial debt/GDP ratio is higher than [(1/multiplier) – fiscal clawback ratio], then fiscal stimulus reduces the debt to GDP ratio. The “fiscal clawback ratio” is simply how much a 1% boost to economic growth leads to a reduction in the budget deficit (measured also as a share in GDP). For the arithmetic above, the multiplier of 1.5 and a clawback ratio of .35 means that fiscal stimulus would reduce debt/GDP for any initial debt ratio above 32%.
Take much more conservative assumptions – a multiplier of 1 and a clawback ratio of just 0.25. Then, stimulus is debt/GDP reducing for all initial debt ratios above 75%.
Also note that this means the calculus for whether or not stimulus reduces the debt/GDP ratio gets more favorable as the initial debt ratio rises, a perhaps counter-intuitive result.
Fiscal hawks’ double standard for Social Security cuts vs. tax cuts
The Committee for a Responsible Federal Budget (CRFB) has taken sides in a scuffle between Social Security advocates and former Senator Alan Simpson. This scuffle concerns Simpson’s colorful defense of Social Security proposals within the report he co-authored with fellow Fiscal Commission co-chair Erskine Bowles—a report CRFB has gone to great lengths to champion.
CRFB was responding to a letter signed by young budget and social insurance experts—myself and others at EPI included—disagreeing with Simpson’s claim that the Bowles-Simpson proposals would strengthen the program for our generation. The merits of these proposals aside, CRFB is shamelessly cherry-picking baselines in response to the letter. Whereas CRFB and other fiscal hawks use a current policy baseline for almost all budget projections—e.g., assuming the continuation of the Bush tax cuts past their scheduled expiration—CRFB doesn’t adopt the same convention when it comes to Social Security. This is hypocritical and reveals what can only be described as a biased policy agenda.
In order to minimize the severity of the Bowles-Simpson cuts, CRFB’s defense of the Bowles-Simpson Social Security plan revolves around a comparison of projected future benefits proposed by Bowles-Simpson relative to benefits payable under current law. However, comparing benefits under Bowles-Simpson to payable benefits assumes that Congress will allow an abrupt 25 percent reduction in Social Security benefits when the trust fund is exhausted in 2033 since Social Security is prohibited from borrowing and benefits are generally funded through a dedicated payroll tax rather than general revenue.1
Social Security’s finances are routinely analyzed using scheduled rather than payable benefits—if for no other reason than the system would always appear to be in actuarial balance if projections were based on payable benefits. On a more practical level, it is inconceivable that Congress would allow draconian cuts to fall on elderly retirees. Unlike active workers, who can theoretically save more (or put off retirement) when benefits are cut, elderly retirees are usually viewed as having few other financial recourses. Thus, even in the unlikely event that nothing is done to shore up the system before the trust fund is exhausted, Congress would almost certainly use general revenues to pay promised benefits. Similarly, Congress routinely prevents scheduled cuts to Medicare physician reimbursements (the so-called “doc fix”). In other words, the difference between the current policy baseline and the current law baseline reflects the difference between what budget analysts assume future Congresses are likely to do versus what is currently set in legislation, including scheduled or automatic tax increases and benefit cuts.
Fiscal hawks—including CRFB—overwhelmingly use a current policy baseline to advocate staunch deficit reduction measures because these baselines show a much larger rise in public debt over the long-term, largely due to assumptions about the continuation of temporary tax cuts and the inability of Congress to contain health care cost growth. If CRFB wants to deviate from past practice and score the Bowles-Simpson plan relative to current law, they should also acknowledge that the plan proposes cutting taxes by $1.4 trillion relative to current law, all in the name of deficit reduction.2 Indeed, the plan “saved” $4.1 trillion over a decade relative to an adjusted current policy baseline, whereas continuing the Bush-era tax cuts will cost $4.4 trillion relative to current law.3 (Without the Bush tax cuts, there would not have been a fiscal commission.) Likewise, CRFB should argue in favor of leaving Social Security out of deficit discussions entirely, since by their definition Social Security is in long-run actuarial balance.
Using a current policy baseline when analyzing tax policies or clamoring for near- and long-term deficit reduction while cherry picking a current law baseline to justify Social Security benefit cuts is a gimmicky double standard that reflects a bias toward cutting social insurance programs.
1. Exceptions to this rule include the current payroll tax holiday and income taxes levied on Social Security benefits for high-income beneficiaries, which revert to Social Security.
2. Estimate based on CRFB’s Moment of Truth Project July 2011 re-estimate of the Bowles-Simpson plan relative to CBO’s March 2011 current law baseline for an apples-to-apples comparison over FY2012-21.
3. This is not an apples-to-apples comparison because the Bowles-Simpson adjusted current policy baseline assumed the Bush tax cuts would expire for households with adjusted gross income above $200,000 ($250,000), for a revenue increase of roughly $700 billion relative to full continuation, but even adjusting accordingly the two are very much in the same ballpark.
The long-term budget outlook has improved dramatically over the last three years
Yesterday, the Congressional Budget Office (CBO) released its annual Long Term Budget Outlook (LTBO), which projects federal spending, revenues, deficits, and debt over the next 75 years. There are many points of controversy with regards to the LTBO, not the least of which is that it’s pretty ridiculous for CBO to pretend it knows what health care costs will look like in 2087. Personally, I think that CBO’s LTBO provides a lot more heat than light, and I would be the first to applaud if CBO decided to only release ten-year budget projections (in themselves subject to a huge margin of error).
Nevertheless, there is still value in looking at the change in projections from one year to the next. The figure below clearly shows that over the past three years CBO’s extended current law budget projections—which assumes no changes are made to the law—have improved drastically.
2009: CBO projected that debt held by the public would rise from around 60 percent of GDP to just over 300 percent of GDP in 75 years.
2010: CBO markedly improves its 75-year outlook, which now shows debt rising to just over 110 percent of GDP. This improvement largely reflected passage of the Affordable Care Act (ACA), which prioritized reducing long-run deficits and slowing the rate health of care cost growth (the predominant driver of long-run deficits).
2011: CBO again improves its outlook, now projecting debt rising to 87 percent of GDP in the first 30 years but then actually falling to 75 percent over the next 45 years. This improvement was largely due to three changes in CBO’s assumptions and projections: (1) lower costs for the new ACA health insurance exchange subsidies; (2) higher taxable wages due to the employer-sponsored health insurance excise tax (pushing worker compensation away from the tax-free health coverage); and (3) a slightly higher long-run economic growth rate.
The ultimate goal of budget reform is to reach “fiscal sustainability,” a point at which public debt is growing no faster than the economy (stabilizing debt relative to national income, i.e., ability to pay). According to 2011 LTBO projections, the federal government had already achieved long-run “fiscal sustainability.”
2012: For the third straight year in a row, CBO favorably revises its long-run budget outlook: Starting in 2014, public debt is projected to fall by 0-3 percentage points each year. The public debt is shown to be fully paid down by 2070, and within 75 years the federal government is projected to have accrued reserve surpluses equal to about a third of the economy.

This improvement is primarily due to two factors. First, the Budget Control Act (the result of last summer’s debt ceiling crisis) cuts spending by over $2.1 trillion through 2021, and because of the way CBO indexes discretionary spending for inflation in its projections, it continues to reduce deficits in subsequent years. And second, CBO changed the way it projects health care cost growth. In the past, it used the average growth rate over the last 25 years, but in this report it calculated a weighted 25-year average that puts more weight on recent years. This new methodology does a better job of taking into account the fact that health care costs have been slowing recently, possibly evidence that the ACA has exceeded expectations.
Budget wonks will rightly point out that the projections in question are CBO’s extended baseline, which assumes no changes to current law. This means that the Bush-era tax cuts expire next year, the sequestration cuts also go into full effect next year, the Alternative Minimum Tax will apply to more upper middle-income households, and Medicare reimbursements to doctors will be allowed to fall dramatically. But with the exception of the sequestration trigger, all those other factors were also present when CBO made their projections in 2009, 2010, and 2011. The fact is the fiscal outlook of the federal government has improved dramatically in the last three years.
More importantly, this report clearly shows that the path toward fiscal sustainability includes allowing some—if not all—of the Bush-era tax cuts to expire and fully implementing and protecting the Affordable Care Act.