Huge disparity in funding for immigration enforcement vs. labor standards
In a new, well-documented report, Immigration Enforcement in the United States: The Rise of a Formidable Machinery, the Migration Policy Institute (MPI) calculated that the government’s price tag for immigration enforcement in 2012 was $18 billion. The report made headlines by highlighting the fact that this figure amounts to 24 percent more than it costs to fund the five main U.S. law enforcement agencies combined. But MPI offered another important juxtaposition in the report that has failed to receive much attention: the abysmally low level of funds the government commits to enforcing labor standards and protecting the rights of workers in the United States.
MPI reviewed the budgets of the National Labor Relations Board (NLRB) and the Labor Department’s Wage and Hour Division (WHD) and Occupational Safety and Health Administration (OSHA), concluding that in 2010, the “combined budgets for [the] three main federal labor standards regulatory agencies was $1.1 billion … compared to the $17.2 billion budgets for DHS’s two immigration enforcement agencies.” Analyzing the most recent federal budget data available, EPI has found that even when including additional federal agencies whose primary purpose is to enforce labor standards (the Mine Safety and Health Administration (MSHA), the Office of Federal Contract Compliance Programs (OFCCP), and the National Mediation Board (NMB)), in 2012, the total amount Congress appropriated to enforce labor laws and regulations amounted to only $1.6 billion—about 9 percent of what was spent enforcing immigration laws last year.

The labor enforcement agencies are staffed at only a fraction of the levels required to adequately fulfill their missions.Read more
The congressional GOP has smothered a more rapid economic recovery
PBS’ Frontline has an interesting piece on the GOP response to President Obama’s election in 2008, reporting that, “After three hours of strategizing, they decided they needed to fight Obama on everything.”
Part of this “everything” was the efforts of the new administration to end the Great Recession and restore the economy back to full health. From the start, the GOP sought to block measures that a wide swath of economists agreed would provide help to boost the economy and bring down unemployment. This obstructionism has been a constant theme throughout the past four years, and it continues today.
Congressional Republicans have made it clear that they intend to use every bit of leverage they can to force cuts to domestic spending in the coming year. This leverage includes threats to not raise the statutory debt ceiling and/or force a federal government shutdown after March 27, when the standing appropriations continuing resolution (CR) expires. This, of course, would represent the long-promised repeat of the spring and summer of 2011, when congressional Republicans secured over $500 billion in domestic spending cuts in CR fights and another $2.1 trillion in spending cuts in exchange for incrementally raising the debt ceiling by an equivalent amount—better known as the Budget Control Act (BCA) of 2011.
The BCA cuts have already done damage, and will all-but-surely slow growth in the rest of 2013 as well. The various components of the BCA accounted for about one-third of the total fiscal drag exerted by the major components of the “fiscal cliff” that was facing Congress ahead of the lame duck budget deal. And the components of the BCA account for 48 percent of the remaining fiscal drag unaddressed by the deal—a drag that is poised to shave 1.0 percentage point from real GDP growth in 2013. House Republicans have voted to replace the Defense cuts contained within the sequester—again rapidly approaching, following its postponement to March—in it with deeper domestic spending cuts, leaving a drag of 0.8 percentage points from the BCA for 2013, all while threatening to use the debt ceiling and CR as leverage to get their way.
If this ideologically driven objective of deeply cutting spending is met, this will represent just one more way that the GOP Congress has managed to delay full recovery from the Great Recession. The evidence continues to pile up Read more
Are the job polarization data robust?
This post is the fourth in a short series that assesses the role of technological change and job polarization in wage inequality trends.
In an earlier post, John Schmitt showed that “job polarization”—the expansion of low- and high-wage occupations at the expense of occupations in the middle—did not occur in the 2000s, (and therefore could not be responsible for rising wage inequality in the 2000s). In this post, I examine how well the key figures at the heart of the “job polarization” analysis really fit the underlying data. I begin with a closer look at the data for the 1990s, the decade that appears to conform most closely to the patterns implied by the job polarization explanation for wage inequality.
In a recent piece critical of research myself, John, and Larry Mishel are doing on technology and wages, Dylan Matthews makes a lot of our interpretation of the following chart for the 1990s. The chart, which we prepared for a paper presented at a conference earlier this month, shows the change between 1989 and 2000 in the share of total employment in 100 different occupation groups arrayed by their average wage level (labeled “skill percentile”):
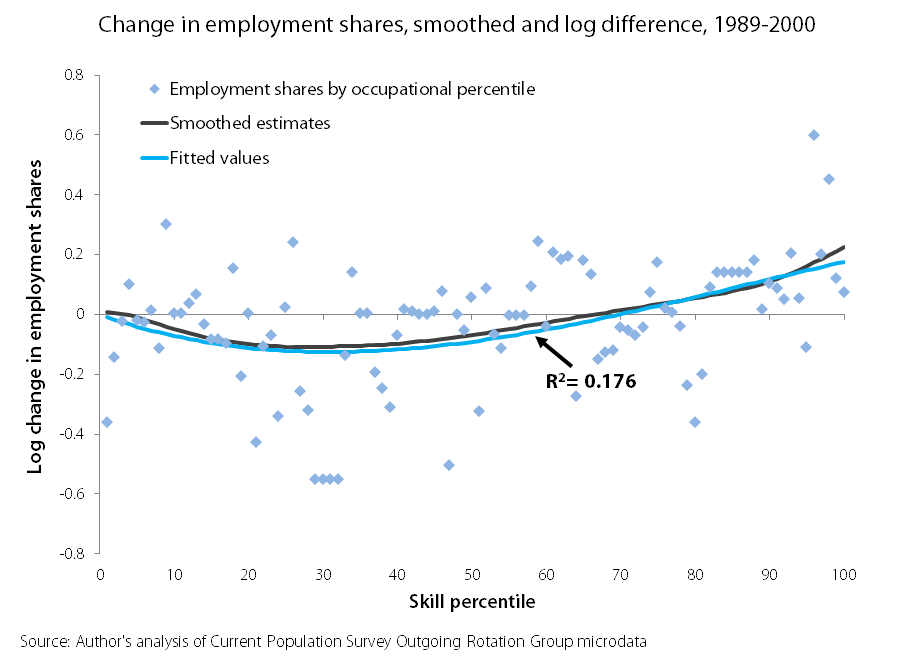
The two lines are statistically smoothed versions of the individual data points, which appear as blue diamonds. Both lines show a rough U-shape that is consistent with the standard story of job polarization: employment increases were largest at the top and bottom of the skill distribution and smallest in the broad middle. Read more
What we read today
Here’s some of the thought-provoking content that EPI’s research team enjoyed reading today:
- “The increasingly isolated GOP” (The Plum Line)
- “Sequester And Shutdown Could Be More Likely Than A Fight Over The Debt Ceiling” (Capital Gains and Games)
- “Why Grandma Owes More on Her Credit Cards Than You do” (Demos)
- “Crumbling Infrastructure, Crumbling Democracy: Infrastructure Privatization Contracts and Their Effects on State and Local Governance” (Employment Policy Research Network)
Apple’s own data reveal 120,000 supply-chain employees worked excessive hours in November
To its credit, Apple is now posting monthly information tracking the extent to which employees in its supply chain are working less than its standard of 60 hours per week. The introductory language to this information states: “Ending the industry practice of excessive overtime is a top priority for Apple in 2012.” The accompanying graph itself, however, contains data from Jan. 2012 through Nov. 2012 and suggests otherwise. Not only has Apple failed to end this practice, but progress has significantly reversed in recent months.
Apple’s code of supplier conduct sets a maximum work week of 60 hours, with an exception clause, discussed below. Eyeballing Apple’s graph indicates (Apple only provides a specific number for November, so visual approximation is necessary):
- In Jan. 2012, about 16 percent of the workers in Apple’s supply chain worked more hours than Apple’s maximum standard. This proportion diminished through August, when approximately 3 percent of these workers had work weeks that exceeded this standard.
- But the proportion of workers meeting the standard dropped precipitously since then, presumably reflecting the increased intensity of work to produce and meet iPhone 5 demand.
- In November, 12 percent of the workers in Apple’s supply chain that are being tracked worked more than the 60-hour standard. This was the worst monthly compliance rate of the year, with the exception of January. More than one million workers are being tracked by Apple, so the 12 percent translates to more than 120,000 workers in their supply chain working excessive hours. Read more
AARP comes out against COLA cut
AARP unveiled new research from its Middle Class Security Project yesterday, with related papers focusing on topics ranging from rising health care costs to credit card debt. At the release, AARP CEO Barry Rand gave a rousing speech, coming out strongly against a proposed cut in the Social Security cost-of-living adjustment (COLA), echoing a similar stance by the New York Times this Sunday. Rand focused on the need for both solvency and adequacy, emphasizing that Americans don’t want Social Security reform to be part of deficit reduction talks and were willing to contribute more to strengthen the program.
Policy director Debra Whitman, an economist and Social Security advocate Rand hired to replace the too-quick-to-compromise John Rother, said most Americans were surprised at how low Social Security benefits were—less than $14,000 per year on average. In the report, Whitman and her co-authors highlight the fact that benefits would be cut further for future retirees with a scheduled increase in the normal retirement age to 67, equivalent to an across-the-board benefit cut. As a result of this and other negative trends, the report estimates that three out of 10 middle-income workers will become low-income retirees.
This might seem like an obvious place to call for shoring up Social Security benefits for the middle class—or at least halting their decline. But though Whitman and many of her colleagues may prefer to close Social Security’s projected shortfall with revenue increases, AARP continues to avoid ruling out additional benefit cuts or endorsing specific revenue proposals, such as lifting the cap on taxable earnings. This might seem like a wise PR move, given the flak AARP gets for drawing a line in the sand (even when it actually hasn’t). But, like President Obama’s administration, AARP will be attacked as intransigent by some critics no matter how conciliatory they are, so they might as well stake out a clear position, backed up by the facts in this report.Read more
Occupation employment trends and wage inequality: What the long view tells us
This post is the third in a short series that assesses the role of technological change and job polarization in wage inequality trends.
The discussion of job polarization—the expansion of high and low-wage occupations while middle-wage occupations decline—and its role in driving wage inequality would benefit from a longer examination of occupational change and technology’s impact.
“Occupational upgrading” has been going on for 60 years or more. By occupational upgrading, we mean the erosion of employment in blue-collar and, more recently, pink-collar (administrative/clerical) occupations and the corresponding employment expansion of high wage, professional and managerial white-collar occupations. The share of employment in low-wage, service occupations (food preparation, janitorial/cleaning services, personal care and services) has actually been relatively stable for many decades and remained a small—roughly 15 percent—share of total employment.
The bottom line for the discussion of the role that technologically-driven occupation trends have played in generating wage inequality is that occupational upgrading has been occurring for decades, through periods of both rising and falling wage inequality and through both rising and falling median real wage growth. In our view, this makes occupational employment shifts a poor candidate for explaining the rise in wage inequality since 1979. Read more
International tests show achievement gaps in all countries, with big gains for U.S. disadvantaged students
Corrections were made to this post on Jan. 30. For explanations of the corrections, see the full report summarized in this posting.
In a new EPI report, What do international tests really show about U.S. student performance?, we disaggregate international student test scores by social class and show that the commonplace condemnation of U.S. student performance on such tests is misleading, exaggerated, and in many cases, based on misinterpretation of the facts. Ours is the first study of which we are aware to compare the performance of socioeconomically similar students across nations.
Some critics, disturbed by the unsophisticated way in which policymakers and pundits use international tests to condemn American student performance, have commented that American students in relatively affluent states, like Massachusetts or Minnesota, or students in schools where few students are from low-income families, perform as well or better than average students in the highest scoring countries. But while such comparisons are well-intended, they can’t tell us much because a proper comparison would be between affluent states in the U.S., and affluent provinces or prefectures in other countries, or between schools with little poverty in the U.S. and schools with little poverty in other countries. Critics have not previously had data by which such comparisons can properly be made.
MORE: Authors’ response to OECD/PISA reaction to their report (PDF)
AUDIO: Authors speak with the press about their report (MP3)
Yet both of the major international tests—the Trends in International Mathematics and Science Study (TIMSS) and the Program on International Student Assessment (PISA)—eventually publish not only average national scores but a rich database from which analysts can disaggregate scores by students’ socioeconomic characteristics, school composition, and other informative criteria. Examining these can lead to more nuanced conclusions than those suggested from average national scores alone. Read more
What we read today
Here’s some interesting content that EPI’s research team recommends today:
- “Our Economic Pickle” (New York Times)
- “This Week in Poverty: Smiley Calls for White House Conference on US Poverty” (The Nation)
- “The Low Politics of Low Growth” (New York Times)
- “Much Ado about Nothing on Obama’s White Guy Appointees” (New America Media)
- “Misguided Social Security ‘Reform‘” (New York Times)
Missing in action: Growth and shared prosperity
Two articles in the Sunday New York Times, appearing side-by-side, together told the fundamental truth that our current discussion of economic policy ignores: Generating greater economic growth and ensuring that middle-class wages grow with productivity are essential for restoring shared prosperity and achieving our budget goals.
Steven Greenhouse’s piece, “Our Economic Pickle,” states:
“Federal income tax rates will rise for the wealthiest Americans, and certain tax loopholes might get closed this year. But these developments, and whatever else happens in Washington in the coming debt-ceiling debate, are unlikely to do much to alter one major factor contributing to income inequality: stagnant wages.”
The article notes, “Wages have fallen to a record low as a share of America’s gross domestic product” and quotes Harvard’s Larry Katz appropriately summarizing the situation: “What we’re seeing now is very disquieting.”
This is not totally new, as shown by the data from The State of Working America that Greenhouse cites: “From 1973 to 2011Read more