Incomes and Poverty Stable as Wage Stagnation Continues
Modest income growth in 2012 barely begins to offset lost decade driven by financial crisis and decade-long wage stagnation
This morning, the Census Bureau released its report on income, poverty, and health insurance coverage in 2012. It shows that from 2011 to 2012, median household income for non-elderly households (those with a head of household younger than 65 years old) increased 1.0 percent from $56,802 to $57,353. However, that modest growth barely begins to offset the losses incurred during the Great Recession. Between 2007 and 2011, median household income for non-elderly households dropped from $62,617 to $56,802, a decline of $5,815, or 9.3 percent. Furthermore, the disappointing trends of the Great Recession and its aftermath come on the heels of the weak labor market from 2000-2007, where the median income of non-elderly households fell significantly, from $64,843 to $62,617, the first time in the post-war period that incomes failed to grow over a business cycle. Altogether, from 2000 to 2012, median income for non-elderly households fell from $64,843 to $57,353, a decline of $7,490, or 11.6 percent.
5 Years Later: The Crisis We Averted and the One We Didn’t
Brad DeLong recently wrote an excellent piece contrasting the “Banking Versus Macroeconomics” camps in assessing how the U.S. responded to the financial crisis that peaked with the uncontrolled bankruptcy of Lehman five years ago. A quick summary:
“One camp, call it the Banking Camp, sees a central bank as a bank for bankers: its clients are the banks…and its functions are to support the banking sector and …to ensure that there is enough credit and liquidity in the economy that mere illiquidity rather than insolvency does not force banks into bankruptcy and liquidation.
Another camp, call it the Macroeconomic Camp, sees a central bank… as the steward of the economy as a whole, with its primary responsibility not to preserve the health of the businesses that make up the banking sector but rather to maintain the health of the economy as a whole.”
This is a useful dichotomy, and one that can help explain differing assessments of how policymakers responded to the Global Financial Crisis of 2007/08.
Flawed Diagnoses and Inappropriate Cures in Education
I don’t mean to pick on Joel Klein, the former New York City schools chancellor, but he has made himself such a caricature of self-styled school reformers who are undermining American public education that it would be a mistake not to respond to the claims on which he bases his efforts.
Last year, I addressed Mr. Klein’s conclusion that public education must be failing because he himself grew up in public housing as a “kid of the streets,” yet owed his success to great public schools; and if only children from public housing projects today had schools as good as his, they too would be successful.
The analysis, it turned out, was misleading. The New York City public housing in which the Klein family lived in the 1950s was segregated, constructed for white middle class two-parent households where the husband had a stable employment history and where market rents were charged with no public subsidy. Such housing projects no longer exist, and the conditions in which Joel Klein grew up bear no resemblance to those from which minority children in impoverished families come to school today.
Mayor Gray’s statement in support of his veto of the LRAA should embarrass him
Vincent Gray’s statement in support of his veto of the Local Retailer Accountability Act was a collection of non-sequiturs, half-truths, vague promises, and nonsense. He divides his critique of the LRAA into six sections.
- “The bill is not a living wage bill because it would raise the minimum wage only for a small fraction of the District’s workforce.” The Mayor says he wants, instead, “to raise the minimum wage for all District residents.” Of course, the District could do both: require a higher minimum wage for billion-dollar corporations and a lower one for other businesses, including mom and pop stores. But the fact is that Mayor Gray hasn’t put forward any minimum wage increase, and the level that Councilmember Tommy Wells has suggested is $10.25—far below a “true living wage.” Each member of a 2-parent family with two kids would need to earn nearly $20 an hour to have a true living wage in the District.
- “The bill is a job killer, because nearly every large retailer now considering opening a store in the District has indicated they will not come here or expand here if this bill becomes law.” The Mayor should identify the expansions Target, Home Depot, Wegmans, Lowe’s, Walgreens, Harris Teeter, AutoZone and Macy’s will make if the bill doesn’t pass. If they have such plans, why haven’t they announced them? And how credible is this threat? What billion-dollar retailer would invest here with a minimum wage of $10.25 an hour but not with a minimum wage of $12.50 that gives a credit for other benefits? The Mayor is either being dishonest, or gullible, or is simply unwilling to stand up to corporate bullies.Read more
What We Read Today
Here’s what we read today. Did we miss anything good? Let us know in the comments.
- Why Janet Yellen, Not Larry Summers, Should Lead the Fed (New York Times)
- How High 401(k) Fees Can Doom Your Retirement Plans (Slate)
- Dying Not Under a Bridge, Nor Living in an E.R. (The Atlantic)
- Public Universities Funding Less Low-Income Students Nationwide (Color Lines)
- Carwash Workers and Capitol Hill: Immigration in Limbo (In These Times)
- At Grandmother’s House We Stay (Pew Research)
- Problem of unpaid internships in Ontario is ‘massive,’ says student group (Toronto Star)
- Wynne Godley’s Crucial Warnings About the Trade Deficit Still Ignored (AmericanEconomistAlert.org)
Social Welfare Spending, Part II: Looking Forward—It’s Still All About Health Costs
If House Republicans were at all serious last July, then they should be putting the finishing touches on their “menu” of social welfare spending cuts that they plan to force the president to choose from in exchange for an increase in the debt limit. Presumably, with this “menu,” a large increase in the debt ceiling would require a large reduction in social welfare spending while a small debt ceiling increase would require a smaller spending cut. This means that House Republicans are again preparing to risk America’s credit rating to eviscerate important and popular programs such as Social Security and Medicare.
I recently showed that the rise in social welfare spending since 1975 was due to: (1) the steady rise in federal health spending, driven in large part by increasing costs in the private-sector delivery of health care goods and services, and (2) the jump in safety net spending during the 2007-2009 Great Recession as programs like unemployment compensation and SNAP expanded (both because the recession pushed more people into eligibility and because Congress temporarily expanded the programs to blunt the impact of the downturn). Social welfare spending has fallen relative to GDP in the past couple of years as the economy slowly recovers, yet the unemployment rate is still over 7 percent, nearly 40 percent of the unemployed have been looking for work for over 6 months, and the labor force participation rate is at a 35 year low.
ACA Implementation Advice: Encourage Timely Reports Of Income Changes
In a recent Health Affairs article, we, along with coauthor Dave Graham-Square, examine a potential pitfall in the design and implementation of the tax subsidies individuals and families may receive through the new health insurance marketplaces beginning in 2014. Next month, eligible Americans will be able to apply for subsidies to purchase health insurance in the new state and federally facilitated insurance exchanges. The amount of subsidy is determined by a person or family’s income over the past year. A problem may arise at the end of the year if income changes substantially and the family’s subsidy levels are not adjusted accordingly. Families may owe large sums at tax time if the subsidies aren’t recalculated as income rises.
Our article examines the extent to which eligible families in California experience income changes, which could have substantial effects on their subsidy levels. Using two-year panels of the Survey of Income and Program Participation (SIPP), matched to the California Simulation of Insurance Markets (CalSIM), we construct the projected demographic profile and participation of the state’s subsidized exchange population in 2018 to 2019.
2012 Income Numbers: What to Expect Next Tuesday and Why It Matters
Next Tuesday, the 2012 income numbers will be released by the Census Bureau and will reveal whether or not U.S. households have begun to dig out of the hole left by the Great Recession.
Between 2007 and 2011, median household income dropped by 8.1 percent (Excel file). Unfortunately, Tuesday’s numbers are unlikely to show much of a rebound for the median household in 2012.
Two things that will have pushed the income numbers in a positive direction are average weekly hours worked, which increased by 0.3 percent in 2012, and the share of the population that is employed, which grew by 0.3 percent when considering the entire 16+ population and 0.8 percent when considering just “prime-age” workers (workers age 25-54). However, those increases will be at least partially offset by the fact that due to the weak labor market, workers were earning less per hour in 2012 than they did in 2011. (Real hourly wages for the median worker dropped by 0.6 percent in 2012.) Putting these factors together, my back-of-the-envelope calculation is that, in 2012, median household income likely grew somewhere between zero percent and one-half of one percent.
Top 1 Percent Receive Record High Share of Total U.S. Income
The United States has experienced increasing economic inequality since the late 1970s. New data released this week confirm that the Great Recession was only a blip on the road toward growing income inequality. Emmanuel Saez and Thomas Piketty updated their now-famous data on cash, market-based income, allowing one to track trends in inequality in the United States between 1913 through 2012.
As illustrated in the graph below, the share of income going to the top 1 percent has surpassed its 2007 peak of 18.3 percent and is now 19.3 percent—the highest share since 1928.
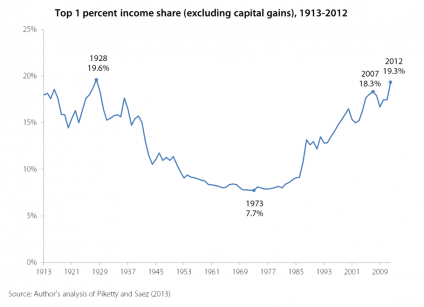
At the same time, the Piketty and Saez data show that the Great Recession has battered incomes for the bottom 90 percent so badly that they are now back to the same levels that prevailed in 1966.
Entitlement Spending, Part I: Looking Back
It was reported earlier this summer that congressional Republicans planned on demanding that the Obama administration choose from a “menu” of mandatory spending cuts in exchange for raising the country’s statutory debt limit. “Mandatory spending” (or the even less flattering “entitlements”) is a budget wonk’s way of referring to programs such as Social Security, Medicare and Unemployment Compensation as well as for important programs for low-income individuals and families such as Medicaid, the Supplemental Nutrition Assistance Program (SNAP, formerly known as food stamps), and Supplemental Security Income (SSI, a means-tested benefit for the low-income blind, disabled, and elderly).
Before looking ahead at some of the specific proposals for “entitlement reform,” it is instructive to look back at spending on these programs in recent decades to see which have been growing and which have not, and to examine the sources of this growth. The GOP narrative, after all, on why these popular programs must be cut is that they are allegedly spiraling out of control. This post examines whether or not there’s any evidence for this view.