In midst of a pandemic, Trump’s NLRB makes it nearly impossible for workers to organize a union
Today, the National Labor Relations Board (NLRB) issued a rule making it harder for workers to win and keep a union. At the same time, the Trump NLRB has suspended all union elections, including mail ballot elections. The decision to finalize this rulemaking at a time when the agency is failing to fulfill its most basic statutory obligation—to enable workers to organize—is a disgrace. Congress must hold the agency accountable for this decision.
This is a moment when more and more workers are voicing concerns over the terms and conditions of their work as the entire country grapples with the COVID-19 pandemic. Workers are being forced to work without adequate protective gear or sick leave if they or their family members get sick. As a result, workers at places like Amazon, Instacart, and Whole Foods are walking off the job to demand stronger protections, and many are seeking to form unions.
Unions play a critical role in winning workers health and safety protections, as well as fair wages and benefits. In fact, unions have a long history of developing training related to infectious disease and providing workplace protections, in many cases through strong safety and health committees set up to assist when issues like the coronavirus crisis emerge. Notably, a nurses’ union recently located 39 million N95 masks, after their employer failed to provide them, and grocery unions have won personal protective equipment, paid sick time, and hazard pay for their members. Further, unions promote worker safety by investing in programs to educate workers about on-the-job hazards and working with employers to reduce worker injuries and the time lost due to injury.
At a time when many workers deemed “essential” during the COVID-19 pandemic are navigating issues of health and safety, and looking for ways to have their voices heard, it is unconscionable that the agency responsible for ensuring workers have the right to a voice in the workplace has denied them the ability to exercise these rights. By suspending all union elections, the Trump board is betraying its responsibility to our nation’s workers when they most need these basic rights. But today’s rulemaking makes clear that the agency will find a way to conduct the business it deems important—namely, making it more difficult for workers to unionize.Read more
Older workers can’t work from home and are at a higher risk for COVID-19
Key takeaways
- Nearly three-fourths of workers age 65 and older—or over 5 million older workers—are unable to telecommute. That means that these workers, who are at higher risk for severe illness from COVID-19 because of their age, could be putting themselves at risk to earn a paycheck.
- Policymakers can mitigate the damage from workplace exposure to the coronavirus afflicting older and other highly vulnerable people by designing unemployment insurance and paid sick days measures to protect workers who are vulnerable themselves or who have vulnerable family members.
- Specifically, policymakers should extend paid sick leave to all employers, to at-risk workers, and to workers whose family members are at risk. They should also ensure that older workers who have to quit their job or lose pay due to the risks of COVID-19 are among the newly eligible for unemployment insurance under the new $2.2 trillion coronavirus package.
As COVID-19 continues to spread throughout the United States, more and more workers who are on the front lines of the economy are at risk, but little attention has been paid to the impact on older workers, who are among the most vulnerable.
Because testing is far from universal, official reports are likely to understate the extent of the pandemic, but it’s clear that older adults are at higher risk for severe illness. The Center for Disease Control and Prevention (CDC) reports that eight out of 10 deaths from COVID-19 in the U.S. have been adults ages 65 years old and older, and significant shares of older Americans require hospitalization and admission to intensive care units.
At the same time, over 5 million workers age 65 years old and older in the pre-pandemic economy could not work from home. Although some of these workers are likely to be the ones who have been laid off or furloughed in recent days, many will remain out in the workforce, going to work, risking their own health and the health of their family members. And many more workers—younger than age 65—will continue going to work and potentially risking the health of their family members who are older and/or have other health conditions that make them more vulnerable.
Exposed and underpaid: Women still make less than men, including in sectors especially affected by the coronavirus
- Women are paid 22.6% less than men with similar education and experience.
- Women doctors are paid 12% less than doctors who are men.
- Women nurses are paid 8% less than nurses who are men.
- Women who wait tables in restaurants are paid 12% less than male wait staff.
- Women desk clerks at hotels and resorts are paid 11% less than male desk clerks.
Equal Pay Day arrives in the midst of the coronavirus pandemic, and in occupations radically transformed as we deal with the crisis, women still make less than men.
According to the Bureau of Labor Statistics, one-third of working women (33.4%), compared with just 15.7% of working men, are employed in two industries that have been significantly impacted by COVID-19 in very different ways: the health care and social assistance industry, which is experiencing surging demand, and the leisure and hospitality industry, which is being crushed by closures. Women employed in both industries experience a gender wage gap.
Given this harsh reality, Equal Pay Day on March 31 is a day to call attention to the significant pay gap between men and women in our country. On average in 2019, women were paid 22.6% less than men, after controlling for race and ethnicity, education, age, and geographic division. The gaps for black and Hispanic women relative to white men are larger than the overall gap and the white men–white women gap. Compared with white men, black and Hispanic women are paid 33.7% and 33.0% less, respectively, after controlling for age, education, and geographic division. For white women, the gap is 25.7%.
The timing of these events also coincides with March, Women’s History Month, a time to reflect on the often overlooked contributions women have made to the United States. At this historic moment, both the essential contributions as well as the economic vulnerabilities of working women have taken center stage.
EPI President Thea Lee tells MSNBC’s Velshi the coronavirus shines a light on economic inequality in the United States
“This crisis has laid bare the underlying inequality in the U.S. economy,” said EPI President Thea Lee Friday on MSNBC’s The Last Word hosted by Ali Velshi. Because of these inequities, she added, “we were ill-prepared for this crisis.”
Now, she stressed, we need universal paid sick leave, a health care system that doesn’t bankrupt people, and a stronger unemployment insurance system to “make sure we aren’t as ill-prepared for the next crisis.”
With smart policy, a temporary collapse in GDP doesn’t have to cause great human suffering
The “social distancing” measures needed to slow the spread of the coronavirus clearly reduce economic activity. A growing meme in recent days argues that this reduction might be so damaging that it would be a societal benefit to end the social distancing measures shortly and try to return to normal economic activity.
This is extraordinarily risky from a public health perspective—the potential deaths caused by a premature end to social distancing measures—without exaggeration—could reach the millions.
Further, a scenario that saw this many deaths would also see tens of millions of workers falling so ill they would be unable to work for extended periods. This would cause an economic shock of its own.
Finally, and most fundamentally, this view that terrible (but generally unspecified) economic damage will inevitably occur due to the recent public health measures undertaken represents a profound misunderstanding of how the economy works, and how smart policy measures can neutralize this type of trade-off.
To see why, consider a quick thought experiment.Read more
The CARES Act’s aid to state and local governments isn’t enough to shield vital public services from the coronavirus shock: Lessons from the Great Recession tell us why
The recently passed Coronavirus Aid, Relief and Economic Security (CARES) Act is an important step in the right direction toward providing economic relief during the coronavirus pandemic, but it contains some serious flaws, including inadequate aid to state and local governments. The aid is both too stingy and too restrictive, providing insufficient relief to hold state and local budgets harmless against the effects of the crisis and forcing them to jump through bureaucratic hoops even to get this insufficient amount. The lessons of the Great Recession tell us that this aid shortfall could carry serious economic ramifications. Unlike the federal government, state and local governments must largely balance their budgets. This means that when revenues fall off a cliff because of lower incomes and spending during this economic crisis, state and local governments will face serious fiscal constraints, often leading to budget cuts that further depress demand in the economy. During the Great Recession, such budget cuts severely hampered the economic recovery. The economic recovery also taught us what works: additional federal Medicaid matching funds. The American Recovery and Reinvestment Act of 2009’s enhanced federal Medicaid matching funds helped to alleviate the budget constraints that state and local governments faced. Research has since shown that these increased federal funds stood out as providing some of the greatest bang for the buck as economic stimulus.Read more
Early state unemployment insurance data foreshadow the massive shock the coronavirus is having on state labor markets: The real surge will be seen in next week’s data
The data released yesterday by the Department of Labor showed there was a breathtaking increase in the number of people filing for unemployment insurance (UI) during the week ending in March 21, 2020. Initial UI claims skyrocketed to 3.3 million last week—a nearly 1,500% increase over three weeks ago, when 211,000 initial claims were filed.
The comparable state-level data on UI claims is released one week later than the national data, so the most recent information available at the state-level is for two weeks ago—the week ending March 14. While this does not capture the staggering spike in claims that we saw last week, the early effects of coronavirus are already apparent in many states. Figure A displays the percent change in unemployment insurance claims from the prior week.
UI is a critical tool for ensuring that those who are out of work or have seen their hours reduced are still able to make ends meet. The CARES Act, which Congress is currently debating, would adapt UI to meet the needs of the current crisis by expanding who is eligible (gig workers and the self-employed are usually excluded), giving an additional $600 in weekly benefits, and reducing burdensome waiting period, job search, and earnings requirements. Still, UI is just one of many policy levers that should be used to support workers throughout this crisis. Policymakers in every state should work to ensure that they are protecting public health while reducing economic harm to workers.Read more
Without fast action from Congress, low-wage workers will be ineligible for unemployment benefits during the coronavirus crisis
Key takeaways
- Without immediate action from Congress, large numbers of low-wage workers won’t be eligible to get unemployment checks.
- Many workers don’t make enough money to qualify for unemployment because they work low hours or are in low-paying jobs (e.g., fast-food workers or retail clerks).
- Federal and state legislators can act to protect these most vulnerable workers.
- The Coronavirus Aid, Relief and Economic Security (CARES) Act—which has passed the Senate by unanimous consent and is moving to the House today—is a good first step to fill the hole low-wage workers fall into during this crisis.
- The CARES Act expands eligibility to workers who typically have been unable to get unemployment benefits, such as those who are self-employed, are seeking part-time work, or do not have sufficient work history to qualify for unemployment insurance.
About 3 million workers filed unemployment claims last week, and 14 million workers are expected to be out of work by June. Large numbers of those who lose their jobs will be low-wage workers, and unfortunately many will be ineligible for unemployment compensation under current overly restrictive eligibility rules.
Federal and state legislators, however, have the power to act and come to the aid of these vulnerable workers. The Coronavirus Aid, Relief and Economic Security (CARES) Act—which has passed the Senate by unanimous consent and is moving to the House today—has notable limitations, but would greatly expand eligibility for unemployment insurance.
The expansion is necessary and important because unemployment benefits are generally limited to those who had high enough earnings when they were working. But low-wage workers experience higher rates of joblessness, lowering their baseline earnings and making them less eligible to collect UI benefits.
Figure A shows that unemployment rates are substantially higher for low-wage workers, defined as those workers who earn less than their state’s 30th percentile wage.
During the Great Recession, nearly one out of five workers who had earned low wages also experienced some unemployment. In contrast, unemployment rates were only about half as high for the rest of the workforce who earned more than their state’s 30th percentile wage. Given the toll on the service industry during the current pandemic, we should expect unemployment to skyrocket for low-wage workers.Read more
The coronavirus pandemic highlights that Americans need more options to vote
The coronavirus outbreak has caused 10 U.S. states and territories to postpone their 2020 primary elections in order to reduce the spread of the virus by protecting voters and poll workers—a majority of whom are age 61 and older and face the greatest risk from the virus. These postponements demonstrate the urgent need for safe, alternative voting methods to safeguard democracy amid a pandemic, especially before November’s general election.
One promising method is a vote-by-mail system. Five states—Colorado, Hawaii, Oregon, Washington, and Utah—already conduct their elections through mail. Several voting rights groups have expressed support for a vote-by-mail system for the remaining primaries and the general election. And the U.S. House of Representative’s latest coronavirus response bill proposes a national requirement of 15 days of early voting, no-excuse absentee voting, and mailing ballots to all registered voters during an emergency.
We should also consider a radical change to our voting options: online voting. While online voting may seem farfetched, it has already been successfully implemented in some U.S. elections. For example, earlier this year, the Greater Seattle area held the first election in U.S. history where all voters could cast a ballot by smartphone, while West Virginia has allowed voters living overseas to vote using a mobile app. Given that 81% of Americans own smartphones, studies show that online voting could dramatically increase voter turnout. Imagine the kinds of policies lawmakers could enact, that would represent the views of all Americans, if we had higher voter turnout due to more voting options. Think about how many primaries could continue as scheduled this year if Americans were given all options to vote.
Despite some good provisions, the CARES Act has glaring flaws and falls short of fully protecting workers during the coronavirus crisis
The Coronavirus Aid, Relief and Economic Security (CARES) Act is an important step in the U.S. response to the coronavirus pandemic. It includes provisions for expanded unemployment insurance ($250 billion), aid to small businesses ($350 billion), cash payments to households ($300 billion), aid to states ($150 billion), emergency funding for health care supplies and investments ($100 billion), and money for industry bailouts ($450 billion). The total package will provide more than $2 trillion in funds.
There is much to like in this package, and timely relief is critical. But it also contains many flaws, largely left over from the first proposal forwarded by Senate Republicans. Because many of the weaknesses of this first proposal remain, the package will not be up to the job of fully protecting U.S. workers and their families from the economic consequences of the coronavirus shock, and it will not allow the economy to reboot quickly enough once the public health crisis ends. Further help from policymakers will clearly be needed.
When we estimated that a relief and recovery package needed to be at least $2.1 trillion just through the end of 2020, we noted that this was the number for a package that was well-targeted and would reliably deliver the vast majority of benefits to workers and their families. The CARES Act does not do that. Even though it includes more than $2 trillion in funding, key design failures mean the legislation will not be large enough to provide the necessary economic relief and recovery. The economy will continue to operate significantly below potential through the end of the year, even in optimistic scenarios where the shock caused by social distancing measures is relatively short.
States are projected to lose more jobs due to the coronavirus: 14 million jobs could be lost by summer
Last week, we published a map showing the job losses in each state likely to occur over the coming months as businesses shutter in response to the social distancing measures necessary to stop the spread of COVID-19. Sadly, our predictions were likely too optimistic. Expectations of how many jobs will ultimately be lost are rapidly evolving, with new forecasts from different macroeconomic analysts being released on an almost daily basis. As new data and projections become available, EPI is updating our estimates of the number of jobs nationally, and by state, that the economy is likely to lose in the coming months.
Our best guess at this point is that the national economy could lose 14 million jobs by summer 2020. These estimates assume $1 trillion in fiscal stimulus—in other words, even with $1 trillion in stimulus, the job losses will be enormous. EPI estimates we will need at least $2.1 trillion in federal stimulus through 2020 to restore the country to reasonable economic health. Congress is debating an economic stimulus package around $2 trillion, and if it is targeted enough, it could help mitigate some of these losses. Yet even with these measures, many people will still need to remain out of work, potentially for months, in order to stop the virus’s spread. In addition to federal action, lawmakers at the state and local levels must do everything they can to ensure that these workers and their families do not suffer economically during this time.
As with our previous post, the map in Figure A shows how the projected 14 million jobs lost nationally are likely to be distributed across the states. The national job losses are distributed in proportion to the average of each state’s share of total national private-sector employment and each state’s share of national retail, leisure, and hospitality employment. We give added weight to these sectors as they are likely to be disproportionately affected by the social distancing measures that are needed to slow this pandemic. States like Nevada, Montana, and Hawaii are projected to lose the highest percentage of their employment because a large amount of their workforce is employed in the leisure, hospitality, and retail sectors.Read more
Southern state policymakers must do more to respond to the coronavirus pandemic: Medicaid expansion, emergency paid sick leave, and dedicated public health resources are especially needed
This piece is the first in a three-part series examining the economic and social conditions that impact health outcomes in Southern states, and how these conditions leave communities underprepared to protect frontline workers and communities during the pandemic.
U.S. federal lawmakers are poised to pass a stimulus package to combat the coronavirus pandemic’s public health and economic damage. In a recent post, we laid out the critical steps that state and local lawmakers should take to protect workers and families, slow the spread of the virus, and mitigate its economic toll. This piece will highlight how state and local policymakers in the Southern states are responding to the crisis, and what more is needed.
Health organizations broadly recognize that where we live and work impacts health risks and health outcomes. By recognizing the economic and social conditions that influence health equity for people living in Southern states, policymakers can provide more targeted solutions to protect public health and support families already struggling to make ends meet.
Nurses in garbage bags?: Why the Trump administration must use the Defense Production Act to mobilize production of critically needed hospital protective equipment immediately
On Tuesday, New York Governor Andrew Cuomo spent much of his coronavirus press conference imploring President Trump to use the Defense Production Act (DPA) now to force factories to manufacture essential medical equipment such as masks, gloves, gowns, and ventilators.
Trump has continually refused to do so, saying that the acquisition of medical supplies is a job for governors: “You know, we’re not a shipping clerk.” Yet, on a conference call last week, Republican governor Charlie Baker (Mass.) told Trump that his state had been denied three major orders for medical equipment because the federal government had outbid him.
Health care workers are at the front lines of the COVID-19 crisis. In Italy, 9% of “total COVID-19 cases are health care workers, contributing to the breakdown of the hospital system in the north of the country.” U.S. health care workers are also especially hard hit.
While both Democratic and Republican governors are pleading for help, staff in at least one nursing home have already resorted to using plastic garbage bags to make gowns, as have nurses and doctors in Spain and England.
Clearly, the DPA will make a difference.Read more
The coronavirus crisis led to a record-breaking spike in weekly unemployment insurance claims: An estimated 3.4 million workers filed for unemployment last week
A greater share of Americans filed for unemployment insurance in the week ending March 21 than in any prior week in American history, according to our analysis of news reports.
Many states reported initial claims growth of over 1,000%. Our model predicts that 3.4 million Americans filed new claims for unemployment insurance this past week, although we believe that number could be as low as 3 million or could be substantially higher. This will dwarf every other week in history, as can be seen by comparing the projection against the trend in initial claims back to 1967 (Figure A).
The U.S. is experiencing a record-breaking spike in unemployment: Initial weekly unemployment claims since 1967 and projected claims for the week ending March 21, 2020
| Week ending date | Initial claims, seasonally adjusted | Projected claims, week ending March 21, 2020 |
|---|---|---|
| 1967-01-07 | 208000 | |
| 1967-01-14 | 207000 | |
| 1967-01-21 | 217000 | |
| 1967-01-28 | 204000 | |
| 1967-02-04 | 216000 | |
| 1967-02-11 | 229000 | |
| 1967-02-18 | 229000 | |
| 1967-02-25 | 242000 | |
| 1967-03-04 | 310000 | |
| 1967-03-11 | 241000 | |
| 1967-03-18 | 245000 | |
| 1967-03-25 | 247000 | |
| 1967-04-01 | 259000 | |
| 1967-04-08 | 257000 | |
| 1967-04-15 | 299000 | |
| 1967-04-22 | 245000 | |
| 1967-04-29 | 255000 | |
| 1967-05-06 | 254000 | |
| 1967-05-13 | 231000 | |
| 1967-05-20 | 230000 | |
| 1967-05-27 | 228000 | |
| 1967-06-03 | 248000 | |
| 1967-06-10 | 238000 | |
| 1967-06-17 | 224000 | |
| 1967-06-24 | 218000 | |
| 1967-07-01 | 209000 | |
| 1967-07-08 | 240000 | |
| 1967-07-15 | 241000 | |
| 1967-07-22 | 240000 | |
| 1967-07-29 | 209000 | |
| 1967-08-05 | 221000 | |
| 1967-08-12 | 202000 | |
| 1967-08-19 | 215000 | |
| 1967-08-26 | 213000 | |
| 1967-09-02 | 218000 | |
| 1967-09-09 | 231000 | |
| 1967-09-16 | 220000 | |
| 1967-09-23 | 209000 | |
| 1967-09-30 | 204000 | |
| 1967-10-07 | 231000 | |
| 1967-10-14 | 206000 | |
| 1967-10-21 | 223000 | |
| 1967-10-28 | 207000 | |
| 1967-11-04 | 222000 | |
| 1967-11-11 | 214000 | |
| 1967-11-18 | 198000 | |
| 1967-11-25 | 191000 | |
| 1967-12-02 | 196000 | |
| 1967-12-09 | 221000 | |
| 1967-12-16 | 204000 | |
| 1967-12-23 | 219000 | |
| 1967-12-30 | 216000 | |
| 1968-01-06 | 222000 | |
| 1968-01-13 | 222000 | |
| 1968-01-20 | 221000 | |
| 1968-01-27 | 198000 | |
| 1968-02-03 | 244000 | |
| 1968-02-10 | 210000 | |
| 1968-02-17 | 196000 | |
| 1968-02-24 | 193000 | |
| 1968-03-02 | 190000 | |
| 1968-03-09 | 204000 | |
| 1968-03-16 | 190000 | |
| 1968-03-23 | 200000 | |
| 1968-03-30 | 192000 | |
| 1968-04-06 | 191000 | |
| 1968-04-13 | 171000 | |
| 1968-04-20 | 183000 | |
| 1968-04-27 | 251000 | |
| 1968-05-04 | 209000 | |
| 1968-05-11 | 194000 | |
| 1968-05-18 | 199000 | |
| 1968-05-25 | 194000 | |
| 1968-06-01 | 199000 | |
| 1968-06-08 | 192000 | |
| 1968-06-15 | 194000 | |
| 1968-06-22 | 189000 | |
| 1968-06-29 | 194000 | |
| 1968-07-06 | 214000 | |
| 1968-07-13 | 186000 | |
| 1968-07-20 | 180000 | |
| 1968-07-27 | 205000 | |
| 1968-08-03 | 206000 | |
| 1968-08-10 | 218000 | |
| 1968-08-17 | 192000 | |
| 1968-08-24 | 193000 | |
| 1968-08-31 | 188000 | |
| 1968-09-07 | 189000 | |
| 1968-09-14 | 195000 | |
| 1968-09-21 | 191000 | |
| 1968-09-28 | 189000 | |
| 1968-10-05 | 185000 | |
| 1968-10-12 | 186000 | |
| 1968-10-19 | 191000 | |
| 1968-10-26 | 182000 | |
| 1968-11-02 | 181000 | |
| 1968-11-09 | 183000 | |
| 1968-11-16 | 192000 | |
| 1968-11-23 | 199000 | |
| 1968-11-30 | 162000 | |
| 1968-12-07 | 188000 | |
| 1968-12-14 | 195000 | |
| 1968-12-21 | 192000 | |
| 1968-12-28 | 223000 | |
| 1969-01-04 | 190000 | |
| 1969-01-11 | 191000 | |
| 1969-01-18 | 192000 | |
| 1969-01-25 | 193000 | |
| 1969-02-01 | 203000 | |
| 1969-02-08 | 197000 | |
| 1969-02-15 | 192000 | |
| 1969-02-22 | 192000 | |
| 1969-03-01 | 201000 | |
| 1969-03-08 | 191000 | |
| 1969-03-15 | 189000 | |
| 1969-03-22 | 181000 | |
| 1969-03-29 | 183000 | |
| 1969-04-05 | 182000 | |
| 1969-04-12 | 190000 | |
| 1969-04-19 | 187000 | |
| 1969-04-26 | 177000 | |
| 1969-05-03 | 177000 | |
| 1969-05-10 | 183000 | |
| 1969-05-17 | 179000 | |
| 1969-05-24 | 180000 | |
| 1969-05-31 | 187000 | |
| 1969-06-07 | 192000 | |
| 1969-06-14 | 182000 | |
| 1969-06-21 | 191000 | |
| 1969-06-28 | 203000 | |
| 1969-07-05 | 227000 | |
| 1969-07-12 | 210000 | |
| 1969-07-19 | 206000 | |
| 1969-07-26 | 192000 | |
| 1969-08-02 | 196000 | |
| 1969-08-09 | 203000 | |
| 1969-08-16 | 199000 | |
| 1969-08-23 | 199000 | |
| 1969-08-30 | 195000 | |
| 1969-09-06 | 182000 | |
| 1969-09-13 | 209000 | |
| 1969-09-20 | 195000 | |
| 1969-09-27 | 193000 | |
| 1969-10-04 | 193000 | |
| 1969-10-11 | 200000 | |
| 1969-10-18 | 199000 | |
| 1969-10-25 | 205000 | |
| 1969-11-01 | 198000 | |
| 1969-11-08 | 211000 | |
| 1969-11-15 | 197000 | |
| 1969-11-22 | 217000 | |
| 1969-11-29 | 202000 | |
| 1969-12-06 | 202000 | |
| 1969-12-13 | 222000 | |
| 1969-12-20 | 232000 | |
| 1969-12-27 | 223000 | |
| 1970-01-03 | 230000 | |
| 1970-01-10 | 242000 | |
| 1970-01-17 | 268000 | |
| 1970-01-24 | 256000 | |
| 1970-01-31 | 239000 | |
| 1970-02-07 | 256000 | |
| 1970-02-14 | 265000 | |
| 1970-02-21 | 271000 | |
| 1970-02-28 | 242000 | |
| 1970-03-07 | 262000 | |
| 1970-03-14 | 271000 | |
| 1970-03-21 | 264000 | |
| 1970-03-28 | 276000 | |
| 1970-04-04 | 273000 | |
| 1970-04-11 | 305000 | |
| 1970-04-18 | 374000 | |
| 1970-04-25 | 349000 | |
| 1970-05-02 | 334000 | |
| 1970-05-09 | 318000 | |
| 1970-05-16 | 303000 | |
| 1970-05-23 | 296000 | |
| 1970-05-30 | 301000 | |
| 1970-06-06 | 301000 | |
| 1970-06-13 | 298000 | |
| 1970-06-20 | 296000 | |
| 1970-06-27 | 291000 | |
| 1970-07-04 | 277000 | |
| 1970-07-11 | 288000 | |
| 1970-07-18 | 294000 | |
| 1970-07-25 | 287000 | |
| 1970-08-01 | 261000 | |
| 1970-08-08 | 266000 | |
| 1970-08-15 | 300000 | |
| 1970-08-22 | 303000 | |
| 1970-08-29 | 297000 | |
| 1970-09-05 | 324000 | |
| 1970-09-12 | 292000 | |
| 1970-09-19 | 325000 | |
| 1970-09-26 | 333000 | |
| 1970-10-03 | 350000 | |
| 1970-10-10 | 327000 | |
| 1970-10-17 | 334000 | |
| 1970-10-24 | 330000 | |
| 1970-10-31 | 327000 | |
| 1970-11-07 | 336000 | |
| 1970-11-14 | 314000 | |
| 1970-11-21 | 314000 | |
| 1970-11-28 | 337000 | |
| 1970-12-05 | 308000 | |
| 1970-12-12 | 306000 | |
| 1970-12-19 | 289000 | |
| 1970-12-26 | 321000 | |
| 1971-01-02 | 303000 | |
| 1971-01-09 | 288000 | |
| 1971-01-16 | 299000 | |
| 1971-01-23 | 312000 | |
| 1971-01-30 | 292000 | |
| 1971-02-06 | 296000 | |
| 1971-02-13 | 282000 | |
| 1971-02-20 | 268000 | |
| 1971-02-27 | 290000 | |
| 1971-03-06 | 297000 | |
| 1971-03-13 | 287000 | |
| 1971-03-20 | 291000 | |
| 1971-03-27 | 300000 | |
| 1971-04-03 | 299000 | |
| 1971-04-10 | 279000 | |
| 1971-04-17 | 284000 | |
| 1971-04-24 | 288000 | |
| 1971-05-01 | 290000 | |
| 1971-05-08 | 293000 | |
| 1971-05-15 | 284000 | |
| 1971-05-22 | 295000 | |
| 1971-05-29 | 299000 | |
| 1971-06-05 | 301000 | |
| 1971-06-12 | 295000 | |
| 1971-06-19 | 299000 | |
| 1971-06-26 | 291000 | |
| 1971-07-03 | 277000 | |
| 1971-07-10 | 264000 | |
| 1971-07-17 | 313000 | |
| 1971-07-24 | 304000 | |
| 1971-07-31 | 308000 | |
| 1971-08-07 | 349000 | |
| 1971-08-14 | 325000 | |
| 1971-08-21 | 320000 | |
| 1971-08-28 | 307000 | |
| 1971-09-04 | 359000 | |
| 1971-09-11 | 312000 | |
| 1971-09-18 | 302000 | |
| 1971-09-25 | 308000 | |
| 1971-10-02 | 299000 | |
| 1971-10-09 | 313000 | |
| 1971-10-16 | 299000 | |
| 1971-10-23 | 294000 | |
| 1971-10-30 | 283000 | |
| 1971-11-06 | 301000 | |
| 1971-11-13 | 295000 | |
| 1971-11-20 | 274000 | |
| 1971-11-27 | 278000 | |
| 1971-12-04 | 299000 | |
| 1971-12-11 | 280000 | |
| 1971-12-18 | 269000 | |
| 1971-12-25 | 244000 | |
| 1972-01-01 | 279000 | |
| 1972-01-08 | 295000 | |
| 1972-01-15 | 250000 | |
| 1972-01-22 | 263000 | |
| 1972-01-29 | 269000 | |
| 1972-02-05 | 276000 | |
| 1972-02-12 | 266000 | |
| 1972-02-19 | 258000 | |
| 1972-02-26 | 254000 | |
| 1972-03-04 | 257000 | |
| 1972-03-11 | 264000 | |
| 1972-03-18 | 266000 | |
| 1972-03-25 | 264000 | |
| 1972-04-01 | 258000 | |
| 1972-04-08 | 274000 | |
| 1972-04-15 | 259000 | |
| 1972-04-22 | 259000 | |
| 1972-04-29 | 265000 | |
| 1972-05-06 | 271000 | |
| 1972-05-13 | 266000 | |
| 1972-05-20 | 267000 | |
| 1972-05-27 | 267000 | |
| 1972-06-03 | 264000 | |
| 1972-06-10 | 268000 | |
| 1972-06-17 | 275000 | |
| 1972-06-24 | 286000 | |
| 1972-07-01 | 350000 | |
| 1972-07-08 | 297000 | |
| 1972-07-15 | 318000 | |
| 1972-07-22 | 276000 | |
| 1972-07-29 | 247000 | |
| 1972-08-05 | 250000 | |
| 1972-08-12 | 246000 | |
| 1972-08-19 | 256000 | |
| 1972-08-26 | 262000 | |
| 1972-09-02 | 258000 | |
| 1972-09-09 | 259000 | |
| 1972-09-16 | 258000 | |
| 1972-09-23 | 255000 | |
| 1972-09-30 | 251000 | |
| 1972-10-07 | 263000 | |
| 1972-10-14 | 250000 | |
| 1972-10-21 | 257000 | |
| 1972-10-28 | 234000 | |
| 1972-11-04 | 255000 | |
| 1972-11-11 | 242000 | |
| 1972-11-18 | 271000 | |
| 1972-11-25 | 235000 | |
| 1972-12-02 | 226000 | |
| 1972-12-09 | 252000 | |
| 1972-12-16 | 263000 | |
| 1972-12-23 | 246000 | |
| 1972-12-30 | 225000 | |
| 1973-01-06 | 226000 | |
| 1973-01-13 | 245000 | |
| 1973-01-20 | 229000 | |
| 1973-01-27 | 214000 | |
| 1973-02-03 | 228000 | |
| 1973-02-10 | 226000 | |
| 1973-02-17 | 216000 | |
| 1973-02-24 | 218000 | |
| 1973-03-03 | 225000 | |
| 1973-03-10 | 229000 | |
| 1973-03-17 | 228000 | |
| 1973-03-24 | 232000 | |
| 1973-03-31 | 222000 | |
| 1973-04-07 | 247000 | |
| 1973-04-14 | 230000 | |
| 1973-04-21 | 243000 | |
| 1973-04-28 | 236000 | |
| 1973-05-05 | 248000 | |
| 1973-05-12 | 238000 | |
| 1973-05-19 | 237000 | |
| 1973-05-26 | 238000 | |
| 1973-06-02 | 232000 | |
| 1973-06-09 | 246000 | |
| 1973-06-16 | 237000 | |
| 1973-06-23 | 242000 | |
| 1973-06-30 | 237000 | |
| 1973-07-07 | 248000 | |
| 1973-07-14 | 232000 | |
| 1973-07-21 | 241000 | |
| 1973-07-28 | 250000 | |
| 1973-08-04 | 256000 | |
| 1973-08-11 | 265000 | |
| 1973-08-18 | 258000 | |
| 1973-08-25 | 254000 | |
| 1973-09-01 | 242000 | |
| 1973-09-08 | 252000 | |
| 1973-09-15 | 245000 | |
| 1973-09-22 | 246000 | |
| 1973-09-29 | 249000 | |
| 1973-10-06 | 236000 | |
| 1973-10-13 | 246000 | |
| 1973-10-20 | 249000 | |
| 1973-10-27 | 235000 | |
| 1973-11-03 | 246000 | |
| 1973-11-10 | 282000 | |
| 1973-11-17 | 254000 | |
| 1973-11-24 | 233000 | |
| 1973-12-01 | 256000 | |
| 1973-12-08 | 266000 | |
| 1973-12-15 | 272000 | |
| 1973-12-22 | 326000 | |
| 1973-12-29 | 300000 | |
| 1974-01-05 | 269000 | |
| 1974-01-12 | 340000 | |
| 1974-01-19 | 321000 | |
| 1974-01-26 | 291000 | |
| 1974-02-02 | 302000 | |
| 1974-02-09 | 369000 | |
| 1974-02-16 | 311000 | |
| 1974-02-23 | 292000 | |
| 1974-03-02 | 301000 | |
| 1974-03-09 | 305000 | |
| 1974-03-16 | 315000 | |
| 1974-03-23 | 314000 | |
| 1974-03-30 | 323000 | |
| 1974-04-06 | 296000 | |
| 1974-04-13 | 297000 | |
| 1974-04-20 | 296000 | |
| 1974-04-27 | 283000 | |
| 1974-05-04 | 287000 | |
| 1974-05-11 | 296000 | |
| 1974-05-18 | 298000 | |
| 1974-05-25 | 309000 | |
| 1974-06-01 | 278000 | |
| 1974-06-08 | 314000 | |
| 1974-06-15 | 303000 | |
| 1974-06-22 | 308000 | |
| 1974-06-29 | 325000 | |
| 1974-07-06 | 311000 | |
| 1974-07-13 | 304000 | |
| 1974-07-20 | 303000 | |
| 1974-07-27 | 320000 | |
| 1974-08-03 | 335000 | |
| 1974-08-10 | 347000 | |
| 1974-08-17 | 332000 | |
| 1974-08-24 | 343000 | |
| 1974-08-31 | 350000 | |
| 1974-09-07 | 350000 | |
| 1974-09-14 | 357000 | |
| 1974-09-21 | 370000 | |
| 1974-09-28 | 366000 | |
| 1974-10-05 | 371000 | |
| 1974-10-12 | 413000 | |
| 1974-10-19 | 389000 | |
| 1974-10-26 | 414000 | |
| 1974-11-02 | 406000 | |
| 1974-11-09 | 441000 | |
| 1974-11-16 | 449000 | |
| 1974-11-23 | 518000 | |
| 1974-11-30 | 474000 | |
| 1974-12-07 | 528000 | |
| 1974-12-14 | 510000 | |
| 1974-12-21 | 521000 | |
| 1974-12-28 | 537000 | |
| 1975-01-04 | 456000 | |
| 1975-01-11 | 554000 | |
| 1975-01-18 | 575000 | |
| 1975-01-25 | 555000 | |
| 1975-02-01 | 559000 | |
| 1975-02-08 | 545000 | |
| 1975-02-15 | 530000 | |
| 1975-02-22 | 544000 | |
| 1975-03-01 | 546000 | |
| 1975-03-08 | 551000 | |
| 1975-03-15 | 531000 | |
| 1975-03-22 | 550000 | |
| 1975-03-29 | 555000 | |
| 1975-04-05 | 537000 | |
| 1975-04-12 | 520000 | |
| 1975-04-19 | 531000 | |
| 1975-04-26 | 513000 | |
| 1975-05-03 | 505000 | |
| 1975-05-10 | 507000 | |
| 1975-05-17 | 514000 | |
| 1975-05-24 | 493000 | |
| 1975-05-31 | 475000 | |
| 1975-06-07 | 529000 | |
| 1975-06-14 | 497000 | |
| 1975-06-21 | 497000 | |
| 1975-06-28 | 459000 | |
| 1975-07-05 | 423000 | |
| 1975-07-12 | 446000 | |
| 1975-07-19 | 445000 | |
| 1975-07-26 | 454000 | |
| 1975-08-02 | 454000 | |
| 1975-08-09 | 459000 | |
| 1975-08-16 | 444000 | |
| 1975-08-23 | 457000 | |
| 1975-08-30 | 446000 | |
| 1975-09-06 | 447000 | |
| 1975-09-13 | 456000 | |
| 1975-09-20 | 433000 | |
| 1975-09-27 | 445000 | |
| 1975-10-04 | 426000 | |
| 1975-10-11 | 429000 | |
| 1975-10-18 | 404000 | |
| 1975-10-25 | 426000 | |
| 1975-11-01 | 414000 | |
| 1975-11-08 | 415000 | |
| 1975-11-15 | 386000 | |
| 1975-11-22 | 401000 | |
| 1975-11-29 | 387000 | |
| 1975-12-06 | 373000 | |
| 1975-12-13 | 368000 | |
| 1975-12-20 | 365000 | |
| 1975-12-27 | 391000 | |
| 1976-01-03 | 362000 | |
| 1976-01-10 | 402000 | |
| 1976-01-17 | 370000 | |
| 1976-01-24 | 363000 | |
| 1976-01-31 | 359000 | |
| 1976-02-07 | 353000 | |
| 1976-02-14 | 344000 | |
| 1976-02-21 | 347000 | |
| 1976-02-28 | 349000 | |
| 1976-03-06 | 348000 | |
| 1976-03-13 | 360000 | |
| 1976-03-20 | 368000 | |
| 1976-03-27 | 366000 | |
| 1976-04-03 | 380000 | |
| 1976-04-10 | 373000 | |
| 1976-04-17 | 361000 | |
| 1976-04-24 | 367000 | |
| 1976-05-01 | 385000 | |
| 1976-05-08 | 395000 | |
| 1976-05-15 | 382000 | |
| 1976-05-22 | 394000 | |
| 1976-05-29 | 402000 | |
| 1976-06-05 | 382000 | |
| 1976-06-12 | 407000 | |
| 1976-06-19 | 399000 | |
| 1976-06-26 | 387000 | |
| 1976-07-03 | 394000 | |
| 1976-07-10 | 372000 | |
| 1976-07-17 | 406000 | |
| 1976-07-24 | 394000 | |
| 1976-07-31 | 388000 | |
| 1976-08-07 | 378000 | |
| 1976-08-14 | 382000 | |
| 1976-08-21 | 400000 | |
| 1976-08-28 | 394000 | |
| 1976-09-04 | 421000 | |
| 1976-09-11 | 383000 | |
| 1976-09-18 | 403000 | |
| 1976-09-25 | 423000 | |
| 1976-10-02 | 408000 | |
| 1976-10-09 | 411000 | |
| 1976-10-16 | 403000 | |
| 1976-10-23 | 409000 | |
| 1976-10-30 | 414000 | |
| 1976-11-06 | 390000 | |
| 1976-11-13 | 383000 | |
| 1976-11-20 | 408000 | |
| 1976-11-27 | 377000 | |
| 1976-12-04 | 402000 | |
| 1976-12-11 | 395000 | |
| 1976-12-18 | 365000 | |
| 1976-12-25 | 333000 | |
| 1977-01-01 | 380000 | |
| 1977-01-08 | 416000 | |
| 1977-01-15 | 368000 | |
| 1977-01-22 | 423000 | |
| 1977-01-29 | 422000 | |
| 1977-02-05 | 565000 | |
| 1977-02-12 | 477000 | |
| 1977-02-19 | 399000 | |
| 1977-02-26 | 362000 | |
| 1977-03-05 | 361000 | |
| 1977-03-12 | 355000 | |
| 1977-03-19 | 369000 | |
| 1977-03-26 | 356000 | |
| 1977-04-02 | 350000 | |
| 1977-04-09 | 376000 | |
| 1977-04-16 | 361000 | |
| 1977-04-23 | 375000 | |
| 1977-04-30 | 375000 | |
| 1977-05-07 | 384000 | |
| 1977-05-14 | 381000 | |
| 1977-05-21 | 375000 | |
| 1977-05-28 | 381000 | |
| 1977-06-04 | 363000 | |
| 1977-06-11 | 358000 | |
| 1977-06-18 | 359000 | |
| 1977-06-25 | 365000 | |
| 1977-07-02 | 350000 | |
| 1977-07-09 | 361000 | |
| 1977-07-16 | 366000 | |
| 1977-07-23 | 365000 | |
| 1977-07-30 | 365000 | |
| 1977-08-06 | 378000 | |
| 1977-08-13 | 359000 | |
| 1977-08-20 | 367000 | |
| 1977-08-27 | 365000 | |
| 1977-09-03 | 374000 | |
| 1977-09-10 | 359000 | |
| 1977-09-17 | 362000 | |
| 1977-09-24 | 380000 | |
| 1977-10-01 | 348000 | |
| 1977-10-08 | 365000 | |
| 1977-10-15 | 358000 | |
| 1977-10-22 | 375000 | |
| 1977-10-29 | 349000 | |
| 1977-11-05 | 366000 | |
| 1977-11-12 | 334000 | |
| 1977-11-19 | 360000 | |
| 1977-11-26 | 354000 | |
| 1977-12-03 | 367000 | |
| 1977-12-10 | 364000 | |
| 1977-12-17 | 359000 | |
| 1977-12-24 | 344000 | |
| 1977-12-31 | 364000 | |
| 1978-01-07 | 346000 | |
| 1978-01-14 | 343000 | |
| 1978-01-21 | 352000 | |
| 1978-01-28 | 363000 | |
| 1978-02-04 | 360000 | |
| 1978-02-11 | 373000 | |
| 1978-02-18 | 429000 | |
| 1978-02-25 | 371000 | |
| 1978-03-04 | 355000 | |
| 1978-03-11 | 359000 | |
| 1978-03-18 | 347000 | |
| 1978-03-25 | 335000 | |
| 1978-04-01 | 333000 | |
| 1978-04-08 | 345000 | |
| 1978-04-15 | 309000 | |
| 1978-04-22 | 319000 | |
| 1978-04-29 | 324000 | |
| 1978-05-06 | 334000 | |
| 1978-05-13 | 322000 | |
| 1978-05-20 | 334000 | |
| 1978-05-27 | 318000 | |
| 1978-06-03 | 310000 | |
| 1978-06-10 | 331000 | |
| 1978-06-17 | 326000 | |
| 1978-06-24 | 330000 | |
| 1978-07-01 | 348000 | |
| 1978-07-08 | 356000 | |
| 1978-07-15 | 352000 | |
| 1978-07-22 | 349000 | |
| 1978-07-29 | 346000 | |
| 1978-08-05 | 365000 | |
| 1978-08-12 | 354000 | |
| 1978-08-19 | 343000 | |
| 1978-08-26 | 333000 | |
| 1978-09-02 | 313000 | |
| 1978-09-09 | 337000 | |
| 1978-09-16 | 322000 | |
| 1978-09-23 | 323000 | |
| 1978-09-30 | 318000 | |
| 1978-10-07 | 343000 | |
| 1978-10-14 | 316000 | |
| 1978-10-21 | 338000 | |
| 1978-10-28 | 316000 | |
| 1978-11-04 | 317000 | |
| 1978-11-11 | 304000 | |
| 1978-11-18 | 342000 | |
| 1978-11-25 | 359000 | |
| 1978-12-02 | 377000 | |
| 1978-12-09 | 344000 | |
| 1978-12-16 | 347000 | |
| 1978-12-23 | 352000 | |
| 1978-12-30 | 358000 | |
| 1979-01-06 | 359000 | |
| 1979-01-13 | 392000 | |
| 1979-01-20 | 337000 | |
| 1979-01-27 | 342000 | |
| 1979-02-03 | 348000 | |
| 1979-02-10 | 359000 | |
| 1979-02-17 | 367000 | |
| 1979-02-24 | 360000 | |
| 1979-03-03 | 355000 | |
| 1979-03-10 | 363000 | |
| 1979-03-17 | 359000 | |
| 1979-03-24 | 353000 | |
| 1979-03-31 | 360000 | |
| 1979-04-07 | 465000 | |
| 1979-04-14 | 457000 | |
| 1979-04-21 | 383000 | |
| 1979-04-28 | 357000 | |
| 1979-05-05 | 353000 | |
| 1979-05-12 | 344000 | |
| 1979-05-19 | 346000 | |
| 1979-05-26 | 349000 | |
| 1979-06-02 | 336000 | |
| 1979-06-09 | 365000 | |
| 1979-06-16 | 351000 | |
| 1979-06-23 | 379000 | |
| 1979-06-30 | 369000 | |
| 1979-07-07 | 368000 | |
| 1979-07-14 | 368000 | |
| 1979-07-21 | 395000 | |
| 1979-07-28 | 386000 | |
| 1979-08-04 | 412000 | |
| 1979-08-11 | 386000 | |
| 1979-08-18 | 387000 | |
| 1979-08-25 | 390000 | |
| 1979-09-01 | 389000 | |
| 1979-09-08 | 378000 | |
| 1979-09-15 | 384000 | |
| 1979-09-22 | 388000 | |
| 1979-09-29 | 390000 | |
| 1979-10-06 | 412000 | |
| 1979-10-13 | 393000 | |
| 1979-10-20 | 406000 | |
| 1979-10-27 | 398000 | |
| 1979-11-03 | 395000 | |
| 1979-11-10 | 414000 | |
| 1979-11-17 | 430000 | |
| 1979-11-24 | 414000 | |
| 1979-12-01 | 416000 | |
| 1979-12-08 | 415000 | |
| 1979-12-15 | 411000 | |
| 1979-12-22 | 471000 | |
| 1979-12-29 | 428000 | |
| 1980-01-05 | 394000 | |
| 1980-01-12 | 405000 | |
| 1980-01-19 | 446000 | |
| 1980-01-26 | 412000 | |
| 1980-02-02 | 404000 | |
| 1980-02-09 | 425000 | |
| 1980-02-16 | 415000 | |
| 1980-02-23 | 428000 | |
| 1980-03-01 | 409000 | |
| 1980-03-08 | 418000 | |
| 1980-03-15 | 432000 | |
| 1980-03-22 | 435000 | |
| 1980-03-29 | 475000 | |
| 1980-04-05 | 464000 | |
| 1980-04-12 | 544000 | |
| 1980-04-19 | 548000 | |
| 1980-04-26 | 563000 | |
| 1980-05-03 | 572000 | |
| 1980-05-10 | 601000 | |
| 1980-05-17 | 642000 | |
| 1980-05-24 | 627000 | |
| 1980-05-31 | 637000 | |
| 1980-06-07 | 610000 | |
| 1980-06-14 | 592000 | |
| 1980-06-21 | 599000 | |
| 1980-06-28 | 627000 | |
| 1980-07-05 | 579000 | |
| 1980-07-12 | 533000 | |
| 1980-07-19 | 567000 | |
| 1980-07-26 | 558000 | |
| 1980-08-02 | 569000 | |
| 1980-08-09 | 533000 | |
| 1980-08-16 | 525000 | |
| 1980-08-23 | 512000 | |
| 1980-08-30 | 502000 | |
| 1980-09-06 | 511000 | |
| 1980-09-13 | 492000 | |
| 1980-09-20 | 465000 | |
| 1980-09-27 | 463000 | |
| 1980-10-04 | 462000 | |
| 1980-10-11 | 447000 | |
| 1980-10-18 | 425000 | |
| 1980-10-25 | 418000 | |
| 1980-11-01 | 419000 | |
| 1980-11-08 | 407000 | |
| 1980-11-15 | 427000 | |
| 1980-11-22 | 398000 | |
| 1980-11-29 | 412000 | |
| 1980-12-06 | 416000 | |
| 1980-12-13 | 413000 | |
| 1980-12-20 | 412000 | |
| 1980-12-27 | 399000 | |
| 1981-01-03 | 410000 | |
| 1981-01-10 | 419000 | |
| 1981-01-17 | 421000 | |
| 1981-01-24 | 396000 | |
| 1981-01-31 | 419000 | |
| 1981-02-07 | 420000 | |
| 1981-02-14 | 423000 | |
| 1981-02-21 | 438000 | |
| 1981-02-28 | 434000 | |
| 1981-03-07 | 409000 | |
| 1981-03-14 | 408000 | |
| 1981-03-21 | 401000 | |
| 1981-03-28 | 412000 | |
| 1981-04-04 | 417000 | |
| 1981-04-11 | 396000 | |
| 1981-04-18 | 392000 | |
| 1981-04-25 | 436000 | |
| 1981-05-02 | 413000 | |
| 1981-05-09 | 423000 | |
| 1981-05-16 | 414000 | |
| 1981-05-23 | 415000 | |
| 1981-05-30 | 417000 | |
| 1981-06-06 | 428000 | |
| 1981-06-13 | 425000 | |
| 1981-06-20 | 435000 | |
| 1981-06-27 | 444000 | |
| 1981-07-04 | 460000 | |
| 1981-07-11 | 426000 | |
| 1981-07-18 | 430000 | |
| 1981-07-25 | 407000 | |
| 1981-08-01 | 476000 | |
| 1981-08-08 | 448000 | |
| 1981-08-15 | 442000 | |
| 1981-08-22 | 434000 | |
| 1981-08-29 | 451000 | |
| 1981-09-05 | 473000 | |
| 1981-09-12 | 454000 | |
| 1981-09-19 | 475000 | |
| 1981-09-26 | 491000 | |
| 1981-10-03 | 489000 | |
| 1981-10-10 | 491000 | |
| 1981-10-17 | 487000 | |
| 1981-10-24 | 483000 | |
| 1981-10-31 | 514000 | |
| 1981-11-07 | 514000 | |
| 1981-11-14 | 517000 | |
| 1981-11-21 | 464000 | |
| 1981-11-28 | 552000 | |
| 1981-12-05 | 558000 | |
| 1981-12-12 | 551000 | |
| 1981-12-19 | 539000 | |
| 1981-12-26 | 556000 | |
| 1982-01-02 | 495000 | |
| 1982-01-09 | 545000 | |
| 1982-01-16 | 489000 | |
| 1982-01-23 | 564000 | |
| 1982-01-30 | 583000 | |
| 1982-02-06 | 556000 | |
| 1982-02-13 | 507000 | |
| 1982-02-20 | 544000 | |
| 1982-02-27 | 528000 | |
| 1982-03-06 | 556000 | |
| 1982-03-13 | 539000 | |
| 1982-03-20 | 557000 | |
| 1982-03-27 | 574000 | |
| 1982-04-03 | 578000 | |
| 1982-04-10 | 585000 | |
| 1982-04-17 | 597000 | |
| 1982-04-24 | 588000 | |
| 1982-05-01 | 576000 | |
| 1982-05-08 | 584000 | |
| 1982-05-15 | 585000 | |
| 1982-05-22 | 586000 | |
| 1982-05-29 | 588000 | |
| 1982-06-05 | 611000 | |
| 1982-06-12 | 614000 | |
| 1982-06-19 | 591000 | |
| 1982-06-26 | 582000 | |
| 1982-07-03 | 600000 | |
| 1982-07-10 | 572000 | |
| 1982-07-17 | 567000 | |
| 1982-07-24 | 536000 | |
| 1982-07-31 | 605000 | |
| 1982-08-07 | 606000 | |
| 1982-08-14 | 637000 | |
| 1982-08-21 | 628000 | |
| 1982-08-28 | 647000 | |
| 1982-09-04 | 651000 | |
| 1982-09-11 | 641000 | |
| 1982-09-18 | 680000 | |
| 1982-09-25 | 671000 | |
| 1982-10-02 | 695000 | |
| 1982-10-09 | 651000 | |
| 1982-10-16 | 656000 | |
| 1982-10-23 | 623000 | |
| 1982-10-30 | 637000 | |
| 1982-11-06 | 589000 | |
| 1982-11-13 | 599000 | |
| 1982-11-20 | 577000 | |
| 1982-11-27 | 612000 | |
| 1982-12-04 | 557000 | |
| 1982-12-11 | 533000 | |
| 1982-12-18 | 516000 | |
| 1982-12-25 | 489000 | |
| 1983-01-01 | 534000 | |
| 1983-01-08 | 510000 | |
| 1983-01-15 | 479000 | |
| 1983-01-22 | 479000 | |
| 1983-01-29 | 503000 | |
| 1983-02-05 | 501000 | |
| 1983-02-12 | 486000 | |
| 1983-02-19 | 487000 | |
| 1983-02-26 | 481000 | |
| 1983-03-05 | 495000 | |
| 1983-03-12 | 475000 | |
| 1983-03-19 | 470000 | |
| 1983-03-26 | 481000 | |
| 1983-04-02 | 491000 | |
| 1983-04-09 | 496000 | |
| 1983-04-16 | 515000 | |
| 1983-04-23 | 488000 | |
| 1983-04-30 | 490000 | |
| 1983-05-07 | 494000 | |
| 1983-05-14 | 464000 | |
| 1983-05-21 | 460000 | |
| 1983-05-28 | 454000 | |
| 1983-06-04 | 459000 | |
| 1983-06-11 | 442000 | |
| 1983-06-18 | 434000 | |
| 1983-06-25 | 442000 | |
| 1983-07-02 | 422000 | |
| 1983-07-09 | 412000 | |
| 1983-07-16 | 396000 | |
| 1983-07-23 | 395000 | |
| 1983-07-30 | 415000 | |
| 1983-08-06 | 415000 | |
| 1983-08-13 | 457000 | |
| 1983-08-20 | 445000 | |
| 1983-08-27 | 426000 | |
| 1983-09-03 | 411000 | |
| 1983-09-10 | 403000 | |
| 1983-09-17 | 405000 | |
| 1983-09-24 | 416000 | |
| 1983-10-01 | 413000 | |
| 1983-10-08 | 406000 | |
| 1983-10-15 | 394000 | |
| 1983-10-22 | 394000 | |
| 1983-10-29 | 404000 | |
| 1983-11-05 | 395000 | |
| 1983-11-12 | 390000 | |
| 1983-11-19 | 387000 | |
| 1983-11-26 | 398000 | |
| 1983-12-03 | 365000 | |
| 1983-12-10 | 368000 | |
| 1983-12-17 | 362000 | |
| 1983-12-24 | 377000 | |
| 1983-12-31 | 372000 | |
| 1984-01-07 | 356000 | |
| 1984-01-14 | 351000 | |
| 1984-01-21 | 333000 | |
| 1984-01-28 | 364000 | |
| 1984-02-04 | 342000 | |
| 1984-02-11 | 338000 | |
| 1984-02-18 | 334000 | |
| 1984-02-25 | 343000 | |
| 1984-03-03 | 347000 | |
| 1984-03-10 | 346000 | |
| 1984-03-17 | 349000 | |
| 1984-03-24 | 346000 | |
| 1984-03-31 | 341000 | |
| 1984-04-07 | 381000 | |
| 1984-04-14 | 357000 | |
| 1984-04-21 | 364000 | |
| 1984-04-28 | 375000 | |
| 1984-05-05 | 365000 | |
| 1984-05-12 | 368000 | |
| 1984-05-19 | 354000 | |
| 1984-05-26 | 354000 | |
| 1984-06-02 | 355000 | |
| 1984-06-09 | 369000 | |
| 1984-06-16 | 361000 | |
| 1984-06-23 | 362000 | |
| 1984-06-30 | 360000 | |
| 1984-07-07 | 366000 | |
| 1984-07-14 | 360000 | |
| 1984-07-21 | 357000 | |
| 1984-07-28 | 359000 | |
| 1984-08-04 | 382000 | |
| 1984-08-11 | 380000 | |
| 1984-08-18 | 401000 | |
| 1984-08-25 | 395000 | |
| 1984-09-01 | 385000 | |
| 1984-09-08 | 402000 | |
| 1984-09-15 | 393000 | |
| 1984-09-22 | 395000 | |
| 1984-09-29 | 402000 | |
| 1984-10-06 | 403000 | |
| 1984-10-13 | 410000 | |
| 1984-10-20 | 439000 | |
| 1984-10-27 | 425000 | |
| 1984-11-03 | 423000 | |
| 1984-11-10 | 393000 | |
| 1984-11-17 | 383000 | |
| 1984-11-24 | 429000 | |
| 1984-12-01 | 401000 | |
| 1984-12-08 | 383000 | |
| 1984-12-15 | 386000 | |
| 1984-12-22 | 379000 | |
| 1984-12-29 | 379000 | |
| 1985-01-05 | 369000 | |
| 1985-01-12 | 387000 | |
| 1985-01-19 | 359000 | |
| 1985-01-26 | 368000 | |
| 1985-02-02 | 386000 | |
| 1985-02-09 | 401000 | |
| 1985-02-16 | 390000 | |
| 1985-02-23 | 390000 | |
| 1985-03-02 | 374000 | |
| 1985-03-09 | 385000 | |
| 1985-03-16 | 386000 | |
| 1985-03-23 | 373000 | |
| 1985-03-30 | 386000 | |
| 1985-04-06 | 405000 | |
| 1985-04-13 | 411000 | |
| 1985-04-20 | 391000 | |
| 1985-04-27 | 386000 | |
| 1985-05-04 | 390000 | |
| 1985-05-11 | 394000 | |
| 1985-05-18 | 391000 | |
| 1985-05-25 | 396000 | |
| 1985-06-01 | 393000 | |
| 1985-06-08 | 403000 | |
| 1985-06-15 | 390000 | |
| 1985-06-22 | 386000 | |
| 1985-06-29 | 390000 | |
| 1985-07-06 | 395000 | |
| 1985-07-13 | 386000 | |
| 1985-07-20 | 370000 | |
| 1985-07-27 | 362000 | |
| 1985-08-03 | 407000 | |
| 1985-08-10 | 402000 | |
| 1985-08-17 | 399000 | |
| 1985-08-24 | 405000 | |
| 1985-08-31 | 409000 | |
| 1985-09-07 | 426000 | |
| 1985-09-14 | 408000 | |
| 1985-09-21 | 401000 | |
| 1985-09-28 | 399000 | |
| 1985-10-05 | 405000 | |
| 1985-10-12 | 400000 | |
| 1985-10-19 | 400000 | |
| 1985-10-26 | 418000 | |
| 1985-11-02 | 398000 | |
| 1985-11-09 | 397000 | |
| 1985-11-16 | 397000 | |
| 1985-11-23 | 382000 | |
| 1985-11-30 | 393000 | |
| 1985-12-07 | 399000 | |
| 1985-12-14 | 382000 | |
| 1985-12-21 | 370000 | |
| 1985-12-28 | 390000 | |
| 1986-01-04 | 362000 | |
| 1986-01-11 | 397000 | |
| 1986-01-18 | 364000 | |
| 1986-01-25 | 344000 | |
| 1986-02-01 | 364000 | |
| 1986-02-08 | 366000 | |
| 1986-02-15 | 358000 | |
| 1986-02-22 | 390000 | |
| 1986-03-01 | 375000 | |
| 1986-03-08 | 366000 | |
| 1986-03-15 | 382000 | |
| 1986-03-22 | 387000 | |
| 1986-03-29 | 396000 | |
| 1986-04-05 | 381000 | |
| 1986-04-12 | 388000 | |
| 1986-04-19 | 383000 | |
| 1986-04-26 | 391000 | |
| 1986-05-03 | 392000 | |
| 1986-05-10 | 395000 | |
| 1986-05-17 | 384000 | |
| 1986-05-24 | 386000 | |
| 1986-05-31 | 373000 | |
| 1986-06-07 | 375000 | |
| 1986-06-14 | 369000 | |
| 1986-06-21 | 367000 | |
| 1986-06-28 | 371000 | |
| 1986-07-05 | 371000 | |
| 1986-07-12 | 361000 | |
| 1986-07-19 | 354000 | |
| 1986-07-26 | 362000 | |
| 1986-08-02 | 416000 | |
| 1986-08-09 | 416000 | |
| 1986-08-16 | 407000 | |
| 1986-08-23 | 397000 | |
| 1986-08-30 | 401000 | |
| 1986-09-06 | 400000 | |
| 1986-09-13 | 394000 | |
| 1986-09-20 | 399000 | |
| 1986-09-27 | 389000 | |
| 1986-10-04 | 391000 | |
| 1986-10-11 | 387000 | |
| 1986-10-18 | 385000 | |
| 1986-10-25 | 370000 | |
| 1986-11-01 | 364000 | |
| 1986-11-08 | 349000 | |
| 1986-11-15 | 368000 | |
| 1986-11-22 | 369000 | |
| 1986-11-29 | 366000 | |
| 1986-12-06 | 363000 | |
| 1986-12-13 | 375000 | |
| 1986-12-20 | 350000 | |
| 1986-12-27 | 345000 | |
| 1987-01-03 | 323000 | |
| 1987-01-10 | 348000 | |
| 1987-01-17 | 341000 | |
| 1987-01-24 | 346000 | |
| 1987-01-31 | 370000 | |
| 1987-02-07 | 368000 | |
| 1987-02-14 | 338000 | |
| 1987-02-21 | 341000 | |
| 1987-02-28 | 348000 | |
| 1987-03-07 | 337000 | |
| 1987-03-14 | 335000 | |
| 1987-03-21 | 335000 | |
| 1987-03-28 | 326000 | |
| 1987-04-04 | 330000 | |
| 1987-04-11 | 338000 | |
| 1987-04-18 | 349000 | |
| 1987-04-25 | 328000 | |
| 1987-05-02 | 330000 | |
| 1987-05-09 | 315000 | |
| 1987-05-16 | 341000 | |
| 1987-05-23 | 343000 | |
| 1987-05-30 | 326000 | |
| 1987-06-06 | 328000 | |
| 1987-06-13 | 316000 | |
| 1987-06-20 | 319000 | |
| 1987-06-27 | 326000 | |
| 1987-07-04 | 326000 | |
| 1987-07-11 | 317000 | |
| 1987-07-18 | 310000 | |
| 1987-07-25 | 324000 | |
| 1987-08-01 | 348000 | |
| 1987-08-08 | 327000 | |
| 1987-08-15 | 319000 | |
| 1987-08-22 | 312000 | |
| 1987-08-29 | 322000 | |
| 1987-09-05 | 316000 | |
| 1987-09-12 | 297000 | |
| 1987-09-19 | 309000 | |
| 1987-09-26 | 317000 | |
| 1987-10-03 | 301000 | |
| 1987-10-10 | 308000 | |
| 1987-10-17 | 301000 | |
| 1987-10-24 | 301000 | |
| 1987-10-31 | 289000 | |
| 1987-11-07 | 297000 | |
| 1987-11-14 | 307000 | |
| 1987-11-21 | 317000 | |
| 1987-11-28 | 306000 | |
| 1987-12-05 | 319000 | |
| 1987-12-12 | 317000 | |
| 1987-12-19 | 323000 | |
| 1987-12-26 | 316000 | |
| 1988-01-02 | 315000 | |
| 1988-01-09 | 325000 | |
| 1988-01-16 | 361000 | |
| 1988-01-23 | 335000 | |
| 1988-01-30 | 342000 | |
| 1988-02-06 | 318000 | |
| 1988-02-13 | 311000 | |
| 1988-02-20 | 327000 | |
| 1988-02-27 | 319000 | |
| 1988-03-05 | 307000 | |
| 1988-03-12 | 304000 | |
| 1988-03-19 | 307000 | |
| 1988-03-26 | 304000 | |
| 1988-04-02 | 309000 | |
| 1988-04-09 | 313000 | |
| 1988-04-16 | 314000 | |
| 1988-04-23 | 312000 | |
| 1988-04-30 | 313000 | |
| 1988-05-07 | 309000 | |
| 1988-05-14 | 314000 | |
| 1988-05-21 | 319000 | |
| 1988-05-28 | 313000 | |
| 1988-06-04 | 310000 | |
| 1988-06-11 | 305000 | |
| 1988-06-18 | 311000 | |
| 1988-06-25 | 307000 | |
| 1988-07-02 | 305000 | |
| 1988-07-09 | 303000 | |
| 1988-07-16 | 315000 | |
| 1988-07-23 | 354000 | |
| 1988-07-30 | 331000 | |
| 1988-08-06 | 316000 | |
| 1988-08-13 | 312000 | |
| 1988-08-20 | 316000 | |
| 1988-08-27 | 315000 | |
| 1988-09-03 | 306000 | |
| 1988-09-10 | 305000 | |
| 1988-09-17 | 306000 | |
| 1988-09-24 | 301000 | |
| 1988-10-01 | 292000 | |
| 1988-10-08 | 292000 | |
| 1988-10-15 | 293000 | |
| 1988-10-22 | 286000 | |
| 1988-10-29 | 294000 | |
| 1988-11-05 | 285000 | |
| 1988-11-12 | 284000 | |
| 1988-11-19 | 294000 | |
| 1988-11-26 | 299000 | |
| 1988-12-03 | 298000 | |
| 1988-12-10 | 285000 | |
| 1988-12-17 | 293000 | |
| 1988-12-24 | 286000 | |
| 1988-12-31 | 304000 | |
| 1989-01-07 | 299000 | |
| 1989-01-14 | 283000 | |
| 1989-01-21 | 282000 | |
| 1989-01-28 | 295000 | |
| 1989-02-04 | 288000 | |
| 1989-02-11 | 322000 | |
| 1989-02-18 | 305000 | |
| 1989-02-25 | 300000 | |
| 1989-03-04 | 325000 | |
| 1989-03-11 | 325000 | |
| 1989-03-18 | 319000 | |
| 1989-03-25 | 319000 | |
| 1989-04-01 | 323000 | |
| 1989-04-08 | 314000 | |
| 1989-04-15 | 307000 | |
| 1989-04-22 | 304000 | |
| 1989-04-29 | 311000 | |
| 1989-05-06 | 320000 | |
| 1989-05-13 | 332000 | |
| 1989-05-20 | 321000 | |
| 1989-05-27 | 325000 | |
| 1989-06-03 | 325000 | |
| 1989-06-10 | 332000 | |
| 1989-06-17 | 337000 | |
| 1989-06-24 | 338000 | |
| 1989-07-01 | 349000 | |
| 1989-07-08 | 341000 | |
| 1989-07-15 | 349000 | |
| 1989-07-22 | 332000 | |
| 1989-07-29 | 337000 | |
| 1989-08-05 | 338000 | |
| 1989-08-12 | 341000 | |
| 1989-08-19 | 327000 | |
| 1989-08-26 | 332000 | |
| 1989-09-02 | 329000 | |
| 1989-09-09 | 336000 | |
| 1989-09-16 | 334000 | |
| 1989-09-23 | 334000 | |
| 1989-09-30 | 347000 | |
| 1989-10-07 | 407000 | |
| 1989-10-14 | 345000 | |
| 1989-10-21 | 347000 | |
| 1989-10-28 | 354000 | |
| 1989-11-04 | 333000 | |
| 1989-11-11 | 336000 | |
| 1989-11-18 | 336000 | |
| 1989-11-25 | 342000 | |
| 1989-12-02 | 344000 | |
| 1989-12-09 | 338000 | |
| 1989-12-16 | 355000 | |
| 1989-12-23 | 381000 | |
| 1989-12-30 | 358000 | |
| 1990-01-06 | 355000 | |
| 1990-01-13 | 369000 | |
| 1990-01-20 | 375000 | |
| 1990-01-27 | 345000 | |
| 1990-02-03 | 368000 | |
| 1990-02-10 | 367000 | |
| 1990-02-17 | 348000 | |
| 1990-02-24 | 350000 | |
| 1990-03-03 | 351000 | |
| 1990-03-10 | 349000 | |
| 1990-03-17 | 349000 | |
| 1990-03-24 | 331000 | |
| 1990-03-31 | 346000 | |
| 1990-04-07 | 367000 | |
| 1990-04-14 | 357000 | |
| 1990-04-21 | 360000 | |
| 1990-04-28 | 363000 | |
| 1990-05-05 | 354000 | |
| 1990-05-12 | 355000 | |
| 1990-05-19 | 353000 | |
| 1990-05-26 | 359000 | |
| 1990-06-02 | 368000 | |
| 1990-06-09 | 359000 | |
| 1990-06-16 | 359000 | |
| 1990-06-23 | 362000 | |
| 1990-06-30 | 364000 | |
| 1990-07-07 | 362000 | |
| 1990-07-14 | 367000 | |
| 1990-07-21 | 370000 | |
| 1990-07-28 | 369000 | |
| 1990-08-04 | 369000 | |
| 1990-08-11 | 381000 | |
| 1990-08-18 | 393000 | |
| 1990-08-25 | 394000 | |
| 1990-09-01 | 392000 | |
| 1990-09-08 | 390000 | |
| 1990-09-15 | 395000 | |
| 1990-09-22 | 389000 | |
| 1990-09-29 | 404000 | |
| 1990-10-06 | 404000 | |
| 1990-10-13 | 422000 | |
| 1990-10-20 | 435000 | |
| 1990-10-27 | 440000 | |
| 1990-11-03 | 430000 | |
| 1990-11-10 | 448000 | |
| 1990-11-17 | 447000 | |
| 1990-11-24 | 462000 | |
| 1990-12-01 | 451000 | |
| 1990-12-08 | 449000 | |
| 1990-12-15 | 447000 | |
| 1990-12-22 | 474000 | |
| 1990-12-29 | 454000 | |
| 1991-01-05 | 415000 | |
| 1991-01-12 | 437000 | |
| 1991-01-19 | 445000 | |
| 1991-01-26 | 462000 | |
| 1991-02-02 | 483000 | |
| 1991-02-09 | 480000 | |
| 1991-02-16 | 474000 | |
| 1991-02-23 | 499000 | |
| 1991-03-02 | 488000 | |
| 1991-03-09 | 499000 | |
| 1991-03-16 | 498000 | |
| 1991-03-23 | 509000 | |
| 1991-03-30 | 499000 | |
| 1991-04-06 | 452000 | |
| 1991-04-13 | 477000 | |
| 1991-04-20 | 478000 | |
| 1991-04-27 | 462000 | |
| 1991-05-04 | 451000 | |
| 1991-05-11 | 446000 | |
| 1991-05-18 | 448000 | |
| 1991-05-25 | 443000 | |
| 1991-06-01 | 432000 | |
| 1991-06-08 | 441000 | |
| 1991-06-15 | 429000 | |
| 1991-06-22 | 423000 | |
| 1991-06-29 | 418000 | |
| 1991-07-06 | 422000 | |
| 1991-07-13 | 420000 | |
| 1991-07-20 | 408000 | |
| 1991-07-27 | 423000 | |
| 1991-08-03 | 438000 | |
| 1991-08-10 | 437000 | |
| 1991-08-17 | 433000 | |
| 1991-08-24 | 425000 | |
| 1991-08-31 | 425000 | |
| 1991-09-07 | 424000 | |
| 1991-09-14 | 418000 | |
| 1991-09-21 | 419000 | |
| 1991-09-28 | 437000 | |
| 1991-10-05 | 424000 | |
| 1991-10-12 | 425000 | |
| 1991-10-19 | 419000 | |
| 1991-10-26 | 423000 | |
| 1991-11-02 | 447000 | |
| 1991-11-09 | 453000 | |
| 1991-11-16 | 439000 | |
| 1991-11-23 | 444000 | |
| 1991-11-30 | 444000 | |
| 1991-12-07 | 475000 | |
| 1991-12-14 | 475000 | |
| 1991-12-21 | 436000 | |
| 1991-12-28 | 441000 | |
| 1992-01-04 | 432000 | |
| 1992-01-11 | 440000 | |
| 1992-01-18 | 443000 | |
| 1992-01-25 | 441000 | |
| 1992-02-01 | 440000 | |
| 1992-02-08 | 445000 | |
| 1992-02-15 | 446000 | |
| 1992-02-22 | 436000 | |
| 1992-02-29 | 444000 | |
| 1992-03-07 | 421000 | |
| 1992-03-14 | 437000 | |
| 1992-03-21 | 440000 | |
| 1992-03-28 | 420000 | |
| 1992-04-04 | 412000 | |
| 1992-04-11 | 413000 | |
| 1992-04-18 | 424000 | |
| 1992-04-25 | 424000 | |
| 1992-05-02 | 431000 | |
| 1992-05-09 | 417000 | |
| 1992-05-16 | 414000 | |
| 1992-05-23 | 414000 | |
| 1992-05-30 | 411000 | |
| 1992-06-06 | 416000 | |
| 1992-06-13 | 420000 | |
| 1992-06-20 | 419000 | |
| 1992-06-27 | 420000 | |
| 1992-07-04 | 407000 | |
| 1992-07-11 | 408000 | |
| 1992-07-18 | 392000 | |
| 1992-07-25 | 564000 | |
| 1992-08-01 | 423000 | |
| 1992-08-08 | 406000 | |
| 1992-08-15 | 401000 | |
| 1992-08-22 | 398000 | |
| 1992-08-29 | 408000 | |
| 1992-09-05 | 416000 | |
| 1992-09-12 | 416000 | |
| 1992-09-19 | 427000 | |
| 1992-09-26 | 409000 | |
| 1992-10-03 | 398000 | |
| 1992-10-10 | 374000 | |
| 1992-10-17 | 385000 | |
| 1992-10-24 | 367000 | |
| 1992-10-31 | 365000 | |
| 1992-11-07 | 374000 | |
| 1992-11-14 | 377000 | |
| 1992-11-21 | 357000 | |
| 1992-11-28 | 341000 | |
| 1992-12-05 | 350000 | |
| 1992-12-12 | 359000 | |
| 1992-12-19 | 334000 | |
| 1992-12-26 | 313000 | |
| 1993-01-02 | 341000 | |
| 1993-01-09 | 354000 | |
| 1993-01-16 | 352000 | |
| 1993-01-23 | 341000 | |
| 1993-01-30 | 340000 | |
| 1993-02-06 | 319000 | |
| 1993-02-13 | 321000 | |
| 1993-02-20 | 351000 | |
| 1993-02-27 | 362000 | |
| 1993-03-06 | 354000 | |
| 1993-03-13 | 346000 | |
| 1993-03-20 | 338000 | |
| 1993-03-27 | 366000 | |
| 1993-04-03 | 365000 | |
| 1993-04-10 | 353000 | |
| 1993-04-17 | 351000 | |
| 1993-04-24 | 350000 | |
| 1993-05-01 | 343000 | |
| 1993-05-08 | 339000 | |
| 1993-05-15 | 345000 | |
| 1993-05-22 | 342000 | |
| 1993-05-29 | 349000 | |
| 1993-06-05 | 343000 | |
| 1993-06-12 | 343000 | |
| 1993-06-19 | 345000 | |
| 1993-06-26 | 340000 | |
| 1993-07-03 | 334000 | |
| 1993-07-10 | 314000 | |
| 1993-07-17 | 335000 | |
| 1993-07-24 | 415000 | |
| 1993-07-31 | 356000 | |
| 1993-08-07 | 346000 | |
| 1993-08-14 | 339000 | |
| 1993-08-21 | 342000 | |
| 1993-08-28 | 337000 | |
| 1993-09-04 | 334000 | |
| 1993-09-11 | 333000 | |
| 1993-09-18 | 346000 | |
| 1993-09-25 | 343000 | |
| 1993-10-02 | 333000 | |
| 1993-10-09 | 355000 | |
| 1993-10-16 | 359000 | |
| 1993-10-23 | 354000 | |
| 1993-10-30 | 348000 | |
| 1993-11-06 | 350000 | |
| 1993-11-13 | 341000 | |
| 1993-11-20 | 336000 | |
| 1993-11-27 | 337000 | |
| 1993-12-04 | 337000 | |
| 1993-12-11 | 334000 | |
| 1993-12-18 | 331000 | |
| 1993-12-25 | 290000 | |
| 1994-01-01 | 341000 | |
| 1994-01-08 | 343000 | |
| 1994-01-15 | 355000 | |
| 1994-01-22 | 351000 | |
| 1994-01-29 | 406000 | |
| 1994-02-05 | 361000 | |
| 1994-02-12 | 354000 | |
| 1994-02-19 | 352000 | |
| 1994-02-26 | 327000 | |
| 1994-03-05 | 348000 | |
| 1994-03-12 | 341000 | |
| 1994-03-19 | 332000 | |
| 1994-03-26 | 322000 | |
| 1994-04-02 | 342000 | |
| 1994-04-09 | 349000 | |
| 1994-04-16 | 354000 | |
| 1994-04-23 | 331000 | |
| 1994-04-30 | 344000 | |
| 1994-05-07 | 371000 | |
| 1994-05-14 | 360000 | |
| 1994-05-21 | 357000 | |
| 1994-05-28 | 348000 | |
| 1994-06-04 | 345000 | |
| 1994-06-11 | 338000 | |
| 1994-06-18 | 336000 | |
| 1994-06-25 | 341000 | |
| 1994-07-02 | 334000 | |
| 1994-07-09 | 341000 | |
| 1994-07-16 | 359000 | |
| 1994-07-23 | 345000 | |
| 1994-07-30 | 332000 | |
| 1994-08-06 | 338000 | |
| 1994-08-13 | 335000 | |
| 1994-08-20 | 331000 | |
| 1994-08-27 | 341000 | |
| 1994-09-03 | 339000 | |
| 1994-09-10 | 331000 | |
| 1994-09-17 | 326000 | |
| 1994-09-24 | 325000 | |
| 1994-10-01 | 330000 | |
| 1994-10-08 | 341000 | |
| 1994-10-15 | 335000 | |
| 1994-10-22 | 330000 | |
| 1994-10-29 | 331000 | |
| 1994-11-05 | 328000 | |
| 1994-11-12 | 329000 | |
| 1994-11-19 | 326000 | |
| 1994-11-26 | 329000 | |
| 1994-12-03 | 324000 | |
| 1994-12-10 | 329000 | |
| 1994-12-17 | 330000 | |
| 1994-12-24 | 314000 | |
| 1994-12-31 | 319000 | |
| 1995-01-07 | 338000 | |
| 1995-01-14 | 347000 | |
| 1995-01-21 | 325000 | |
| 1995-01-28 | 324000 | |
| 1995-02-04 | 324000 | |
| 1995-02-11 | 348000 | |
| 1995-02-18 | 343000 | |
| 1995-02-25 | 336000 | |
| 1995-03-04 | 339000 | |
| 1995-03-11 | 347000 | |
| 1995-03-18 | 343000 | |
| 1995-03-25 | 332000 | |
| 1995-04-01 | 335000 | |
| 1995-04-08 | 347000 | |
| 1995-04-15 | 355000 | |
| 1995-04-22 | 349000 | |
| 1995-04-29 | 365000 | |
| 1995-05-06 | 364000 | |
| 1995-05-13 | 366000 | |
| 1995-05-20 | 377000 | |
| 1995-05-27 | 374000 | |
| 1995-06-03 | 362000 | |
| 1995-06-10 | 367000 | |
| 1995-06-17 | 378000 | |
| 1995-06-24 | 358000 | |
| 1995-07-01 | 355000 | |
| 1995-07-08 | 372000 | |
| 1995-07-15 | 389000 | |
| 1995-07-22 | 390000 | |
| 1995-07-29 | 351000 | |
| 1995-08-05 | 351000 | |
| 1995-08-12 | 353000 | |
| 1995-08-19 | 362000 | |
| 1995-08-26 | 359000 | |
| 1995-09-02 | 355000 | |
| 1995-09-09 | 371000 | |
| 1995-09-16 | 376000 | |
| 1995-09-23 | 353000 | |
| 1995-09-30 | 355000 | |
| 1995-10-07 | 374000 | |
| 1995-10-14 | 369000 | |
| 1995-10-21 | 366000 | |
| 1995-10-28 | 377000 | |
| 1995-11-04 | 380000 | |
| 1995-11-11 | 370000 | |
| 1995-11-18 | 379000 | |
| 1995-11-25 | 379000 | |
| 1995-12-02 | 373000 | |
| 1995-12-09 | 346000 | |
| 1995-12-16 | 373000 | |
| 1995-12-23 | 374000 | |
| 1995-12-30 | 359000 | |
| 1996-01-06 | 361000 | |
| 1996-01-13 | 333000 | |
| 1996-01-20 | 415000 | |
| 1996-01-27 | 387000 | |
| 1996-02-03 | 374000 | |
| 1996-02-10 | 387000 | |
| 1996-02-17 | 383000 | |
| 1996-02-24 | 365000 | |
| 1996-03-02 | 368000 | |
| 1996-03-09 | 361000 | |
| 1996-03-16 | 384000 | |
| 1996-03-23 | 426000 | |
| 1996-03-30 | 393000 | |
| 1996-04-06 | 369000 | |
| 1996-04-13 | 357000 | |
| 1996-04-20 | 368000 | |
| 1996-04-27 | 343000 | |
| 1996-05-04 | 338000 | |
| 1996-05-11 | 352000 | |
| 1996-05-18 | 345000 | |
| 1996-05-25 | 343000 | |
| 1996-06-01 | 340000 | |
| 1996-06-08 | 351000 | |
| 1996-06-15 | 342000 | |
| 1996-06-22 | 341000 | |
| 1996-06-29 | 337000 | |
| 1996-07-06 | 342000 | |
| 1996-07-13 | 347000 | |
| 1996-07-20 | 332000 | |
| 1996-07-27 | 327000 | |
| 1996-08-03 | 326000 | |
| 1996-08-10 | 331000 | |
| 1996-08-17 | 336000 | |
| 1996-08-24 | 337000 | |
| 1996-08-31 | 329000 | |
| 1996-09-07 | 333000 | |
| 1996-09-14 | 338000 | |
| 1996-09-21 | 352000 | |
| 1996-09-28 | 348000 | |
| 1996-10-05 | 335000 | |
| 1996-10-12 | 334000 | |
| 1996-10-19 | 335000 | |
| 1996-10-26 | 352000 | |
| 1996-11-02 | 334000 | |
| 1996-11-09 | 327000 | |
| 1996-11-16 | 342000 | |
| 1996-11-23 | 347000 | |
| 1996-11-30 | 332000 | |
| 1996-12-07 | 355000 | |
| 1996-12-14 | 352000 | |
| 1996-12-21 | 350000 | |
| 1996-12-28 | 357000 | |
| 1997-01-04 | 347000 | |
| 1997-01-11 | 324000 | |
| 1997-01-18 | 345000 | |
| 1997-01-25 | 340000 | |
| 1997-02-01 | 333000 | |
| 1997-02-08 | 315000 | |
| 1997-02-15 | 313000 | |
| 1997-02-22 | 322000 | |
| 1997-03-01 | 321000 | |
| 1997-03-08 | 317000 | |
| 1997-03-15 | 319000 | |
| 1997-03-22 | 315000 | |
| 1997-03-29 | 325000 | |
| 1997-04-05 | 325000 | |
| 1997-04-12 | 330000 | |
| 1997-04-19 | 316000 | |
| 1997-04-26 | 337000 | |
| 1997-05-03 | 342000 | |
| 1997-05-10 | 318000 | |
| 1997-05-17 | 322000 | |
| 1997-05-24 | 316000 | |
| 1997-05-31 | 321000 | |
| 1997-06-07 | 329000 | |
| 1997-06-14 | 335000 | |
| 1997-06-21 | 316000 | |
| 1997-06-28 | 322000 | |
| 1997-07-05 | 346000 | |
| 1997-07-12 | 328000 | |
| 1997-07-19 | 301000 | |
| 1997-07-26 | 306000 | |
| 1997-08-02 | 320000 | |
| 1997-08-09 | 329000 | |
| 1997-08-16 | 343000 | |
| 1997-08-23 | 327000 | |
| 1997-08-30 | 332000 | |
| 1997-09-06 | 313000 | |
| 1997-09-13 | 314000 | |
| 1997-09-20 | 317000 | |
| 1997-09-27 | 317000 | |
| 1997-10-04 | 311000 | |
| 1997-10-11 | 305000 | |
| 1997-10-18 | 318000 | |
| 1997-10-25 | 306000 | |
| 1997-11-01 | 313000 | |
| 1997-11-08 | 308000 | |
| 1997-11-15 | 325000 | |
| 1997-11-22 | 309000 | |
| 1997-11-29 | 318000 | |
| 1997-12-06 | 317000 | |
| 1997-12-13 | 323000 | |
| 1997-12-20 | 310000 | |
| 1997-12-27 | 303000 | |
| 1998-01-03 | 312000 | |
| 1998-01-10 | 331000 | |
| 1998-01-17 | 341000 | |
| 1998-01-24 | 307000 | |
| 1998-01-31 | 315000 | |
| 1998-02-07 | 311000 | |
| 1998-02-14 | 321000 | |
| 1998-02-21 | 327000 | |
| 1998-02-28 | 317000 | |
| 1998-03-07 | 308000 | |
| 1998-03-14 | 319000 | |
| 1998-03-21 | 321000 | |
| 1998-03-28 | 312000 | |
| 1998-04-04 | 312000 | |
| 1998-04-11 | 304000 | |
| 1998-04-18 | 317000 | |
| 1998-04-25 | 311000 | |
| 1998-05-02 | 304000 | |
| 1998-05-09 | 306000 | |
| 1998-05-16 | 315000 | |
| 1998-05-23 | 309000 | |
| 1998-05-30 | 322000 | |
| 1998-06-06 | 306000 | |
| 1998-06-13 | 321000 | |
| 1998-06-20 | 349000 | |
| 1998-06-27 | 376000 | |
| 1998-07-04 | 362000 | |
| 1998-07-11 | 320000 | |
| 1998-07-18 | 315000 | |
| 1998-07-25 | 335000 | |
| 1998-08-01 | 327000 | |
| 1998-08-08 | 316000 | |
| 1998-08-15 | 308000 | |
| 1998-08-22 | 302000 | |
| 1998-08-29 | 310000 | |
| 1998-09-05 | 313000 | |
| 1998-09-12 | 304000 | |
| 1998-09-19 | 305000 | |
| 1998-09-26 | 294000 | |
| 1998-10-03 | 302000 | |
| 1998-10-10 | 316000 | |
| 1998-10-17 | 318000 | |
| 1998-10-24 | 309000 | |
| 1998-10-31 | 308000 | |
| 1998-11-07 | 316000 | |
| 1998-11-14 | 334000 | |
| 1998-11-21 | 304000 | |
| 1998-11-28 | 310000 | |
| 1998-12-05 | 326000 | |
| 1998-12-12 | 305000 | |
| 1998-12-19 | 297000 | |
| 1998-12-26 | 336000 | |
| 1999-01-02 | 331000 | |
| 1999-01-09 | 345000 | |
| 1999-01-16 | 339000 | |
| 1999-01-23 | 311000 | |
| 1999-01-30 | 305000 | |
| 1999-02-06 | 291000 | |
| 1999-02-13 | 312000 | |
| 1999-02-20 | 302000 | |
| 1999-02-27 | 301000 | |
| 1999-03-06 | 300000 | |
| 1999-03-13 | 308000 | |
| 1999-03-20 | 305000 | |
| 1999-03-27 | 298000 | |
| 1999-04-03 | 310000 | |
| 1999-04-10 | 319000 | |
| 1999-04-17 | 314000 | |
| 1999-04-24 | 291000 | |
| 1999-05-01 | 296000 | |
| 1999-05-08 | 310000 | |
| 1999-05-15 | 301000 | |
| 1999-05-22 | 298000 | |
| 1999-05-29 | 303000 | |
| 1999-06-05 | 303000 | |
| 1999-06-12 | 290000 | |
| 1999-06-19 | 292000 | |
| 1999-06-26 | 291000 | |
| 1999-07-03 | 287000 | |
| 1999-07-10 | 288000 | |
| 1999-07-17 | 309000 | |
| 1999-07-24 | 306000 | |
| 1999-07-31 | 300000 | |
| 1999-08-07 | 295000 | |
| 1999-08-14 | 292000 | |
| 1999-08-21 | 286000 | |
| 1999-08-28 | 290000 | |
| 1999-09-04 | 290000 | |
| 1999-09-11 | 281000 | |
| 1999-09-18 | 281000 | |
| 1999-09-25 | 306000 | |
| 1999-10-02 | 309000 | |
| 1999-10-09 | 291000 | |
| 1999-10-16 | 287000 | |
| 1999-10-23 | 280000 | |
| 1999-10-30 | 285000 | |
| 1999-11-06 | 282000 | |
| 1999-11-13 | 281000 | |
| 1999-11-20 | 276000 | |
| 1999-11-27 | 288000 | |
| 1999-12-04 | 287000 | |
| 1999-12-11 | 272000 | |
| 1999-12-18 | 287000 | |
| 1999-12-25 | 268000 | |
| 2000-01-01 | 286000 | |
| 2000-01-08 | 298000 | |
| 2000-01-15 | 289000 | |
| 2000-01-22 | 284000 | |
| 2000-01-29 | 285000 | |
| 2000-02-05 | 312000 | |
| 2000-02-12 | 300000 | |
| 2000-02-19 | 283000 | |
| 2000-02-26 | 280000 | |
| 2000-03-04 | 286000 | |
| 2000-03-11 | 270000 | |
| 2000-03-18 | 271000 | |
| 2000-03-25 | 272000 | |
| 2000-04-01 | 266000 | |
| 2000-04-08 | 268000 | |
| 2000-04-15 | 259000 | |
| 2000-04-22 | 274000 | |
| 2000-04-29 | 291000 | |
| 2000-05-06 | 293000 | |
| 2000-05-13 | 276000 | |
| 2000-05-20 | 280000 | |
| 2000-05-27 | 280000 | |
| 2000-06-03 | 290000 | |
| 2000-06-10 | 284000 | |
| 2000-06-17 | 294000 | |
| 2000-06-24 | 296000 | |
| 2000-07-01 | 281000 | |
| 2000-07-08 | 293000 | |
| 2000-07-15 | 303000 | |
| 2000-07-22 | 300000 | |
| 2000-07-29 | 298000 | |
| 2000-08-05 | 306000 | |
| 2000-08-12 | 315000 | |
| 2000-08-19 | 318000 | |
| 2000-08-26 | 312000 | |
| 2000-09-02 | 301000 | |
| 2000-09-09 | 309000 | |
| 2000-09-16 | 311000 | |
| 2000-09-23 | 288000 | |
| 2000-09-30 | 292000 | |
| 2000-10-07 | 309000 | |
| 2000-10-14 | 299000 | |
| 2000-10-21 | 295000 | |
| 2000-10-28 | 301000 | |
| 2000-11-04 | 331000 | |
| 2000-11-11 | 318000 | |
| 2000-11-18 | 332000 | |
| 2000-11-25 | 356000 | |
| 2000-12-02 | 338000 | |
| 2000-12-09 | 321000 | |
| 2000-12-16 | 354000 | |
| 2000-12-23 | 364000 | |
| 2000-12-30 | 353000 | |
| 2001-01-06 | 337000 | |
| 2001-01-13 | 318000 | |
| 2001-01-20 | 343000 | |
| 2001-01-27 | 362000 | |
| 2001-02-03 | 376000 | |
| 2001-02-10 | 365000 | |
| 2001-02-17 | 358000 | |
| 2001-02-24 | 386000 | |
| 2001-03-03 | 384000 | |
| 2001-03-10 | 393000 | |
| 2001-03-17 | 393000 | |
| 2001-03-24 | 378000 | |
| 2001-03-31 | 388000 | |
| 2001-04-07 | 398000 | |
| 2001-04-14 | 383000 | |
| 2001-04-21 | 400000 | |
| 2001-04-28 | 406000 | |
| 2001-05-05 | 381000 | |
| 2001-05-12 | 390000 | |
| 2001-05-19 | 402000 | |
| 2001-05-26 | 405000 | |
| 2001-06-02 | 406000 | |
| 2001-06-09 | 411000 | |
| 2001-06-16 | 394000 | |
| 2001-06-23 | 381000 | |
| 2001-06-30 | 394000 | |
| 2001-07-07 | 401000 | |
| 2001-07-14 | 405000 | |
| 2001-07-21 | 398000 | |
| 2001-07-28 | 388000 | |
| 2001-08-04 | 401000 | |
| 2001-08-11 | 394000 | |
| 2001-08-18 | 402000 | |
| 2001-08-25 | 395000 | |
| 2001-09-01 | 402000 | |
| 2001-09-08 | 408000 | |
| 2001-09-15 | 395000 | |
| 2001-09-22 | 453000 | |
| 2001-09-29 | 517000 | |
| 2001-10-06 | 476000 | |
| 2001-10-13 | 482000 | |
| 2001-10-20 | 482000 | |
| 2001-10-27 | 483000 | |
| 2001-11-03 | 440000 | |
| 2001-11-10 | 428000 | |
| 2001-11-17 | 431000 | |
| 2001-11-24 | 491000 | |
| 2001-12-01 | 465000 | |
| 2001-12-08 | 393000 | |
| 2001-12-15 | 389000 | |
| 2001-12-22 | 416000 | |
| 2001-12-29 | 421000 | |
| 2002-01-05 | 397000 | |
| 2002-01-12 | 418000 | |
| 2002-01-19 | 405000 | |
| 2002-01-26 | 414000 | |
| 2002-02-02 | 404000 | |
| 2002-02-09 | 397000 | |
| 2002-02-16 | 397000 | |
| 2002-02-23 | 398000 | |
| 2002-03-02 | 392000 | |
| 2002-03-09 | 399000 | |
| 2002-03-16 | 392000 | |
| 2002-03-23 | 415000 | |
| 2002-03-30 | 479000 | |
| 2002-04-06 | 445000 | |
| 2002-04-13 | 442000 | |
| 2002-04-20 | 416000 | |
| 2002-04-27 | 414000 | |
| 2002-05-04 | 409000 | |
| 2002-05-11 | 413000 | |
| 2002-05-18 | 411000 | |
| 2002-05-25 | 403000 | |
| 2002-06-01 | 378000 | |
| 2002-06-08 | 388000 | |
| 2002-06-15 | 396000 | |
| 2002-06-22 | 388000 | |
| 2002-06-29 | 386000 | |
| 2002-07-06 | 391000 | |
| 2002-07-13 | 384000 | |
| 2002-07-20 | 379000 | |
| 2002-07-27 | 390000 | |
| 2002-08-03 | 388000 | |
| 2002-08-10 | 389000 | |
| 2002-08-17 | 399000 | |
| 2002-08-24 | 398000 | |
| 2002-08-31 | 394000 | |
| 2002-09-07 | 416000 | |
| 2002-09-14 | 412000 | |
| 2002-09-21 | 401000 | |
| 2002-09-28 | 409000 | |
| 2002-10-05 | 404000 | |
| 2002-10-12 | 405000 | |
| 2002-10-19 | 412000 | |
| 2002-10-26 | 409000 | |
| 2002-11-02 | 405000 | |
| 2002-11-09 | 400000 | |
| 2002-11-16 | 389000 | |
| 2002-11-23 | 390000 | |
| 2002-11-30 | 377000 | |
| 2002-12-07 | 425000 | |
| 2002-12-14 | 429000 | |
| 2002-12-21 | 394000 | |
| 2002-12-28 | 409000 | |
| 2003-01-04 | 393000 | |
| 2003-01-11 | 378000 | |
| 2003-01-18 | 402000 | |
| 2003-01-25 | 407000 | |
| 2003-02-01 | 413000 | |
| 2003-02-08 | 390000 | |
| 2003-02-15 | 420000 | |
| 2003-02-22 | 421000 | |
| 2003-03-01 | 436000 | |
| 2003-03-08 | 424000 | |
| 2003-03-15 | 430000 | |
| 2003-03-22 | 411000 | |
| 2003-03-29 | 436000 | |
| 2003-04-05 | 417000 | |
| 2003-04-12 | 434000 | |
| 2003-04-19 | 450000 | |
| 2003-04-26 | 444000 | |
| 2003-05-03 | 428000 | |
| 2003-05-10 | 417000 | |
| 2003-05-17 | 425000 | |
| 2003-05-24 | 419000 | |
| 2003-05-31 | 431000 | |
| 2003-06-07 | 429000 | |
| 2003-06-14 | 421000 | |
| 2003-06-21 | 408000 | |
| 2003-06-28 | 429000 | |
| 2003-07-05 | 433000 | |
| 2003-07-12 | 412000 | |
| 2003-07-19 | 403000 | |
| 2003-07-26 | 398000 | |
| 2003-08-02 | 401000 | |
| 2003-08-09 | 404000 | |
| 2003-08-16 | 398000 | |
| 2003-08-23 | 391000 | |
| 2003-08-30 | 407000 | |
| 2003-09-06 | 422000 | |
| 2003-09-13 | 394000 | |
| 2003-09-20 | 379000 | |
| 2003-09-27 | 387000 | |
| 2003-10-04 | 386000 | |
| 2003-10-11 | 376000 | |
| 2003-10-18 | 387000 | |
| 2003-10-25 | 379000 | |
| 2003-11-01 | 363000 | |
| 2003-11-08 | 371000 | |
| 2003-11-15 | 370000 | |
| 2003-11-22 | 354000 | |
| 2003-11-29 | 357000 | |
| 2003-12-06 | 367000 | |
| 2003-12-13 | 363000 | |
| 2003-12-20 | 354000 | |
| 2003-12-27 | 349000 | |
| 2004-01-03 | 356000 | |
| 2004-01-10 | 354000 | |
| 2004-01-17 | 362000 | |
| 2004-01-24 | 353000 | |
| 2004-01-31 | 376000 | |
| 2004-02-07 | 380000 | |
| 2004-02-14 | 356000 | |
| 2004-02-21 | 359000 | |
| 2004-02-28 | 348000 | |
| 2004-03-06 | 344000 | |
| 2004-03-13 | 338000 | |
| 2004-03-20 | 346000 | |
| 2004-03-27 | 340000 | |
| 2004-04-03 | 335000 | |
| 2004-04-10 | 355000 | |
| 2004-04-17 | 364000 | |
| 2004-04-24 | 339000 | |
| 2004-05-01 | 324000 | |
| 2004-05-08 | 329000 | |
| 2004-05-15 | 349000 | |
| 2004-05-22 | 342000 | |
| 2004-05-29 | 337000 | |
| 2004-06-05 | 355000 | |
| 2004-06-12 | 339000 | |
| 2004-06-19 | 354000 | |
| 2004-06-26 | 348000 | |
| 2004-07-03 | 326000 | |
| 2004-07-10 | 345000 | |
| 2004-07-17 | 355000 | |
| 2004-07-24 | 348000 | |
| 2004-07-31 | 341000 | |
| 2004-08-07 | 336000 | |
| 2004-08-14 | 332000 | |
| 2004-08-21 | 343000 | |
| 2004-08-28 | 352000 | |
| 2004-09-04 | 326000 | |
| 2004-09-11 | 331000 | |
| 2004-09-18 | 341000 | |
| 2004-09-25 | 351000 | |
| 2004-10-02 | 335000 | |
| 2004-10-09 | 338000 | |
| 2004-10-16 | 327000 | |
| 2004-10-23 | 338000 | |
| 2004-10-30 | 332000 | |
| 2004-11-06 | 330000 | |
| 2004-11-13 | 337000 | |
| 2004-11-20 | 313000 | |
| 2004-11-27 | 335000 | |
| 2004-12-04 | 343000 | |
| 2004-12-11 | 316000 | |
| 2004-12-18 | 322000 | |
| 2004-12-25 | 320000 | |
| 2005-01-01 | 356000 | |
| 2005-01-08 | 369000 | |
| 2005-01-15 | 332000 | |
| 2005-01-22 | 329000 | |
| 2005-01-29 | 331000 | |
| 2005-02-05 | 307000 | |
| 2005-02-12 | 308000 | |
| 2005-02-19 | 318000 | |
| 2005-02-26 | 314000 | |
| 2005-03-05 | 333000 | |
| 2005-03-12 | 324000 | |
| 2005-03-19 | 329000 | |
| 2005-03-26 | 342000 | |
| 2005-04-02 | 335000 | |
| 2005-04-09 | 323000 | |
| 2005-04-16 | 307000 | |
| 2005-04-23 | 317000 | |
| 2005-04-30 | 334000 | |
| 2005-05-07 | 327000 | |
| 2005-05-14 | 321000 | |
| 2005-05-21 | 320000 | |
| 2005-05-28 | 340000 | |
| 2005-06-04 | 338000 | |
| 2005-06-11 | 333000 | |
| 2005-06-18 | 321000 | |
| 2005-06-25 | 311000 | |
| 2005-07-02 | 327000 | |
| 2005-07-09 | 338000 | |
| 2005-07-16 | 323000 | |
| 2005-07-23 | 318000 | |
| 2005-07-30 | 316000 | |
| 2005-08-06 | 311000 | |
| 2005-08-13 | 319000 | |
| 2005-08-20 | 315000 | |
| 2005-08-27 | 318000 | |
| 2005-09-03 | 326000 | |
| 2005-09-10 | 422000 | |
| 2005-09-17 | 424000 | |
| 2005-09-24 | 359000 | |
| 2005-10-01 | 384000 | |
| 2005-10-08 | 383000 | |
| 2005-10-15 | 348000 | |
| 2005-10-22 | 324000 | |
| 2005-10-29 | 322000 | |
| 2005-11-05 | 325000 | |
| 2005-11-12 | 309000 | |
| 2005-11-19 | 324000 | |
| 2005-11-26 | 311000 | |
| 2005-12-03 | 321000 | |
| 2005-12-10 | 327000 | |
| 2005-12-17 | 312000 | |
| 2005-12-24 | 320000 | |
| 2005-12-31 | 302000 | |
| 2006-01-07 | 326000 | |
| 2006-01-14 | 285000 | |
| 2006-01-21 | 290000 | |
| 2006-01-28 | 282000 | |
| 2006-02-04 | 289000 | |
| 2006-02-11 | 298000 | |
| 2006-02-18 | 283000 | |
| 2006-02-25 | 293000 | |
| 2006-03-04 | 302000 | |
| 2006-03-11 | 307000 | |
| 2006-03-18 | 303000 | |
| 2006-03-25 | 295000 | |
| 2006-04-01 | 291000 | |
| 2006-04-08 | 299000 | |
| 2006-04-15 | 299000 | |
| 2006-04-22 | 308000 | |
| 2006-04-29 | 321000 | |
| 2006-05-06 | 347000 | |
| 2006-05-13 | 335000 | |
| 2006-05-20 | 319000 | |
| 2006-05-27 | 330000 | |
| 2006-06-03 | 307000 | |
| 2006-06-10 | 298000 | |
| 2006-06-17 | 308000 | |
| 2006-06-24 | 309000 | |
| 2006-07-01 | 316000 | |
| 2006-07-08 | 343000 | |
| 2006-07-15 | 318000 | |
| 2006-07-22 | 306000 | |
| 2006-07-29 | 311000 | |
| 2006-08-05 | 318000 | |
| 2006-08-12 | 310000 | |
| 2006-08-19 | 315000 | |
| 2006-08-26 | 314000 | |
| 2006-09-02 | 315000 | |
| 2006-09-09 | 314000 | |
| 2006-09-16 | 324000 | |
| 2006-09-23 | 319000 | |
| 2006-09-30 | 309000 | |
| 2006-10-07 | 316000 | |
| 2006-10-14 | 305000 | |
| 2006-10-21 | 313000 | |
| 2006-10-28 | 328000 | |
| 2006-11-04 | 319000 | |
| 2006-11-11 | 311000 | |
| 2006-11-18 | 326000 | |
| 2006-11-25 | 349000 | |
| 2006-12-02 | 327000 | |
| 2006-12-09 | 311000 | |
| 2006-12-16 | 318000 | |
| 2006-12-23 | 323000 | |
| 2006-12-30 | 341000 | |
| 2007-01-06 | 330000 | |
| 2007-01-13 | 296000 | |
| 2007-01-20 | 335000 | |
| 2007-01-27 | 308000 | |
| 2007-02-03 | 310000 | |
| 2007-02-10 | 338000 | |
| 2007-02-17 | 321000 | |
| 2007-02-24 | 322000 | |
| 2007-03-03 | 320000 | |
| 2007-03-10 | 308000 | |
| 2007-03-17 | 309000 | |
| 2007-03-24 | 303000 | |
| 2007-03-31 | 307000 | |
| 2007-04-07 | 332000 | |
| 2007-04-14 | 327000 | |
| 2007-04-21 | 321000 | |
| 2007-04-28 | 301000 | |
| 2007-05-05 | 300000 | |
| 2007-05-12 | 297000 | |
| 2007-05-19 | 310000 | |
| 2007-05-26 | 310000 | |
| 2007-06-02 | 313000 | |
| 2007-06-09 | 313000 | |
| 2007-06-16 | 320000 | |
| 2007-06-23 | 313000 | |
| 2007-06-30 | 317000 | |
| 2007-07-07 | 321000 | |
| 2007-07-14 | 317000 | |
| 2007-07-21 | 310000 | |
| 2007-07-28 | 305000 | |
| 2007-08-04 | 314000 | |
| 2007-08-11 | 316000 | |
| 2007-08-18 | 321000 | |
| 2007-08-25 | 329000 | |
| 2007-09-01 | 314000 | |
| 2007-09-08 | 321000 | |
| 2007-09-15 | 313000 | |
| 2007-09-22 | 302000 | |
| 2007-09-29 | 317000 | |
| 2007-10-06 | 316000 | |
| 2007-10-13 | 335000 | |
| 2007-10-20 | 334000 | |
| 2007-10-27 | 328000 | |
| 2007-11-03 | 327000 | |
| 2007-11-10 | 333000 | |
| 2007-11-17 | 332000 | |
| 2007-11-24 | 352000 | |
| 2007-12-01 | 344000 | |
| 2007-12-08 | 332000 | |
| 2007-12-15 | 350000 | |
| 2007-12-22 | 355000 | |
| 2007-12-29 | 360000 | |
| 2008-01-05 | 346000 | |
| 2008-01-12 | 322000 | |
| 2008-01-19 | 321000 | |
| 2008-01-26 | 366000 | |
| 2008-02-02 | 350000 | |
| 2008-02-09 | 344000 | |
| 2008-02-16 | 339000 | |
| 2008-02-23 | 354000 | |
| 2008-03-01 | 345000 | |
| 2008-03-08 | 348000 | |
| 2008-03-15 | 369000 | |
| 2008-03-22 | 368000 | |
| 2008-03-29 | 387000 | |
| 2008-04-05 | 354000 | |
| 2008-04-12 | 365000 | |
| 2008-04-19 | 349000 | |
| 2008-04-26 | 370000 | |
| 2008-05-03 | 370000 | |
| 2008-05-10 | 366000 | |
| 2008-05-17 | 367000 | |
| 2008-05-24 | 369000 | |
| 2008-05-31 | 362000 | |
| 2008-06-07 | 382000 | |
| 2008-06-14 | 378000 | |
| 2008-06-21 | 381000 | |
| 2008-06-28 | 392000 | |
| 2008-07-05 | 371000 | |
| 2008-07-12 | 385000 | |
| 2008-07-19 | 402000 | |
| 2008-07-26 | 434000 | |
| 2008-08-02 | 448000 | |
| 2008-08-09 | 430000 | |
| 2008-08-16 | 424000 | |
| 2008-08-23 | 421000 | |
| 2008-08-30 | 442000 | |
| 2008-09-06 | 441000 | |
| 2008-09-13 | 449000 | |
| 2008-09-20 | 483000 | |
| 2008-09-27 | 483000 | |
| 2008-10-04 | 482000 | |
| 2008-10-11 | 461000 | |
| 2008-10-18 | 478000 | |
| 2008-10-25 | 480000 | |
| 2008-11-01 | 490000 | |
| 2008-11-08 | 512000 | |
| 2008-11-15 | 536000 | |
| 2008-11-22 | 532000 | |
| 2008-11-29 | 529000 | |
| 2008-12-06 | 570000 | |
| 2008-12-13 | 566000 | |
| 2008-12-20 | 587000 | |
| 2008-12-27 | 533000 | |
| 2009-01-03 | 503000 | |
| 2009-01-10 | 551000 | |
| 2009-01-17 | 591000 | |
| 2009-01-24 | 586000 | |
| 2009-01-31 | 629000 | |
| 2009-02-07 | 637000 | |
| 2009-02-14 | 632000 | |
| 2009-02-21 | 655000 | |
| 2009-02-28 | 652000 | |
| 2009-03-07 | 660000 | |
| 2009-03-14 | 651000 | |
| 2009-03-21 | 661000 | |
| 2009-03-28 | 665000 | |
| 2009-04-04 | 653000 | |
| 2009-04-11 | 599000 | |
| 2009-04-18 | 639000 | |
| 2009-04-25 | 620000 | |
| 2009-05-02 | 602000 | |
| 2009-05-09 | 625000 | |
| 2009-05-16 | 620000 | |
| 2009-05-23 | 606000 | |
| 2009-05-30 | 607000 | |
| 2009-06-06 | 596000 | |
| 2009-06-13 | 595000 | |
| 2009-06-20 | 608000 | |
| 2009-06-27 | 594000 | |
| 2009-07-04 | 573000 | |
| 2009-07-11 | 546000 | |
| 2009-07-18 | 560000 | |
| 2009-07-25 | 587000 | |
| 2009-08-01 | 555000 | |
| 2009-08-08 | 555000 | |
| 2009-08-15 | 562000 | |
| 2009-08-22 | 560000 | |
| 2009-08-29 | 564000 | |
| 2009-09-05 | 558000 | |
| 2009-09-12 | 542000 | |
| 2009-09-19 | 536000 | |
| 2009-09-26 | 554000 | |
| 2009-10-03 | 533000 | |
| 2009-10-10 | 511000 | |
| 2009-10-17 | 531000 | |
| 2009-10-24 | 530000 | |
| 2009-10-31 | 522000 | |
| 2009-11-07 | 512000 | |
| 2009-11-14 | 507000 | |
| 2009-11-21 | 482000 | |
| 2009-11-28 | 475000 | |
| 2009-12-05 | 497000 | |
| 2009-12-12 | 498000 | |
| 2009-12-19 | 479000 | |
| 2009-12-26 | 468000 | |
| 2010-01-02 | 456000 | |
| 2010-01-09 | 469000 | |
| 2010-01-16 | 507000 | |
| 2010-01-23 | 471000 | |
| 2010-01-30 | 496000 | |
| 2010-02-06 | 466000 | |
| 2010-02-13 | 489000 | |
| 2010-02-20 | 500000 | |
| 2010-02-27 | 488000 | |
| 2010-03-06 | 472000 | |
| 2010-03-13 | 478000 | |
| 2010-03-20 | 472000 | |
| 2010-03-27 | 459000 | |
| 2010-04-03 | 479000 | |
| 2010-04-10 | 479000 | |
| 2010-04-17 | 469000 | |
| 2010-04-24 | 449000 | |
| 2010-05-01 | 451000 | |
| 2010-05-08 | 451000 | |
| 2010-05-15 | 474000 | |
| 2010-05-22 | 463000 | |
| 2010-05-29 | 458000 | |
| 2010-06-05 | 459000 | |
| 2010-06-12 | 467000 | |
| 2010-06-19 | 452000 | |
| 2010-06-26 | 464000 | |
| 2010-07-03 | 454000 | |
| 2010-07-10 | 439000 | |
| 2010-07-17 | 462000 | |
| 2010-07-24 | 465000 | |
| 2010-07-31 | 476000 | |
| 2010-08-07 | 483000 | |
| 2010-08-14 | 486000 | |
| 2010-08-21 | 464000 | |
| 2010-08-28 | 467000 | |
| 2010-09-04 | 452000 | |
| 2010-09-11 | 444000 | |
| 2010-09-18 | 459000 | |
| 2010-09-25 | 459000 | |
| 2010-10-02 | 446000 | |
| 2010-10-09 | 459000 | |
| 2010-10-16 | 444000 | |
| 2010-10-23 | 432000 | |
| 2010-10-30 | 453000 | |
| 2010-11-06 | 434000 | |
| 2010-11-13 | 432000 | |
| 2010-11-20 | 407000 | |
| 2010-11-27 | 432000 | |
| 2010-12-04 | 428000 | |
| 2010-12-11 | 425000 | |
| 2010-12-18 | 424000 | |
| 2010-12-25 | 404000 | |
| 2011-01-01 | 413000 | |
| 2011-01-08 | 434000 | |
| 2011-01-15 | 421000 | |
| 2011-01-22 | 446000 | |
| 2011-01-29 | 420000 | |
| 2011-02-05 | 402000 | |
| 2011-02-12 | 425000 | |
| 2011-02-19 | 394000 | |
| 2011-02-26 | 385000 | |
| 2011-03-05 | 414000 | |
| 2011-03-12 | 404000 | |
| 2011-03-19 | 407000 | |
| 2011-03-26 | 399000 | |
| 2011-04-02 | 395000 | |
| 2011-04-09 | 416000 | |
| 2011-04-16 | 402000 | |
| 2011-04-23 | 422000 | |
| 2011-04-30 | 468000 | |
| 2011-05-07 | 435000 | |
| 2011-05-14 | 414000 | |
| 2011-05-21 | 423000 | |
| 2011-05-28 | 418000 | |
| 2011-06-04 | 423000 | |
| 2011-06-11 | 413000 | |
| 2011-06-18 | 416000 | |
| 2011-06-25 | 421000 | |
| 2011-07-02 | 418000 | |
| 2011-07-09 | 408000 | |
| 2011-07-16 | 420000 | |
| 2011-07-23 | 411000 | |
| 2011-07-30 | 406000 | |
| 2011-08-06 | 405000 | |
| 2011-08-13 | 409000 | |
| 2011-08-20 | 415000 | |
| 2011-08-27 | 409000 | |
| 2011-09-03 | 414000 | |
| 2011-09-10 | 429000 | |
| 2011-09-17 | 422000 | |
| 2011-09-24 | 406000 | |
| 2011-10-01 | 405000 | |
| 2011-10-08 | 410000 | |
| 2011-10-15 | 395000 | |
| 2011-10-22 | 403000 | |
| 2011-10-29 | 399000 | |
| 2011-11-05 | 392000 | |
| 2011-11-12 | 383000 | |
| 2011-11-19 | 385000 | |
| 2011-11-26 | 397000 | |
| 2011-12-03 | 387000 | |
| 2011-12-10 | 368000 | |
| 2011-12-17 | 368000 | |
| 2011-12-24 | 386000 | |
| 2011-12-31 | 376000 | |
| 2012-01-07 | 391000 | |
| 2012-01-14 | 367000 | |
| 2012-01-21 | 381000 | |
| 2012-01-28 | 372000 | |
| 2012-02-04 | 368000 | |
| 2012-02-11 | 361000 | |
| 2012-02-18 | 359000 | |
| 2012-02-25 | 365000 | |
| 2012-03-03 | 375000 | |
| 2012-03-10 | 369000 | |
| 2012-03-17 | 368000 | |
| 2012-03-24 | 363000 | |
| 2012-03-31 | 358000 | |
| 2012-04-07 | 387000 | |
| 2012-04-14 | 381000 | |
| 2012-04-21 | 387000 | |
| 2012-04-28 | 372000 | |
| 2012-05-05 | 373000 | |
| 2012-05-12 | 369000 | |
| 2012-05-19 | 371000 | |
| 2012-05-26 | 381000 | |
| 2012-06-02 | 377000 | |
| 2012-06-09 | 383000 | |
| 2012-06-16 | 384000 | |
| 2012-06-23 | 380000 | |
| 2012-06-30 | 372000 | |
| 2012-07-07 | 360000 | |
| 2012-07-14 | 390000 | |
| 2012-07-21 | 368000 | |
| 2012-07-28 | 372000 | |
| 2012-08-04 | 371000 | |
| 2012-08-11 | 369000 | |
| 2012-08-18 | 376000 | |
| 2012-08-25 | 377000 | |
| 2012-09-01 | 371000 | |
| 2012-09-08 | 393000 | |
| 2012-09-15 | 392000 | |
| 2012-09-22 | 377000 | |
| 2012-09-29 | 376000 | |
| 2012-10-06 | 350000 | |
| 2012-10-13 | 386000 | |
| 2012-10-20 | 374000 | |
| 2012-10-27 | 364000 | |
| 2012-11-03 | 365000 | |
| 2012-11-10 | 446000 | |
| 2012-11-17 | 406000 | |
| 2012-11-24 | 388000 | |
| 2012-12-01 | 375000 | |
| 2012-12-08 | 340000 | |
| 2012-12-15 | 356000 | |
| 2012-12-22 | 362000 | |
| 2012-12-29 | 362000 | |
| 2013-01-05 | 363000 | |
| 2013-01-12 | 344000 | |
| 2013-01-19 | 339000 | |
| 2013-01-26 | 366000 | |
| 2013-02-02 | 361000 | |
| 2013-02-09 | 347000 | |
| 2013-02-16 | 362000 | |
| 2013-02-23 | 342000 | |
| 2013-03-02 | 340000 | |
| 2013-03-09 | 343000 | |
| 2013-03-16 | 343000 | |
| 2013-03-23 | 358000 | |
| 2013-03-30 | 375000 | |
| 2013-04-06 | 359000 | |
| 2013-04-13 | 356000 | |
| 2013-04-20 | 343000 | |
| 2013-04-27 | 331000 | |
| 2013-05-04 | 335000 | |
| 2013-05-11 | 360000 | |
| 2013-05-18 | 343000 | |
| 2013-05-25 | 353000 | |
| 2013-06-01 | 346000 | |
| 2013-06-08 | 337000 | |
| 2013-06-15 | 353000 | |
| 2013-06-22 | 347000 | |
| 2013-06-29 | 340000 | |
| 2013-07-06 | 351000 | |
| 2013-07-13 | 344000 | |
| 2013-07-20 | 355000 | |
| 2013-07-27 | 334000 | |
| 2013-08-03 | 339000 | |
| 2013-08-10 | 327000 | |
| 2013-08-17 | 340000 | |
| 2013-08-24 | 336000 | |
| 2013-08-31 | 325000 | |
| 2013-09-07 | 300000 | |
| 2013-09-14 | 323000 | |
| 2013-09-21 | 314000 | |
| 2013-09-28 | 319000 | |
| 2013-10-05 | 368000 | |
| 2013-10-12 | 368000 | |
| 2013-10-19 | 351000 | |
| 2013-10-26 | 347000 | |
| 2013-11-02 | 342000 | |
| 2013-11-09 | 340000 | |
| 2013-11-16 | 331000 | |
| 2013-11-23 | 316000 | |
| 2013-11-30 | 312000 | |
| 2013-12-07 | 354000 | |
| 2013-12-14 | 364000 | |
| 2013-12-21 | 334000 | |
| 2013-12-28 | 332000 | |
| 2014-01-04 | 322000 | |
| 2014-01-11 | 318000 | |
| 2014-01-18 | 327000 | |
| 2014-01-25 | 340000 | |
| 2014-02-01 | 331000 | |
| 2014-02-08 | 337000 | |
| 2014-02-15 | 332000 | |
| 2014-02-22 | 341000 | |
| 2014-03-01 | 319000 | |
| 2014-03-08 | 322000 | |
| 2014-03-15 | 321000 | |
| 2014-03-22 | 313000 | |
| 2014-03-29 | 330000 | |
| 2014-04-05 | 311000 | |
| 2014-04-12 | 308000 | |
| 2014-04-19 | 327000 | |
| 2014-04-26 | 345000 | |
| 2014-05-03 | 325000 | |
| 2014-05-10 | 303000 | |
| 2014-05-17 | 324000 | |
| 2014-05-24 | 305000 | |
| 2014-05-31 | 312000 | |
| 2014-06-07 | 317000 | |
| 2014-06-14 | 314000 | |
| 2014-06-21 | 315000 | |
| 2014-06-28 | 308000 | |
| 2014-07-05 | 302000 | |
| 2014-07-12 | 308000 | |
| 2014-07-19 | 294000 | |
| 2014-07-26 | 303000 | |
| 2014-08-02 | 295000 | |
| 2014-08-09 | 309000 | |
| 2014-08-16 | 303000 | |
| 2014-08-23 | 300000 | |
| 2014-08-30 | 303000 | |
| 2014-09-06 | 307000 | |
| 2014-09-13 | 288000 | |
| 2014-09-20 | 295000 | |
| 2014-09-27 | 290000 | |
| 2014-10-04 | 293000 | |
| 2014-10-11 | 281000 | |
| 2014-10-18 | 290000 | |
| 2014-10-25 | 291000 | |
| 2014-11-01 | 280000 | |
| 2014-11-08 | 291000 | |
| 2014-11-15 | 293000 | |
| 2014-11-22 | 303000 | |
| 2014-11-29 | 291000 | |
| 2014-12-06 | 291000 | |
| 2014-12-13 | 286000 | |
| 2014-12-20 | 276000 | |
| 2014-12-27 | 285000 | |
| 2015-01-03 | 294000 | |
| 2015-01-10 | 304000 | |
| 2015-01-17 | 298000 | |
| 2015-01-24 | 261000 | |
| 2015-01-31 | 281000 | |
| 2015-02-07 | 298000 | |
| 2015-02-14 | 285000 | |
| 2015-02-21 | 305000 | |
| 2015-02-28 | 317000 | |
| 2015-03-07 | 293000 | |
| 2015-03-14 | 290000 | |
| 2015-03-21 | 284000 | |
| 2015-03-28 | 269000 | |
| 2015-04-04 | 282000 | |
| 2015-04-11 | 298000 | |
| 2015-04-18 | 295000 | |
| 2015-04-25 | 269000 | |
| 2015-05-02 | 267000 | |
| 2015-05-09 | 271000 | |
| 2015-05-16 | 276000 | |
| 2015-05-23 | 281000 | |
| 2015-05-30 | 275000 | |
| 2015-06-06 | 278000 | |
| 2015-06-13 | 269000 | |
| 2015-06-20 | 273000 | |
| 2015-06-27 | 275000 | |
| 2015-07-04 | 292000 | |
| 2015-07-11 | 285000 | |
| 2015-07-18 | 265000 | |
| 2015-07-25 | 269000 | |
| 2015-08-01 | 270000 | |
| 2015-08-08 | 274000 | |
| 2015-08-15 | 279000 | |
| 2015-08-22 | 274000 | |
| 2015-08-29 | 279000 | |
| 2015-09-05 | 273000 | |
| 2015-09-12 | 264000 | |
| 2015-09-19 | 269000 | |
| 2015-09-26 | 272000 | |
| 2015-10-03 | 267000 | |
| 2015-10-10 | 265000 | |
| 2015-10-17 | 264000 | |
| 2015-10-24 | 264000 | |
| 2015-10-31 | 275000 | |
| 2015-11-07 | 276000 | |
| 2015-11-14 | 272000 | |
| 2015-11-21 | 261000 | |
| 2015-11-28 | 265000 | |
| 2015-12-05 | 280000 | |
| 2015-12-12 | 268000 | |
| 2015-12-19 | 260000 | |
| 2015-12-26 | 276000 | |
| 2016-01-02 | 273000 | |
| 2016-01-09 | 284000 | |
| 2016-01-16 | 290000 | |
| 2016-01-23 | 269000 | |
| 2016-01-30 | 281000 | |
| 2016-02-06 | 265000 | |
| 2016-02-13 | 263000 | |
| 2016-02-20 | 272000 | |
| 2016-02-27 | 269000 | |
| 2016-03-05 | 257000 | |
| 2016-03-12 | 263000 | |
| 2016-03-19 | 264000 | |
| 2016-03-26 | 273000 | |
| 2016-04-02 | 272000 | |
| 2016-04-09 | 263000 | |
| 2016-04-16 | 255000 | |
| 2016-04-23 | 259000 | |
| 2016-04-30 | 277000 | |
| 2016-05-07 | 290000 | |
| 2016-05-14 | 279000 | |
| 2016-05-21 | 268000 | |
| 2016-05-28 | 264000 | |
| 2016-06-04 | 265000 | |
| 2016-06-11 | 273000 | |
| 2016-06-18 | 261000 | |
| 2016-06-25 | 262000 | |
| 2016-07-02 | 256000 | |
| 2016-07-09 | 257000 | |
| 2016-07-16 | 260000 | |
| 2016-07-23 | 264000 | |
| 2016-07-30 | 266000 | |
| 2016-08-06 | 266000 | |
| 2016-08-13 | 265000 | |
| 2016-08-20 | 265000 | |
| 2016-08-27 | 262000 | |
| 2016-09-03 | 257000 | |
| 2016-09-10 | 253000 | |
| 2016-09-17 | 252000 | |
| 2016-09-24 | 247000 | |
| 2016-10-01 | 246000 | |
| 2016-10-08 | 251000 | |
| 2016-10-15 | 264000 | |
| 2016-10-22 | 257000 | |
| 2016-10-29 | 265000 | |
| 2016-11-05 | 251000 | |
| 2016-11-12 | 232000 | |
| 2016-11-19 | 248000 | |
| 2016-11-26 | 260000 | |
| 2016-12-03 | 252000 | |
| 2016-12-10 | 251000 | |
| 2016-12-17 | 262000 | |
| 2016-12-24 | 254000 | |
| 2016-12-31 | 236000 | |
| 2017-01-07 | 244000 | |
| 2017-01-14 | 246000 | |
| 2017-01-21 | 256000 | |
| 2017-01-28 | 241000 | |
| 2017-02-04 | 236000 | |
| 2017-02-11 | 242000 | |
| 2017-02-18 | 247000 | |
| 2017-02-25 | 232000 | |
| 2017-03-04 | 246000 | |
| 2017-03-11 | 244000 | |
| 2017-03-18 | 255000 | |
| 2017-03-25 | 256000 | |
| 2017-04-01 | 236000 | |
| 2017-04-08 | 237000 | |
| 2017-04-15 | 244000 | |
| 2017-04-22 | 251000 | |
| 2017-04-29 | 241000 | |
| 2017-05-06 | 237000 | |
| 2017-05-13 | 237000 | |
| 2017-05-20 | 234000 | |
| 2017-05-27 | 251000 | |
| 2017-06-03 | 244000 | |
| 2017-06-10 | 238000 | |
| 2017-06-17 | 243000 | |
| 2017-06-24 | 237000 | |
| 2017-07-01 | 248000 | |
| 2017-07-08 | 248000 | |
| 2017-07-15 | 241000 | |
| 2017-07-22 | 245000 | |
| 2017-07-29 | 242000 | |
| 2017-08-05 | 246000 | |
| 2017-08-12 | 236000 | |
| 2017-08-19 | 241000 | |
| 2017-08-26 | 239000 | |
| 2017-09-02 | 299000 | |
| 2017-09-09 | 275000 | |
| 2017-09-16 | 260000 | |
| 2017-09-23 | 262000 | |
| 2017-09-30 | 255000 | |
| 2017-10-07 | 246000 | |
| 2017-10-14 | 232000 | |
| 2017-10-21 | 236000 | |
| 2017-10-28 | 235000 | |
| 2017-11-04 | 240000 | |
| 2017-11-11 | 246000 | |
| 2017-11-18 | 238000 | |
| 2017-11-25 | 237000 | |
| 2017-12-02 | 235000 | |
| 2017-12-09 | 226000 | |
| 2017-12-16 | 242000 | |
| 2017-12-23 | 242000 | |
| 2017-12-30 | 243000 | |
| 2018-01-06 | 251000 | |
| 2018-01-13 | 229000 | |
| 2018-01-20 | 237000 | |
| 2018-01-27 | 221000 | |
| 2018-02-03 | 221000 | |
| 2018-02-10 | 224000 | |
| 2018-02-17 | 220000 | |
| 2018-02-24 | 215000 | |
| 2018-03-03 | 226000 | |
| 2018-03-10 | 223000 | |
| 2018-03-17 | 224000 | |
| 2018-03-24 | 220000 | |
| 2018-03-31 | 237000 | |
| 2018-04-07 | 234000 | |
| 2018-04-14 | 235000 | |
| 2018-04-21 | 207000 | |
| 2018-04-28 | 212000 | |
| 2018-05-05 | 210000 | |
| 2018-05-12 | 224000 | |
| 2018-05-19 | 230000 | |
| 2018-05-26 | 221000 | |
| 2018-06-02 | 221000 | |
| 2018-06-09 | 218000 | |
| 2018-06-16 | 220000 | |
| 2018-06-23 | 220000 | |
| 2018-06-30 | 228000 | |
| 2018-07-07 | 215000 | |
| 2018-07-14 | 212000 | |
| 2018-07-21 | 220000 | |
| 2018-07-28 | 218000 | |
| 2018-08-04 | 218000 | |
| 2018-08-11 | 213000 | |
| 2018-08-18 | 216000 | |
| 2018-08-25 | 214000 | |
| 2018-09-01 | 210000 | |
| 2018-09-08 | 211000 | |
| 2018-09-15 | 213000 | |
| 2018-09-22 | 212000 | |
| 2018-09-29 | 217000 | |
| 2018-10-06 | 213000 | |
| 2018-10-13 | 213000 | |
| 2018-10-20 | 219000 | |
| 2018-10-27 | 217000 | |
| 2018-11-03 | 217000 | |
| 2018-11-10 | 218000 | |
| 2018-11-17 | 222000 | |
| 2018-11-24 | 232000 | |
| 2018-12-01 | 232000 | |
| 2018-12-08 | 203000 | |
| 2018-12-15 | 216000 | |
| 2018-12-22 | 219000 | |
| 2018-12-29 | 228000 | |
| 2019-01-05 | 220000 | |
| 2019-01-12 | 216000 | |
| 2019-01-19 | 209000 | |
| 2019-01-26 | 236000 | |
| 2019-02-02 | 230000 | |
| 2019-02-09 | 228000 | |
| 2019-02-16 | 218000 | |
| 2019-02-23 | 224000 | |
| 2019-03-02 | 220000 | |
| 2019-03-09 | 224000 | |
| 2019-03-16 | 219000 | |
| 2019-03-23 | 215000 | |
| 2019-03-30 | 211000 | |
| 2019-04-06 | 203000 | |
| 2019-04-13 | 203000 | |
| 2019-04-20 | 226000 | |
| 2019-04-27 | 230000 | |
| 2019-05-04 | 225000 | |
| 2019-05-11 | 217000 | |
| 2019-05-18 | 213000 | |
| 2019-05-25 | 218000 | |
| 2019-06-01 | 220000 | |
| 2019-06-08 | 220000 | |
| 2019-06-15 | 219000 | |
| 2019-06-22 | 224000 | |
| 2019-06-29 | 222000 | |
| 2019-07-06 | 211000 | |
| 2019-07-13 | 217000 | |
| 2019-07-20 | 211000 | |
| 2019-07-27 | 216000 | |
| 2019-08-03 | 214000 | |
| 2019-08-10 | 218000 | |
| 2019-08-17 | 215000 | |
| 2019-08-24 | 215000 | |
| 2019-08-31 | 219000 | |
| 2019-09-07 | 208000 | |
| 2019-09-14 | 211000 | |
| 2019-09-21 | 215000 | |
| 2019-09-28 | 218000 | |
| 2019-10-05 | 212000 | |
| 2019-10-12 | 218000 | |
| 2019-10-19 | 213000 | |
| 2019-10-26 | 217000 | |
| 2019-11-02 | 212000 | |
| 2019-11-09 | 222000 | |
| 2019-11-16 | 223000 | |
| 2019-11-23 | 211000 | |
| 2019-11-30 | 206000 | |
| 2019-12-07 | 237000 | |
| 2019-12-14 | 229000 | |
| 2019-12-21 | 218000 | |
| 2019-12-28 | 220000 | |
| 2020-01-04 | 212000 | |
| 2020-01-11 | 207000 | |
| 2020-01-18 | 220000 | |
| 2020-01-25 | 212000 | |
| 2020-02-01 | 201000 | |
| 2020-02-08 | 204000 | |
| 2020-02-15 | 215000 | |
| 2020-02-22 | 220000 | |
| 2020-02-29 | 217000 | |
| 2020-03-07 | 211000 | |
| 2020-03-14 | 281000 | 281000 |
| 2020-03-21 | 3,394,000 |
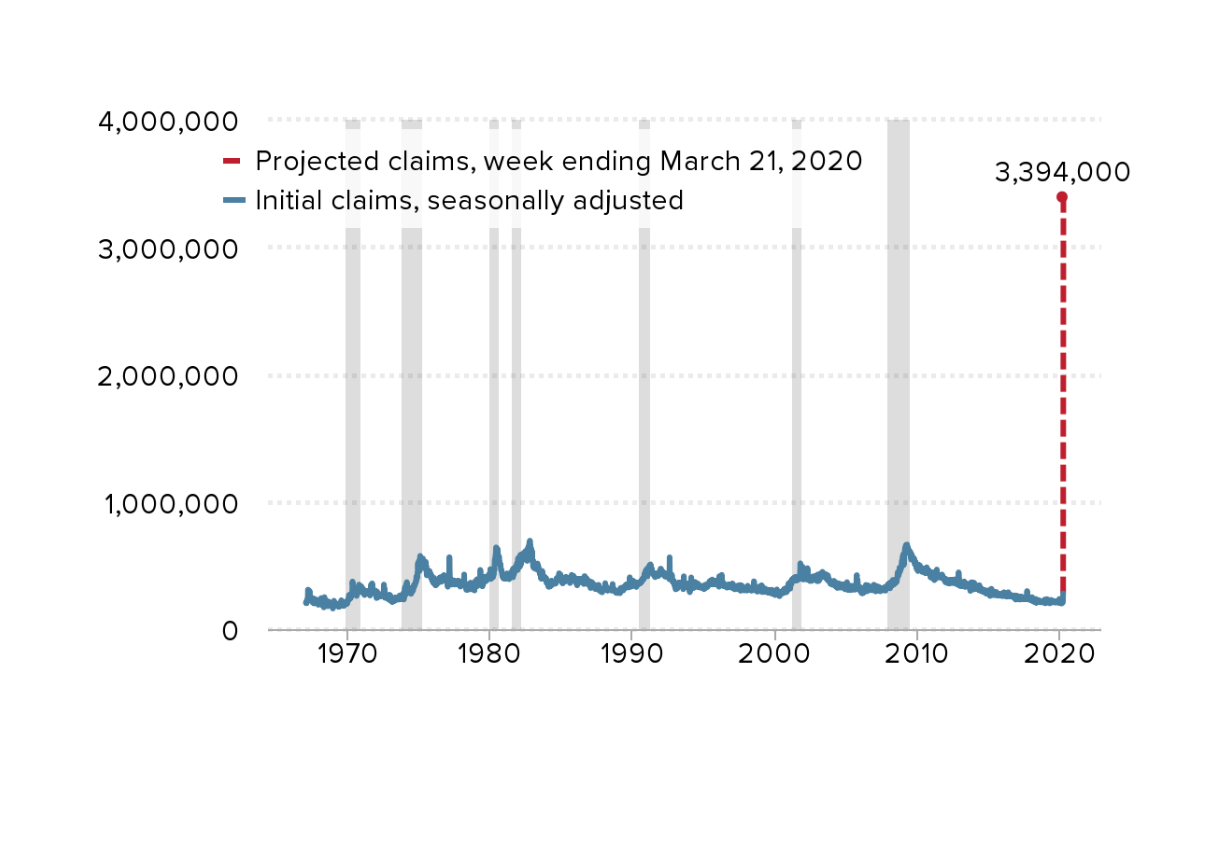
Note: Projection for the week ending March 21, 2020, is based on authors’ analysis of news reports from March 15 to March 21, 2020, regarding unemployment claims in 35 states and D.C., extrapolated to all 50 states. Shaded areas denote recessions.
Source: U.S. Employment and Training Administration, Initial Claims [ICSA], retrieved from FRED, Federal Reserve Bank of St. Louis; https://fred.stlouisfed.org/series/ICSA, March 23, 2020
For scale, consider that 3.4 million Americans moving from employment to unemployment would raise the number of the unemployed from 5.7 million to 9.1 million. This alone would raise the unemployment rate by more than half, by 2 percentage points from 3.5% to 5.5%, moving back to 2015 levels in just one week. This spike represents 2.2% of all jobs in the economy. The largest monthly rise in the unemployment rate in American history was plus 1.3 percentage points in October 1949.
To arrive at our estimate of 3.4 million newly unemployed workers over the last week, we collected news reports from March 15 to March 21 and applied a simple extrapolation to fill in estimates for those days and those states that were missing reports.
Many state UI agencies reported partial information to the press over the course of the week. We gathered and harmonized the reported numbers to calculate an estimated full-week initial claims statistic for as many states as possible; we were able to do so for 35 states and the District of Columbia (see Table 1). This required extrapolating to a weekly number based on a few days of reported information, paying attention to the number of weekdays and weekend days included in each public report. These 35 states and the District of Columbia accounted for 78% of national claims over the prior four weeks. This implies a state growth rate relative to its average weekly initial claims over the prior four weeks among these states.
State unemployment insurance initial claims predictions for week ending March 21 based on news reports, for 35 states and D.C.
| State | Projected claims |
|---|---|
| Alaska | 5,000 |
| Alabama | 11,000 |
| California | 639,000 |
| Colorado | 43,000 |
| Connecticut | 60,000 |
| District of Columbia | 14,000 |
| Delaware | 18,000 |
| Georgia | 20,000 |
| Hawaii | 12,000 |
| Iowa | 67,000 |
| Illinois | 121,000 |
| Indiana | 43,000 |
| Kansas | 12,000 |
| Kentucky | 17,000 |
| Louisiana | 35,000 |
| Massachusetts | 108,000 |
| Maryland | 31,000 |
| Maine | 12,000 |
| Minnesota | 108,000 |
| Michigan | 123,000 |
| Montana | 13,000 |
| North Carolina | 94,000 |
| New Hampshire | 27,000 |
| New Jersey | 85,000 |
| New Mexico | 14,000 |
| Ohio | 149,000 |
| Oklahoma | 11,000 |
| Oregon | 94,000 |
| Pennsylvania | 354,000 |
| Rhode Island | 42,000 |
| South Carolina | 17,000 |
| Tennessee | 5,000 |
| Texas | 116,000 |
| Virginia | 43,000 |
| Wisconsin | 67,000 |
| West Virginia | 5,000 |
| Total for 35 states and D.C. | 2,630,000 |
| Extrapolated total for all 50 states and D.C. | 3,394,000 |
Note: The 35 states plus D.C. listed above accounted for 77.5% of unemployment claims in the four weeks prior to the week ending March 21, 2020. Therefore, we assume that 2,630,000 represents 77.5% of the total claims for all 50 states and D.C. in the week ending March 21, 2020, so the total estimated claims (rounded to the nearest thousand) are 2,630,000/0.775 ≈ 3,394,000.
Sources: Sources for each state’s projected claims can be found in column C of this spreadsheet.
For the 15 states lacking any public reports, we assume they have the same average growth rate as among states with report-based estimates. If growth rates were, in fact, lower in the states that did not report, our estimate would overstate the size of claims. We make two additional assumptions. First, that the ratio of average claims on weekdays to weekend days is 3. Changing this shifts predictions by only a few hundred thousand. Second, that the rate of claims growth is constant throughout the week. This a conservative assumption because many of the news reports are concentrated early in the week. In states with rising claims over the week, our assumption would lead to an underestimate of weekly claims. An enriched model, which harnesses state-level changes in Google Trends search interest in “file for unemployment” to predict the missing states’ estimates, produces similar top-line results. States with and without news-report-based estimates have similar average changes in Google Trends, providing some evidence that claims growth rates may be similar in the 15 states with news-report-based estimates as the 36 with them.
The number of new unemployment insurance claims is a narrow measure of unemployment and underemployment. Not everyone who is unemployed can claim benefits, and many states’ UI offices were overwhelmed by the surge in demand this past week, so not all claims could be accepted. The true impacts are undoubtedly of larger scale than described here. Further, unemployment insurance benefits replace less than half of families’ usual income.
States require federal support as their budgets get hammered by rising costs and falling revenues. Only the federal government can borrow at a large enough scale to match the scale of the problem. These changes are necessary to save lives threatened by COVID-19, given our failure to limit the novel coronavirus spread through means other than broad, indiscriminate quarantine. American working families are paying a large price through no fault of their own. But there is no shortcutting public health to get the American economy back to work. A healthy economy requires public health.
The coronavirus economic policy response must include relief and redistribution now and major demand stimulus once the crisis passes
Key takeaways
Sen. Mitch McConnell’s bill would make the U.S. economic response as far behind as the public health response, relative to international best practice.
An economic relief package must include:
- Maximization of the income that can be delivered through existing social insurance and safety net programs during the lockdown and its aftermath
- Substantial aid to state and local governments
- Bailouts of industries’ workers, not shareholders, creditors, or senior management
- Direct cash payments to households
- Conditions-based triggers that keep aid flowing
The U.S. economy will contract enormously in the coming months. Economic activity will fall more sharply than in perhaps any other period in modern history, and tens of millions of U.S. employees will be forced to stop working. Unlike previous economic shocks, we want this contraction to happen—it is a byproduct of the necessary public health response to the coronavirus.
But even as major parts of the economy shut down completely, people will need resources to live, resources they generally get by working. The United States is a rich enough country to provide these, even in the face of a prolonged economic shutdown. We even have obvious policy levers that can transfer huge amounts of resources to those out of work through no fault of their own: the existing social insurance and safety net programs that have been built exactly for this purpose—if not necessarily envisioned to work on this scale.
These existing social insurance and safety net programs can be supplemented with ad hoc emergency measures to support the vast majority of U.S. families through the social distancing measures of the epidemic. These same measures can also ensure that families emerge from the lockdown with finances largely intact. When the all-clear is sounded, a major fiscal stimulus to boost demand should be ready to rev up the economy as fast as possible. The quicker that firms feel pressure to supply goods and services to customers, the more likely they will be to reestablish the employment relationships they had with workers before the crisis hit, and the less economic scarring will occur.
Fixing unemployment insurance and the coronavirus response
The novel coronavirus has brought sudden attention to the unemployment insurance (UI) system and its ability to quickly deliver aid to families and stimulus to the economy. Economists estimate that we will lose nearly 14 million jobs by the summer even with a sizable stimulus package. Workers in industries heavily dependent on women and workers of color, like food service and retail, have borne the brunt of the pandemic. Policymakers must focus both on immediate changes to help these individuals, and structural fixes that can gird the nation for the challenges of a recession and future economic crises.
This fact sheet is a joint project of the Women’s Law Center, the National Employment Law Project, the Economic Policy Institute, the Century Foundation, and the Georgetown Law Center on Poverty and Inequality Economic Security and Opportunity Initiative. View the fact sheet
The UI System Is in Desperate Need of Repair
The basic UI program, operated by the states with federal oversight; the federal-state Extended Benefits (EB) program; and the Disaster Unemployment Assistance (DUA) program are facing this crisis at one of their weakest points in history.
- Access to UI Is Already Extremely Limited: The percentage of all jobless workers receiving a UI payment has dropped from 43.7 percent in 2001 to just 27.8 percent in 2018, with low-wage workers the least likely to receive benefits.
- UI Programs Have Been Inadequately Funded for Decades: During the last recession, 36 state unemployment trust funds went broke, and despite the longest economic expansion in U.S. history, 22 entered the COVID-19 crisis with insufficient savings. Without aid many trust funds will go broke again.
- UI Benefits Are Meager: The average benefit of $382 per week only represents 32.7 percent of the average wage.
- UI Administration Has Been Dramatically Under-Resourced: The federal grants for state operations have been cut by 30 percent since the 1980s, leaving states with threadbare staff and antiquated computer systems overwhelmed by COVID-19. The additional $1 billion appropriated by Congress won’t meet the need.
- Disaster Unemployment Assistance (DUA) is ill equipped to handle this or other crises given its low benefit amounts, unrealistic time limits, and limited coverage.
Ongoing Federal Reforms Represent a Timely Down Payment on Overdue Structural Change
The Families First Coronavirus Act and the stimulus package being negotiated go a long way toward addressing the challenges facing unemployed workers during this current crisis.
- The Families First Coronavirus Act delivered $1 billion in aid to states to process the spike in claims, and granted states more flexibility to approve unemployment claims due to the unique circumstances of the COVID-19, such as quarantines and stay-at-home orders. It also provided full federal funding of the federal EB program, which will trigger on when unemployment rises.
- The 3rd COVID-19 response package is reported to have $250 billion in temporary enhancements to unemployment assistance through 2020, including a $600 increase in the weekly checks of unemployed workers, a special disaster unemployment assistance program (Pandemic Unemployment Assistance) that covers the self employed, a temporary 13 week extension of benefits, federal funds to eliminate the waiting week and to support shared work programs.
Now Is the Time to Advance Structural Reforms
Unfortunately, the challenges ahead in the coming months of crisis and recovery will extend beyond the timeline for these shorter-term reforms, which alone are not enough to upgrade the UI system to fully respond to a crisis of this magnitude. Businesses large and small are already closing, and many workers will count on the UI program to weather the many months it will take to find new jobs in an economy slowly regaining its footing. Providing a strong, sustained structure of benefits now is a critical part of the architecture of mitigation and recovery.
In the coming weeks and months, Congress must:
- Fix automatic EB triggers: Turn on additional weeks of benefits automatically anytime the unemployment rate jumps a half percentage point, and add more weeks when it goes up to 6.5, 7.5, and 8.5 percent.
- Require states to enact shared-work programs that allow companies to avoid layoffs by putting workers on part-time schedules with partial unemployment benefits and provide federal funding for these programs during economic crises like now.
- Create minimum state standards around benefit length and generosity: Federal law should require all states provide a minimum of 26 weeks of benefits, reversing the actions of states that reduced the duration of benefits after the Great Recession. State UI programs should also replace at least 60 percent of a worker’s weekly wages, with a maximum of 67 percent of state’s average weekly wage.
- Create a jobseekers allowance of 13 weeks, at a lower benefit amount, for workers who are not covered by regular or pandemic unemployment insurance. This includes populations such as new entrants and students graduating into this recession, and returning caregivers, some of whom may need additional wrap-around services to support job search.
- Fill holes in the unemployment safety net: Increase recipiency of low-wage workers, who are disproportionately people of color and women, by requiring states to count the most recent earnings of UI applicants, treat part-time and full-time workers equally, and recognize unemployment caused by compelling personal issues such as illness, domestic violence, and relocation to follow a partner to a new job.
- Adequately fund unemployment benefits: Current federal law only requires states to tax $7,000 of each worker’s wage. This taxable wage base should be increased over five years to one-third of the Social Security wage base and indexed to gradually increase every year, to provide a stronger foundation for financing. Link any rescue funding for state trust funds to these long term fixes.
- Help UI claimants get back to work through the Wagner-Peyser Employment Services and periodic reemployment services.
Congress failed to fix these structural flaws in the wake of the Great Recession and the numerous state roll-backs of UI benefits and lingering insolvency that followed. The COVID-19 crisis should be a wake-up call to the need to immediately improve the basic structure of the nation’s first responder to economic distress.
Here are safeguards needed in bailout packages to protect working people and fight corporate greed
This week, Congress continues to negotiate a fiscal stimulus package to help ease the economic shock of the coronavirus. In these negotiations, it is critical that lawmakers establish strong conditions for industry bailouts. Working families, not just shareholders and corporate executives, must receive the benefits of any taxpayer-funded bailout.
Our economy is marked by extreme inequality. Chief executive officer (CEO) compensation has grown 940% since 1978, while typical worker compensation has risen only 12% during that time. From 1979 to 2018, the wages of the top 1% grew 158%, whereas the wages of the bottom 90% combined grew just 24%, less than one-sixth as fast. Extreme inequality and wage stagnation for virtually all but the highest earners for most of the last four decades have left fewer and fewer U.S. workers able to access the middle class. What Congress does now with this fiscal stimulus will either help address this inequality, or compound it and leave more workers behind.Read more
The unemployment rate is not the right measure to make economic policy decisions around the coronavirus-driven recession: Policymakers should use the employment rate to continue or stop economic assistance
Policymakers often use the unemployment rate to trigger when to turn on or turn off financial assistance in economic downturns and recoveries. The unemployment rate, however, is a bad choice for a policy trigger in the current pandemic-driven recession.
A large share of workers who lose their jobs in the coming weeks and months will very likely not be counted in the official unemployment rate because they won’t be actively looking for work. Given the nature of the pandemic, where we are all being told to stay away from work and all non-essential public activity, many laid-off workers will make the rational decision not to search for work until they get the all-clear from public health authorities.
Think of the restaurant worker who just got laid off. They might not report looking for work because that whole sector is shut down. What would be the point in actively looking for a job when it’s clear that there are none out there?
(In this video, Elise breaks down how to go about finding the right measures for economic policy decisions.)
Instead of using the unemployment rate as a trigger-off mechanism, policymakers should use the employment rate—the share of the adult population with a job.
The coronavirus fiscal response should be as big as needed—but current forecasts indicate at least $2.1 trillion is needed through 2020: The expected hit to the economy would mean almost 14 million job losses by summer
- The stimulus package to deal with the coronavirus economic shock should be as big as economic conditions dictate.
- The package to restore the nation’s economic health should spend at least $2.1 trillion through the end of 2020. This amount could increase even this year, and aid should continue past this year if conditions warrant.
- The fiscal response should continue until we reach full employment.
- The stimulus should be well-targeted and not squandered on unconditional giveaways to business that don’t spur the needed growth.
- The risk of going too small on stimulus is large and scary, while the risk of going too big is almost nonexistent.
Congress is taking up a fiscal stabilization package this week to cushion the economic shock of the coronavirus. A natural question arising in this debate will be “how big should it be?” The experience of the Great Recession argues clearly that the answer to this has to be “as big as is needed.” This is unsatisfying but is the most important answer to this question so we don’t repeat the fiscal policy blunders of the past.
For those who absolutely need a number to focus on, the likely cost of a fiscal boost sufficient to restore economic health by the end of 2020 starts at $2.1 trillion—but it could be more, and fiscal policy should be set to deliver more if conditions warrant. And conditions continue to worsen. The expected hit to the economy would mean a job loss of almost 14 million workers by summer.Read more
Every state will lose jobs as a result of the coronavirus: Policymakers must take action
Workers across the country have already lost their jobs as businesses temporarily shutter in response to the social distancing measures necessary to stop the spread of coronavirus—a trend which can be mitigated if policymakers act quickly. Expectations of just how many jobs will be lost are rapidly evolving. Goldman Sachs forecasts that the economy will contract by 2.5% over the first half of this year—which we estimate will translate into a loss of 3 million jobs by June. An even bleaker forecast from Deutsche Bank, which is in line with projections from JPMorgan, suggests that 7.5 million jobs will be lost by the summer. In this post, we attempt to predict the state-level impacts of these losses using the midpoint of these two forecasts—an estimated 5.25 million jobs lost.
We have distributed this projected job loss across states to provide a sense of the magnitude of the state-level shock, shown in Figure A. The coronavirus shock that is causing this recession is broad-based; the effects will likely be felt in every industry and geography. Still, workers in certain industries will be disproportionately affected—in particular, workers in food service, accommodations, and brick-and-mortar retail. As a result, states where these industries make up a larger share of employment, such as Florida, Hawaii, and Nevada, will be particularly hard hit. In Nevada, where two out of every five jobs are in leisure, hospitality, or retail, the state will likely lose 5.3% of private-sector jobs.Read more
Not everybody can work from home: Black and Hispanic workers are much less likely to be able to telework
The commonly paired statements that “everyone is working from home” and “everyone is having their goods delivered” amid the coronavirus outbreak ignores a whole segment of the workforce—the ones prepping and delivering their purchases. In fact, less than 30% of workers can work from home, and the ability to work from home differs enormously by race and ethnicity.
The chart below separates the share of workers who can telework for the three largest race groups as well as by Hispanic ethnicity (these groups are not mutually exclusive in these data). Asian workers are the most likely to be able to work from home, followed by non-Hispanic and white workers. Only 16.2% of Hispanic workers and 19.7% of black workers can telework.
Less than one in five black workers and roughly one in six Hispanic workers are able to work from home: Share of workers who can telework, by race and ethnicity, 2017--2018
| Race/ethnicity | Able to telework | |
|---|---|---|
| Race | White | 29.9% |
| Black or African American | 19.7% | |
| Asian | 37.0% | |
| Ethnicity | Hispanic or Latino | 16.2% |
| Non-Hispanic or Latino | 31.4% |
Source: U.S. Bureau of Labor Statistics, Job Flexibilities and Work Schedules — 2017–2018 Data from the American Time Use Survey
The next figure illustrates the share of workers who can telework by wage. Not surprisingly, low-wage workers have the least flexibility in their jobs: Only 9.2% of workers in the lowest quartile of the wage distribution can telework compared with 61.5% of workers in the highest quartile.
Higher-wage workers are six times as likely to be able to work from home as lower-wage workers: Share of workers who can telework, by wage level, 2017--2018
| Usual weekly earnings of full-time wage and salary workers(single jobholders only) | Share of workers who would work at home |
|---|---|
| Earnings greater than the 75th percentile | 61.50% |
| Earnings from 50th to 75th percentiles | 37.30% |
| Earnings from 25th to 50th percentiles | 20.10% |
| Earnings less than or equal to the 25th percentile | 9.20% |
Source: U.S. Bureau of Labor Statistics, Job Flexibilities and Work Schedules — 2017–2018 Data from the American Time Use Survey
What to expect in tomorrow’s unemployment insurance numbers: The leading edge of the coronavirus’s shock to the labor market, not the full picture
Tomorrow morning we will get the first piece of government labor market data that will show early signs of the coming coronavirus shock—initial unemployment insurance (UI) claims. When a worker is laid off and they apply for unemployment insurance, they show up in the Bureau of Labor Statistics’ initial unemployment insurance claims data, which means these data are a timely proxy for the number of workers who have been laid off. And reports of layoffs due to the coronavirus are beginning to stream in.
We estimate that by the summer, more than 3 million workers will have lost their jobs due to the coronavirus shock. How much of that will show up in the numbers released tomorrow? Definitely some, but perhaps not as much as you might expect. Tomorrow’s numbers capture unemployment insurance claims for the week ending last Saturday, March 14. While media reports suggest layoffs began accelerating last week, there is often a lag between when people are laid off and when they apply for benefits. If a worker was laid off last week and waited to apply for benefits until this week, they will not show up in tomorrow’s data. Further, while coronavirus layoffs began last week, the full weight of the impact—while swift—is still ramping up as businesses realize what they are up against.
This means that we should look at the numbers that come out tomorrow as just the leading edge of the labor market impact of the coronavirus shock. No one should take comfort if these numbers are relatively modest. In coming weeks, millions will likely be laid off, or not hired when they otherwise would have been. Policymakers should be thinking about a big fiscal stimulus package, including financing a sizeable amount of household consumption, giving fiscal aid to state governments, providing a payroll tax credit to businesses to not lay off workers, ramping up direct government purchases of things like medical equipment to help fight the virus, and making sure all measures to address the coronavirus economic shock are automatically continued until economic conditions warrant them being removed.
I will be analyzing the data when they are released tomorrow and down the road, as we have a fuller picture of how the coronavirus has impacted the labor market.
Update: Shierholz’s March 19 analysis of the unemployment data is available here.
Senate coronavirus bill is crucial—but it’s a fraction of what’s needed
Family First Coronavirus Response Act is an important first step in the United States’ response to the COVID-19 pandemic, and the Senate should pass it immediately. There are provisions for both health spending and paid sick leave, as well as income supports in the form of expanded food-assistance programs and unemployment insurance.
We summarize some of the bill’s specific provisions below, but we first want to highlight a few important loopholes and talk about the important next steps.
The bill has some glaring exclusions. Perhaps the most problematic is the carve-out for large businesses; the bill exempts employers with more than 500 workers from its paid leave mandate. Bureau of Labor Statistics data show that 11% of workers at private-sector businesses with 500 workers or more do not have access to paid sick leave, and 48% of private-sector workers work in firms with 500 workers or more. Together, that means that 6.8 million private-sector workers in large firms will not have paid sick days as a result of the large-firm exemption. And this does not count the fact that workers at these firms that do provide paid sick days often do not provide enough time for workers to self-quarantine for the recommended 14 days.
The bill also makes it possible for the Secretary of Labor to exempt certain health care providers and emergency responders from its paid leave provisions, and to exempt businesses with less than 50 people. The data show that 36% of workers at private-sector businesses with less than 50 workers do not have access to paid sick leave, and 27% of private-sector workers work in firms with 50 or fewer workers, together meaning that 12.8 million workers may not have access to paid sick days as a result of potential exemptions for small businesses. Read more
The coronavirus pandemic requires state and local policymakers to act, in addition to demanding a strong federal response
Federal lawmakers seem poised to enact legislation that would help combat some of the public health and economic dangers posed by the COVID-19 pandemic. However, this initial legislation is not sufficient to fully address the problems created by the crisis, and even with additional federal action, there are still steps that state and local policymakers must take—both to slow the spread of the virus and to mitigate the economic toll that the crisis will take on state and local economies. Here are some of the critical steps that state and local officials should consider, including many good ideas that are circulating and some of the positive steps already being taken:
Protect public health
- The foremost action for state policymakers and community leaders is to do everything they can to slow the spread of the virus. Though it will be disruptive in the short run, leaders need to strongly encourage social distancing. In many communities, this may require closing schools, libraries, and other community centers; cancelling events; requiring telework where possible; ordering retail shops, restaurants, and bars to close or shift to delivery service only; and setting strict limits on public gatherings.
- Expand access to testing and treatment by bolstering state and local health care systems with emergency funding and, to the extent possible, removing any financial barriers for people seeking care. Good examples can be seen in Washington, where Governor Inslee used his emergency powers to require state health care insurers to waive all copays and coinsurance for all coronavirus testing. Similar actions have been taken in California, Colorado, Massachusetts, New Jersey, and New York. But states should commit to not only covering the cost of coronavirus testing, but treatment as well. Federal lawmakers are considering a 6.2% increase in the share of Medicaid costs covered by the federal government to help relieve the strain on state budgets caused by the virus. Such an increase should hopefully be enough to cover the vast majority of COVID-19-related care.
- Expand health care coverage through Medicaid and the exchanges, and protect coverage for those with employer-based plans. As the Century Foundation discusses, states should request emergency waivers to quickly expand eligibility for Medicaid, especially in those states that did not adopt the Affordable Care Act (ACA) expansion. States that run their own health insurance exchanges can also declare the COVID-19 outbreak as a special enrollment period that allows people to sign up for coverage outside the standard open enrollment period. Governors should also use emergency authority to require employers to maintain insurance coverage for employees whose work hours fall below the ACA’s 30-hour threshold for employer provision of insurance.
- Enact emergency paid sick leave programs that cover all workers in businesses of all sizes in those states where such systems do not already exist. The federal COVID-19 response bill that is moving through Congress takes an important step in the right direction, but does not provide the comprehensive access to paid leave that this moment demands (and should really be available in non-pandemic times anyway). Giving workers the ability to take time off when they or a family member are sick protects public health. It eliminates the need to work when they’re ill or must provide care for a sick family member, thereby reducing the risk of disease transmission. Studies have shown that paid leave programs measurably reduce virus transmission. In states that have paid leave programs, lawmakers should mandate that businesses provide at least 14 days of leave, regardless of workers’ accrued leave time.
- Create clear, accessible systems for communicating information about the virus and resources for the public. This can include hotlines and online resource pages. It may also require larger public education efforts—public service announcements, social media campaigns—and resources to expand online access for low-income communities and make content available in multiple languages.
Coronavirus shock will likely claim 3 million jobs by summer: Policy is needed now to curb further losses
Note: Economic forecasts have been revised since this post was published. See this post for more recent job loss projections.
At this point, a coronavirus recession is inevitable. But the policy response can determine how deep it is, how long it lasts, and how rapidly the economy bounces back from it.
If this response includes enough fiscal stimulus that is well-targeted and sustained so long as the economy remains weak, job loss will be substantially reduced relative to any scenario where policymakers drag their feet. Even with moderate fiscal stimulus, we’re likely to see 3 million jobs lost by summertime. Keeping this number down and allowing any job loss to be quickly recouped after the crisis ends should spur policymakers to act.
Put simply, the federal government needs to finance a much larger part of household consumption in coming months, transfer significant fiscal aid to state governments, and ramp up direct government purchases (particularly on items helpful in fighting the epidemic).
COVID-19 pandemic makes clear that we need national paid sick leave legislation
The COVID-19 pandemic continues to highlight the costs of economic inequality in the United States. There’s the inequality in access to paid sick days and health insurance between high- and low-wage earners. There’s the inequality in the ability to work from home across sectors, with workers in one of the most exposed sectors—leisure and hospitality—being the least likely to have the ability to work from home. And there will be inequality in the economic impact of the pandemic, as workers in those sectors are at higher risk of reduced work hours or losing their jobs stemming from the drop in spending on travel and eating out.
Fortunately, there is a relatively simple way to address some of these inequities: The federal government can pass legislation to provide paid sick leave for all workers. Paid sick leave not only helps reduce transmission of disease, it also provides economic security for workers who might otherwise lose income if they have to take time off from work.
Federal legislators need to look no further than the states to find multiple models for paid sick days legislation. As the map shows below, 13 states and the District of Columbia require employers to provide paid sick leave, with Maine’s new paid leave law set to take effect in 2021. Each of these states sets an accrual rate defining how many hours of paid leave employers must provide based upon the hours worked, typically with some cap on leave that can be used per year. Covered employers vary somewhat across the states, with some states exempting small employers or setting varying accrual rates and usage caps based upon the size of the employer.
Why a fiscal stimulus that is big and fast is so necessary—and why it should continue so long as the economy is weak
Macroeconomists seem overwhelmingly worried that the COVID-19 shock could cause a significant recession, if unaddressed by policy. This message has still yet to get fully through to most policymakers, it seems.
Much of the policy discussion so far has focused, admirably enough, on targeting aid to workers likely to be directly affected by the virus itself and to reduced work caused by the “social distancing.” The responses to these issue have been proper: boosting the capacity of the health system, mandating emergency paid sick leave, reforms to unemployment insurance (UI), and providing free testing.
These measures are smart and well-meaning. However, they need to be supplemented by large-scale stimulus. Simply put, we need to do more to buffer the wider economy against the fallout of the COVID-19 shock.
As workers are laid off from directly affected industries (like restaurants and travel), their incomes will fall and so they will spend less money in even nonaffected industries. Because the industries directly affected by COVID-19 disproportionately employ low-wage workers with little wealth (and therefore little to no savings to turn to to maintain spending when they are laid off), the reduction in spending that will accompany wage losses will be even faster and sharper than in typical recessions. These spending cutbacks will then cause work reductions and income losses in nonaffected industries, and the vicious cycle will deepen.
One prime propagating mechanism that will make this vicious cycle worse if left unchecked is the response of state and local government spending. A negative economic shock causes tax revenues in these governments to fall. Balanced budget rules at the state and local levels will cause spending to contract, putting further downward pressure on economic growth.
In short, the economic shock from COVID-19 will come extraordinarily fast and be very broad and will have a large effect on the economy. This means that even after targeted interventions are undertaken, quick-acting and large economic stimulus will be needed.Read more
Union workers are more likely to have paid sick days and health insurance: COVID-19 sheds light on least-empowered workers
The COVID-19 pandemic highlights the vast inequalities in the United States between those who can more easily follow the Center for Disease Control’s recommendation to stay home and seek medical attention when needed and those who cannot. High-wage earners are more likely to be able to stay home and to have health insurance to seek medical care than low-wage earners. And, those in certain sectors—e.g., information and financial activities—are more likely to have paid sick days or be able to work from home than those in other sectors—e.g., leisure and hospitality. COVID-19 also sheds light on another difference in economic security and access to medical care among workers: the benefits to being in a union.
Union workers are more likely to have access to paid sick days and health insurance on the job than nonunion workers. The figure below shows the significant differences in those rates using the National Compensation Survey.
Only two-thirds of nonunion workers have health insurance from work compared with 94% of union workers. Having health insurance means workers are more able to seek and afford the care they need. We know in that the United States, millions of people delay getting medical treatment because of the costs. Without health insurance, many do not have a regular source of care and simply won’t go to the doctor to get the attention and information they need to not only get better but also reduce the spreading of disease.
Union workers are more likely to have paid sick days and health insurance on the job: Share of private-sector workers with access to paid sick days and health insurance, by union status, 2019
| Union | Nonunion | |
|---|---|---|
| Access to paid sick leave benefits | 86% | 72% |
| Access to health care benefits | 94% | 67% |
Source: U.S. Bureau of Labor Statistics, National Compensation Survey 2019
Union workers are also more likely to be able to stay home when they are sick because they are more likely to have access to paid sick leave. 86% of unionized workers can take paid sick days to care for themselves or family members, while only 72% of nonunion workers can.
Having a union allows workers and their families access to more tools to help them withstand the coronavirus pandemic. Union workers are more likely to be able to stay home and seek medical care, which will help strengthen their communities by being less likely to spread the virus.
Teachers pay out-of-pocket to keep their classrooms clean of COVID-19: Teachers already spend on average $450 a year on school supplies
“I keep my surfaces as clean as possible, wipe down tables every day, and use sanitizer, but it becomes an expense, because the district doesn’t give us wipes or sanitizer for our classrooms,” Kristin Luebbert, a teacher at the U School in North Philadelphia, recently told The Philadelphia Inquirer. “It’s just a worry—what’s the plan and how are we going to be safe?”
With fears over COVID-19 spreading throughout the nation’s classrooms, there is understandably a push to maintain cleanliness in all schools. Even the Centers for Disease Control weighed in with recommendations for schools and teachers in particular too: clean and disinfect frequently touched surfaces and objects in the classroom.
The question is who’s going to pay for the products needed to protect students and teachers?
Turns out, some teachers are using their own money to cover the cost of things such as hand sanitizers and wipes, according to some published reports on the issue. That expense is in addition to the, on average, $459 teachers spend on school supplies for which they are not reimbursed (adjusted for inflation to 2018 dollars), found an analysis by Economic Policy Institute economist Emma García.
“What’s ahead for teachers in light of the threat of COVID-19 spreading will only add to the existing challenges and stress,” predicts García. “Teachers already act as first respondents when it comes to children’s basic needs, and schools are the only place where some students can have access to hot meals, medical care, washing their dirty laundry, or even to shelter. These, as well as the expense outlays, are worse in schools serving larger shares of low-income students.”Read more
Trump’s payroll tax cuts are a terrible opening bid to address the economic fallout of COVID-19: But employer tax credits can be part of the economic response if they finance direct benefits for workers
Unconditional tax cuts for employers are a terrible policy response to the economic fallout of COVID-19. But employer tax credits that are tied to the provision of specific benefits for workers can be a useful way to deliver emergency help. In the long run, key benefits like paid sick leave and strong unemployment insurance should not rest on employer tax credits, but these credits might be the best way to deliver emergency benefits right now.
The Trump administration has put forward the idea of cutting both employee- and employer-side payroll taxes as the centerpiece of an economic response to the COVID-19 epidemic. This is a terrible opening bid. In late 2010, the Obama White House and a Republican-led Congress agreed on a temporary payroll tax cut for employees only as a compromise measure to provide economic stimulus.
But the employee-side payroll tax cut is an even worse potential compromise this time. One reason is that it would not get enough money out the door and into households’ pockets quickly enough. A COVID-19 recession will come fast and people will need lots of help quickly. A payroll tax cut will dribble out gradually over time. Another reason is the employee-side payroll tax cut is poorly targeted and sends lots of money to high-income households. A COVID-19 recession is laser-targeted at sectors with lots of low-wage workers, and the response should be too. So, even employee-side payroll tax cuts are a poor centerpiece of any policy package responding to the coming slowdown.
Employer-side payroll tax cuts are even much worse. They are a pure windfall to business and would do nothing for workers in the short run. These employer-side cuts should be flatly opposed.
There is, however, a potential role for employer tax credits as a way to stand-up emergency paid sick leave or work sharing or unemployment insurance. The optimal way for these programs to work is to have them be an ongoing part of our social safety net that take effect automatically during downturns. In the case of work-sharing and unemployment insurance, these should be social insurance programs financed in the long run by payroll taxes. Paid sick leave should be a mandated labor standard. But since we do not have strong systems in place to provide these benefits to workers affected by the economic fallout of COVID-19 in the short run, and because placing new costs on employers just as revenue potentially craters might not be optimal, we could use employer tax credits to finance the emergency provision of key benefits like paid sick leave and expanded unemployment insurance.
Economists Jared Bernstein and Jesse Rothstein, for example, have a proposal to use employer tax credits to finance quicker-acting unemployment insurance that allows workers to stay on payroll and be paid even while not working during a COVID-19 downturn. Dean Baker made a similar proposal as the Great Recession loomed.
Policy discussions about buffering the economy from the COVID-19 shock are moving very quickly and lines are being drawn. It remains the case that large direct payments to households and having the federal government pick up states’ Medicaid spending for a year are likely the most valuable macroeconomic support that could be provided because they’re well-targeted to counteract the particular damage inflicted by a COVID-19 recession.
It also remains the case that unconditional employer tax cuts should be rejected flatly as a solution. But there does remain a potential role for employer tax credits in helping deliver benefits to workers. As long as these tax credits are used solely for this purpose, they should be considered.