Ideas Good and Not so Good: Infrastructure Investment and Corporate Taxes
President Obama released his fiscal year 2016 budget proposal earlier this week. The proposal is full of good ideas, so-so ideas, and some not so good ideas. One great idea is to devote more money to the Highway Trust Fund for infrastructure investments, which improves job growth now and in the future. At the moment, however, it’s paired with the not-so good idea to pay for it with a mandatory one-time 14 percent tax on the $2 trillion of tax-deferred foreign earnings of U.S. corporations, which would bring in $268 billion over the six years. To be clear, this is an improvement over the other “one-time” corporate tax change often floated to realize a temporary revenue windfall—a full repatriation tax “holiday” for earnings accumulated overseas. So if the Obama proposal is a lot better than a full holiday, what’s the problem? The proposed one-time tax rate is still too low.
The 14 percent one-time tax is a transition tax to the president’s proposal to institute a 19 percent tax on corporate foreign-sourced earnings. Currently, corporate foreign-sourced earnings are subject to the U.S. corporate income tax, but payment of the tax is deferred (i.e., no U.S. taxes are paid at all) until the corporation brings to earnings to the United States (or in the jargon: repatriates the earnings). The earnings are then theoretically taxed at the statutory corporate tax rate of 35 percent, but due to various deductions and tax credits most corporations pay substantially less than the 35 percent rate. It is estimated that firms have stashed away $2 trillion in untaxed earnings overseas. One reason it makes sense for them to stash money overseas is that Congress has in the past offered a repatriation tax “holiday,” which allowed them to repatriate it at hugely preferential rates. And proposals to do this again have been percolating for years, so it makes a lot of sense for multinationals to wait and see if they get another windfall.
This largely explains why the business community, rather than jumping at the chance to face a 14 percent tax rate instead of the 35 percent rate, wants the transition tax rate to be no higher than 5 percent or even lower. Of course they can’t flat-out argue that they’re actually waiting for another pure windfall, so instead they argue the 14 percent rate somehow harms competitiveness, though they don’t explain how. Let’s examine this specious argument.
Firms compete over customers for their products and competitiveness, by its very nature, is forward looking since the past can’t be changed. The tax on income that has already been earned will not affect a firm’s behavior; the accumulated $2 trillion of untaxed income is based on past decisions, which cannot be changed. Consequently, there is no reason to tax this income at a rate less than the statutory corporate tax rate since there is no competitiveness issue. A lower tax rate just rewards firms for the aggressive tax planning that allowed them to accumulate $2 trillion in untaxed earnings.
TPP and Provisions to Stop Currency Management: Not That Hard
As discussions surrounding the proposed Trans-Pacific Partnership (TPP) heat up, there has been a new push to include provisions within the agreement to keep countries from managing the value of their currency for competitive gain vis-à-vis their trading partners. This push got an unexpected (by me, anyhow) boost recently when former U.S. Treasury Secretary and former Obama administration National Economic Council Director Larry Summers called for it (see page 22 in the link).
This currency management is a key cause of persistent U.S. trade deficits, and it is widespread. Given that our trade deficit drags on demand growth, and given that generating sufficient demand to reach full employment is likely to be a key economic problem in coming years, this is an important issue to address. Further, given that U.S. tariffs are extremely low, it’s hard to think of any other issue besides currency management that could possibly matter more for trade flows, so excluding it from the TPP seems odd. And yet many TPP proponents are extremely reluctant to include binding tools to stop currency management in the treaty. There have been many arguments for why the United States can’t or shouldn’t stop currency management, but the latest rationale is pretty novel: the claim is that including a currency chapter in the TPP would let other countries use the provisions of the treaty to stop the Federal Reserve from engaging in expansionary monetary policy. If such a provision had been in effect during the Great Recession, this argument continues, it would have kept the Fed from engaging in the quantitative easing (QE) that it undertook to blunt the recession and spur recovery.
Tying the Fed’s hands like this would indeed be a bad thing, but there’s no reason at all to think one couldn’t define currency management in way that did not constrain the Fed or any other central bank wanting to undertake similar maneuvers.
A Great Idea: End the Sequester
President Obama released his 2016 budget proposal this morning. While president’s budgets are rarely implemented, especially if Congress is controlled by the opposite party, they help to set the agenda for the upcoming legislative year. And this year the president has a great idea that should not be disregarded: ending the sequester.
The president has proposed increasing discretionary spending by over $70 billion, which would effectively put an end to the sequester-induced straight jacket on the budget. Half of the increase would be directed for defense discretionary spending and the other half for nondefense discretionary programs—i.e., the programs that fund public investments. While the proposed spending increase is not enough to meet our actual needs, it is a start.
As a reminder, the sequester is the result of legislation Congress passed and President Obama signed in 2011. At the time, the discretionary caps and sequester were a bad idea; today they are a bad and dangerous idea. This self-imposed austerity was the major factor in the slow recovery from the Great Recession. Recently, Erskine Bowles, a deficit hawk and co-chair of the 2010 National Commission on Fiscal Responsibility and Reform (often called Simpson-Bowles) said “I don’t think it gets any stupider than the sequester.” I agree. Let’s hope the president forcefully pushes Congress to end the stupid sequester.
Sluggish Wage Growth Continues Throughout 2014
Today, the Bureau of Labor Statistics (BLS) released the Employment Cost Index (ECI), a closely watched measure of labor costs, for the last quarter of 2014. Nominal year-over-year compensation for private industry workers rose 2.3 percent, while private sector wages and salaries rose 2.2 percent.
To put these numbers in perspective, below is a chart of the year-over-year changes in both the ECI compensation and wage series along with the monthly BLS Current Employment Statistics (CES) nominal wage series for all nonfarm employees. It’s clear that nominal wage growth (using any of these measures) has been flat for a long time—and there’s little evidence this trend has changed in recent months.
The horizontal shaded area represents growth of 3.5 to 4 percent—nominal wage growth consistent with the Fed’s 2 percent inflation target and a stable labor share of income (given a range of 1.5 to 2 percent trend productivity growth).
We need to see consistent wage growth above this range before there is a hint of upward pressure on prices stemming from too-tight labor markets. Thus, the Fed should not even consider raising interest rates to forestall inflation until wage growth is consistently above this target.
Year-over-year change in private-sector nominal average hourly earnings, 2007–2014
| CES, all private | ECI, wages and salaries | ECI, total compensation | |
|---|---|---|---|
| 2007-03-01 | 3.6427146% | 3.5749752% | 3.1746032% |
| 2007-04-01 | 3.3234127% | ||
| 2007-05-01 | 3.7257824% | ||
| 2007-06-01 | 3.8575668% | 3.3431662% | 3.1465093% |
| 2007-07-01 | 3.4482759% | ||
| 2007-08-01 | 3.5433071% | ||
| 2007-09-01 | 3.2337090% | 3.4146341% | 3.1219512% |
| 2007-10-01 | 3.2778865% | ||
| 2007-11-01 | 3.3203125% | ||
| 2007-12-01 | 3.1113272% | 3.2945736% | 3.0038760% |
| 2008-01-01 | 3.1067961% | ||
| 2008-02-01 | 3.0464217% | ||
| 2008-03-01 | 3.0332210% | 3.1639501% | 3.1730769% |
| 2008-04-01 | 2.8324532% | ||
| 2008-05-01 | 3.0172414% | ||
| 2008-06-01 | 2.6666667% | 3.1398668% | 2.9551954% |
| 2008-07-01 | 3.0000000% | ||
| 2008-08-01 | 3.2794677% | ||
| 2008-09-01 | 3.2747983% | 2.9245283% | 2.8382214% |
| 2008-10-01 | 3.3159640% | ||
| 2008-11-01 | 3.5916824% | ||
| 2008-12-01 | 3.6303630% | 2.6266417% | 2.4459078% |
| 2009-01-01 | 3.5310734% | ||
| 2009-02-01 | 3.4725481% | ||
| 2009-03-01 | 3.1775701% | 2.0446097% | 1.8639329% |
| 2009-04-01 | 3.2212885% | ||
| 2009-05-01 | 2.8358903% | ||
| 2009-06-01 | 2.7365492% | 1.5682657% | 1.4814815% |
| 2009-07-01 | 2.5889968% | ||
| 2009-08-01 | 2.4390244% | ||
| 2009-09-01 | 2.2977941% | 1.3748854% | 1.1959522% |
| 2009-10-01 | 2.3383769% | ||
| 2009-11-01 | 2.0529197% | ||
| 2009-12-01 | 1.8198362% | 1.2797075% | 1.1937557% |
| 2010-01-01 | 1.9554343% | ||
| 2010-02-01 | 1.8140590% | ||
| 2010-03-01 | 1.7663043% | 1.4571949% | 1.6468435% |
| 2010-04-01 | 1.7639077% | ||
| 2010-05-01 | 1.8987342% | ||
| 2010-06-01 | 1.7607223% | 1.6348774% | 1.9160584% |
| 2010-07-01 | 1.8476791% | ||
| 2010-08-01 | 1.7070979% | ||
| 2010-09-01 | 1.8867925% | 1.6274864% | 2.0000000% |
| 2010-10-01 | 1.8817204% | ||
| 2010-11-01 | 1.6540009% | ||
| 2010-12-01 | 1.7426273% | 1.8050542% | 2.0871143% |
| 2011-01-01 | 1.9625335% | ||
| 2011-02-01 | 1.8262806% | ||
| 2011-03-01 | 1.8246551% | 1.6157989% | 1.9801980% |
| 2011-04-01 | 1.9111111% | ||
| 2011-05-01 | 2.0408163% | ||
| 2011-06-01 | 2.1295475% | 1.6979446% | 2.3276634% |
| 2011-07-01 | 2.2566372% | ||
| 2011-08-01 | 1.9434629% | ||
| 2011-09-01 | 1.9400353% | 1.6903915% | 2.1390374% |
| 2011-10-01 | 2.1108179% | ||
| 2011-11-01 | 2.0228672% | ||
| 2011-12-01 | 1.9762846% | 1.5957447% | 2.2222222% |
| 2012-01-01 | 1.7060367% | ||
| 2012-02-01 | 1.9247594% | ||
| 2012-03-01 | 2.1416084% | 1.8551237% | 2.1182701% |
| 2012-04-01 | 2.0497165% | ||
| 2012-05-01 | 1.7826087% | ||
| 2012-06-01 | 1.9548219% | 1.8453427% | 1.8372703% |
| 2012-07-01 | 1.7741238% | ||
| 2012-08-01 | 1.8630849% | ||
| 2012-09-01 | 1.9896194% | 1.8372703% | 1.9197208% |
| 2012-10-01 | 1.4642550% | ||
| 2012-11-01 | 1.8965517% | ||
| 2012-12-01 | 2.1102498% | 1.7452007% | 1.8260870% |
| 2013-01-01 | 2.1505376% | ||
| 2013-02-01 | 2.1030043% | ||
| 2013-03-01 | 1.8827557% | 1.7346054% | 1.9014693% |
| 2013-04-01 | 1.9658120% | ||
| 2013-05-01 | 2.0504058% | ||
| 2013-06-01 | 2.1729868% | 1.8981881% | 1.8900344% |
| 2013-07-01 | 1.9132653% | ||
| 2013-08-01 | 2.2118248% | ||
| 2013-09-01 | 2.0356234% | 1.8041237% | 1.8835616% |
| 2013-10-01 | 2.2495756% | ||
| 2013-11-01 | 2.1573604% | ||
| 2013-12-01 | 1.9401097% | 2.0583190% | 1.9641332% |
| 2014-01-01 | 1.9789474% | ||
| 2014-02-01 | 2.1017234% | ||
| 2014-03-01 | 2.1419572% | 1.7050298% | 1.6963528% |
| 2014-04-01 | 1.9698240% | ||
| 2014-05-01 | 2.0510674% | ||
| 2014-06-01 | 1.9599666% | 1.8628281% | 2.0236088% |
| 2014-07-01 | 2.0442219% | ||
| 2014-08-01 | 2.1223471% | ||
| 2014-09-01 | 1.9950125% | 2.2784810% | 2.2689076% |
| 2014-10-01 | 1.9510170% | ||
| 2014-11-01 | 1.9461698% | ||
| 2014-12-01 | 1.6549441% | 2.1848739% | 2.3450586% |

* Nominal wage growth consistent with the Federal Reserve Board's 2 percent inflation target, 1.5 percent productivity growth, and a stable labor share of income.
Source: EPI analysis of Bureau of Labor Statistics Current Employment Statistics (CES) public data series and Bureau of Labor Statistics Employment Cost Index (ECI)
Congress, Consider the Facts not Fiction before Voting to Repeal the Medical Device Tax
A priority of the new GOP-dominated Congress is to dismantle the Affordable Care Act (ACA), otherwise known as Obamacare. Having failed to repeal the ACA in the past, the GOP is now starting to nibble at the edges of the ACA, hoping to weaken it. One nibble that is likely to see congressional action soon, and which may even pass in both houses, is the repeal of the medical device tax.
The medical device tax is a small 2.3 percent excise tax on the manufacturer’s price of medical devices. It applies to manufacturers and importers of medical devices. The purpose of the tax is to raise revenue to help offset the costs of the ACA by taxing industries that benefit from health care reform: as reform leads to more people with health insurance coverage, the demand for health care—including medical devices—is likely to rise. The medical device tax became effective on January 1, 2013 and is projected to raise about $3 billion per year, or almost $30 billion over 10 years.
The medical device industry, which apparently is represented by Advanced Medical Technology Association (AdvaMed), argues this small tax is a job killer. According to a recent “study” by AdvaMed, the tax reduced industry employment by 14,000 jobs in 2013, or 3.2 percent of the employees in the industry. Furthermore, the “study” argues that R&D has been reduced in the industry, although no numbers are reported. AdvaMed says they estimated this number from a survey of 55 companies in the industry—less than a quarter of the firms in the industry.
This appears to be pretty damning evidence against the medical device tax, but how does it square with what really happened? Every year, Ernst & Young (E&Y) issues a report on the financial condition of the industry; the E&Y data come from a variety of sources including company financial reports. E&Y shows that industry revenues increased by 4 percent between 2012 and 2013, R&D spending increased by 6 percent, and employment increased by 5 percent. In the first year of the medical device tax, the industry created over 20,000 jobs! Oh, and profits were up by 32 percent.
Of course, it is impossible to say what would have happened in the absence of the medical device tax; perhaps more jobs would have been created. But, contrary to AdvaMed’s fictions, it is clear that the number of jobs in the industry has not fallen.
At about the same time the AdvaMed “study” was released, the Congressional Research Service issued an updated report on this tax. The report concludes: “The analysis suggests that most of the tax will fall on consumer prices, and not on profits of medical device companies. The effect on the price of health care, however, will most likely be negligible because of the small size of the tax and small share of health care spending attributable to medical devices.”
Unless Congress is willing to replace lost revenue from the repeal of the medical device tax, they should keep this small tax on one group that benefits from the ACA.
New Data Show Top 1 Percent Really are Different from You and Me
On Monday, we released new estimates of top incomes by state for 2012, based on the work done by Thomas Piketty and Emmanuel Saez. Coincidentally, Saez just released a preliminary update to 2013 of the national top income time series. Saez’s key finding is that the average income of the top 1 percent in the U.S. fell in 2013 by 14.9%. This decline at the top was large enough to lower overall average incomes in 2013 by 3.2%. The good news is, the bottom 99% saw their earnings climb—but by a very modest and somewhat disappointing 0.2%.
Illustrating that the top 1 percent really are different from you and me, Saez notes the fall in income at the top is due to high income earners shifting income from 2013 to 2012 in an effort to reduce their tax liabilities in anticipation of higher top marginal tax rates which took effect in 2013. In an earlier EPI analysis in October 2014, Lawrence Mishel and Will Kimball reported on the decline of wages among the top 1 percent of wage earners, which prefigured these results for households. Similarly, Mishel and Kimball also noted the changes in taxes and suggested this decline was probably only temporary.
Saez expects top incomes to rebound in 2014, but fall short of their 2012 values. Indeed, James Parrott of the Fiscal Policy Institute noted in his summary of New York State top income trends (look up your state’s top income trends here) that data from the New York State Division of the Budget indicate that the top 1 percent’s share of New York personal income tax liability is expected to reach 42.5% in 2015—just shy of its 2012 value of 43.2%.
Trade Agreements or Boosting Wages? We Can’t Do Both
It’s widely expected that in tonight’s State of the Union address President Obama will call for actions to boost wages for low- and moderate-wage Americans, and also for moving forward on two trade agreements—the Trans-Pacific Partnership (TPP) and the Trans-Atlantic Trade and Investment Partnership (TTIP).
These two calls are deeply contradictory. To put it plainly, if policymakers—including the President—are really serious about boosting wage growth for low and moderate-wage Americans, then the push to fast-track TPP and TTIP makes no sense.
The steady integration of the United States and generally much-poorer global economy over the past generation is a non-trivial reason why wages for the vast majority of American workers have become de-linked from overall economic growth. This is not a novel economic theory—the most staid textbook models argue precisely that for a country like the United States, expanded trade should be expected to (yes) lift overall national incomes, but should redistribute so much from labor to capital owners, so that wages actually fall. So, it can boost national income even while leaving the incomes of most people in the nation lower than otherwise.
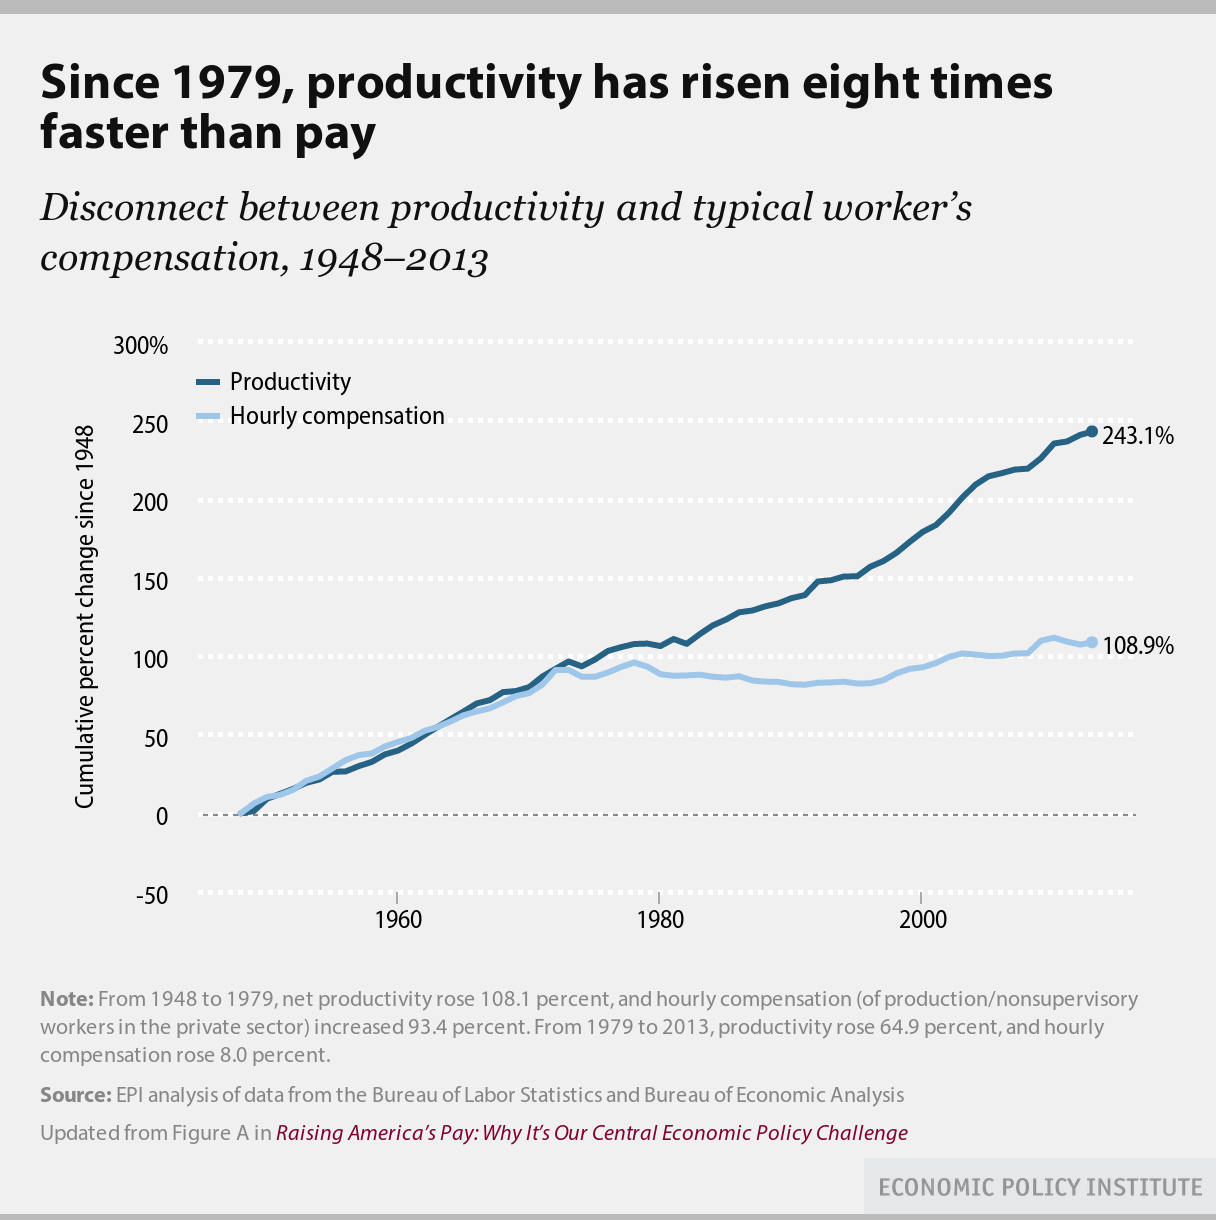
The intuition on how is pretty easy. Take the most caricatured example of how expanded trade works: the United States produces and exports more capital-intensive goods (say airplanes) and imports more labor-intensive goods (say apparel). By focusing on what we’re relatively better at producing (capital-intensive airplanes)and trading this extra output for what our trading partners are relatively better at producing (labor-intensive apparel), we can see national incomes rise in both countries. This specialization in the United States requires shifting resources (i.e., workers and capital) out of apparel production and into airplane production. But each $1 in apparel production lost requires more labor and less capital than the $1 in airplane production gained—causing an excess supply of labor and an excess demand for capital. Capital’s return rises while labor’s wage falls.
The President’s Twofer
In the weeks leading up to the State of the Union address, President Obama has gradually laid out his vision for America. I am particularly impressed with his proposal to make two years of community college free for students who are willing to work for it. This program would help young adults from lower-income families get a needed start toward a four year college education or vocation training for a career.
Critics have argued it is easy to propose a new program without paying for it. Well, last Saturday, the president said how he will pay for it: raise taxes. What is great about his tax proposal is it is a twofer. First, it would raise needed revenue—$320 billion over 10 years—to pay for the policies that would help low- and middle-income families. Second, it would make the tax code fairer and help reduce the growth in the share of income going to the top 1 percent by increasing taxes on capital income—bringing taxes levied on income gained from wealth closer to income gained from working. The administration estimates that 99 percent of the impact of this proposal would affect the richest 1 percent and more than 80 percent would affect just the richest 0.1 percent.
The main tax proposal is changing how capital gains are taxed. The tax rate on capital gains and dividends is increased to 28 percent—the rate under President Reagan. Currently, the tax rate on capital gains and dividends is 20 percent plus a 3.8 percent surtax. The president’s proposal would increase the tax rate to 24.2 percent plus the 3.8 percent surtax.
In addition, the proposal removes a loophole—the “stepped-up basis” loophole—that allows the wealthiest taxpayers to escape paying tax on inherited assets. We at EPI have been pushing for this change for years. Currently, when assets are transferred, say in a bequest, no taxes are due on appreciated assets. For example, suppose an individual purchases $10 million in stock. That person would have to pay taxes on any realized capital gains when the stock is sold (if the stock was sold for $100 million then the individual would pay taxes on the difference between the purchase price—the basis—and the sales price or $90 million). But if the individual never sells the assets and passes on the $100 million of stock to an heir, no capital gains taxes are due on the $90 million gain. Furthermore, when the individual receiving the assets sells the assets, the basis is stepped-up to $100 million rather than $10 million. The president’s proposals would retain the $10 million basis for the heir (called carry-over basis) and taxes would be paid on any gains when the assets are inherited. In an era with a deeply eroded estate tax, removing this “stepped-up basis” loophole would help us tax large blocks of inherited wealth—essentially adopting some of Thomas Piketty’s ideas for pushing back against rising income and wealth inequality.
What I Want to Hear in the State of the Union Address
On Tuesday, President Obama will deliver his State of the Union address, which gives him an opportunity to lay out his priorities and set an agenda for the year ahead.
At EPI, we have argued that raising wages is the central economic challenge. It is terrific news that the president will address wage stagnation in his speech. After a year of strong job creation but continued stagnant wage growth, many economists and commentators—not to mention the American people—are beginning to focus on wages. Even the new GOP-controlled Congress is paying lip service to the middle class squeeze (but is offering no program to address these challenges). So we are now entering into a great debate about what can be done to raise wages. Ross Eisenbrey and I offered our solutions in a recent interview in The New Republic.
Given congressional obstruction, the president has done his best to address our most pressing economic challenges through executive action:
Paid Leave is Vital to Families’ Economic Security
Yesterday, President Obama proposed a fundamental right to earned paid sick leave for all workers in this country. He also directed federal agencies to offer paid family leave to their workers. This is welcome news.
The fact is, we are behind all of our economic peers in the world in terms of providing what should be a bare minimum standard: paid leave when workers are sick, have doctor’s appointments, or need to care for family members. We also fall short when it comes to family leave—although California has had great success with their paid family leave initiative. Meanwhile, Bloomberg put out a great graphic comparing maternity leave in the United States with other countries in the world. It’s easy to see how far we have to go.
Employers, workers, and the public would all benefit from paid sick and family leave. My colleagues and I have shown through a series of studies on cities and states that paid sick leave is of negligible cost to employers, and we have presented this evidence at state legislative hearings. Mandatory paid sick time would mean that the many employers that already provide paid sick days would have a level playing field with their competitors, and all employers would be able to more easily maintain healthy workplaces. While any new labor standard generates concerns about the business climate and job creation, the evidence from jurisdictions that require paid sick days has all been positive.