Less Than Half the Truth: Jobs and Wages in Export Industries
Trade is a hot topic on Capitol Hill this year. President Obama has asked members of Congress for “fast track” trade promotion authority in order to finalize proposed trade deals with Asia and Europe that set the stage for growing, trade-related job displacement. One of the president’s core, frequently repeated arguments for these trade and investment deals is that “our businesses export more than ever, and exporters tend to pay their workers higher wages.” But that’s less than half the story. Trade is a two-way street, and talking about exports without considering imports is like keeping score in a baseball game by counting only the runs scored by the home team. It might make you feel good, but it won’t tell you who’s winning the game. Sadly, when it comes to trade and wages, trade is driving down the average wages of American workers because the United States runs large trade deficits with the world as a whole, including many countries in Asia and Europe—the regions targeted in current trade negotiations.
A case in point is provided by U.S. trade with China, which was responsible for nearly half (46.5 percent) of our $736.8 billion goods trade deficit in 2014. Jobs in industries exporting to China did pay well in 2009-2011 (the last years for which we have complete wage data)—an average of $872.89 per week, or 10.3 percent more than workers making non-traded goods and services (who earned only $791.14 per week), as shown in the figure below. However, workers in import-competing industries were paid even better—an average of $1,021.66 per week, or 29.1 percent more than workers in non-traded industries.
Congress and President Obama Cannot Sit Idly By While Companies Use H-1B Guestworkers to Replace American Workers
A recent investigation by Computerworld revealed that hundreds of information technology (IT) workers were laid off by Southern California Edison (SCE) and replaced with temporary foreign workers through the H-1B guestworker visa program, which allows employers to hire temporary foreign workers for up to six years if they have at least a college degree (most work in IT). The replacement H-1B workers are employed by two India-based IT services firms that specialize in outsourcing and offshoring U.S. jobs: Infosys and Tata Consultancy Services. While U.S. Sen. Jeff Sessions (R-Ala.) and Rep. Darrell Issa (R-Calif.) have publicly criticized the move, it doesn’t look like any action will be taken to reverse it.
SCE describes itself as “one of the nation’s largest electric utilities…deliver[ing] power to more than 14 million people.” SCE earned net profits of $1.4 billion on $13.2 billion in revenues over the past year. The company’s stock price is up 10 percent over that time and it pays its investors a 4.8 percent yield in dividends. An observer could be forgiven for believing that a job delivering safe and reliable power to homes in the United States might be reasonably safe from being offshored to India or even outsourced to temporary foreign workers. But he or she would be mistaken. In fact, the SCE case is just one more example in a long line of cases in which American workers are being replaced by H-1B workers.
Adding to the injustice, American workers losing their jobs are being forced to do “knowledge transfers,” an ugly euphemism that means being forced to train your own foreign replacement.
Americans should be outraged that most of our politicians sit idly by while outsourcing firms hijack the nation’s temporary foreign worker programs. Unpublished H-1B data from United States Citizenship and Immigration Services reveals the scale of the problem: A majority of H-1B visas are now being used by firms that displace American workers and facilitate the offshoring of high-wage jobs.
The Unemployed Exceed Job Openings in Almost Every Industry
One of the recurring myths following the Great Recession has been that recovery in the labor market has lagged because workers don’t have the right skills. The figure below, which shows the number of unemployed workers and the number of job openings in December by industry, is a useful way to examine this idea. If today’s labor market woes were the result of skills shortages or mismatches, we would expect to see some sectors where there are more unemployed workers than job openings, and others where there are more job openings than unemployed workers. What we find, however, is that there are more unemployed workers than jobs openings in almost every industry.
The notable exception is health care and social assistance, which has been consistently adding jobs throughout the business cycle. There is now one unemployed worker for every job opening in that sector, suggesting a tighter labor market for those workers. However, we have yet to see any sign of decent wage gains yet, which would be the final indicator that the labor market, at least for those workers, were approaching reasonable health.
Other sectors have seen little-to-no improvement in their job-seekers-to-job-openings ratios. There are still about six unemployed construction workers for every job opening. In other words, despite claims from some employers, there is no shortage of construction workers.
Taken as a whole, these numbers demonstrate that the main problem in the labor market is a broad-based lack of demand for workers—not available workers lacking the skills needed for the sectors with job openings.
Unemployed and job openings, by industry (in millions)
| Industry | Unemployed | Job openings |
|---|---|---|
| Professional and business services | 1.0833 | 0.8846 |
| Health care and social assistance | 0.7053 | 0.7228 |
| Retail trade | 1.0993 | 0.4843 |
| Accommodation and food services | 0.9564 | 0.5871 |
| Government | 0.6781 | 0.4474 |
| Finance and insurance | 0.2590 | 0.2308 |
| Durable goods manufacturing | 0.4543 | 0.1803 |
| Other services | 0.3686 | 0.1476 |
| Wholesale trade | 0.1610 | 0.1525 |
| Transportation, warehousing, and utilities | 0.3565 | 0.1648 |
| Information | 0.1535 | 0.0992 |
| Construction | 0.7621 | 0.1273 |
| Nondurable goods manufacturing | 0.3002 | 0.1084 |
| Educational services | 0.2298 | 0.0793 |
| Real estate and rental and leasing | 0.1139 | 0.0569 |
| Arts, entertainment, and recreation | 0.2117 | 0.0698 |
| Mining and logging | 0.0524 | 0.0293 |

Note: Because the data are not seasonally adjusted, these are 12-month averages, January 2014–December 2014.
Source: EPI analysis of data from the Job Openings and Labor Turnover Survey and the Current Population Survey
Layoffs and Quits Hold Steady in December
The hires, quits, and layoffs rates all held fairly steady in the December Job Openings and Labor Turnover Survey (JOLTS). As you can see in the figure below, layoffs shot up during the recession but recovered quickly and have been at prerecession levels for more than three years. The fact that this trend continued in December is a good sign. That said, not only do layoffs need to come down before we see a full recovery in the labor market, but hiring needs to pick up. While the hires rate has been generally improving, it’s still below its prerecession level.
The voluntary quits rate had been flat since February (1.8 percent), and saw a modest spike up in September to 2.0 percent, before falling to 1.9 percent in October and holding steady through December. A larger number of people voluntarily quitting their jobs indicates a strong labor market—one where workers are able to leave jobs that are not right for them and find new ones. In December, the quits rate was still 9.2 percent lower than it was in 2007, before the recession began.
Over the year, the quits rate has averaged 1.8 percent, an improvement over its average rate of 1.4 percent in 2009 and 2010. Each consecutive year has seen modest improvement, an average increase in the quits rate of 0.1 percentage points per year. Before long, we should look for a return to pre-recession levels of voluntary quits, which would mean that fewer workers are locked into jobs they would leave if they could.
Hires, quits, and layoff rates, December 2000–December 2014
| Month | Hires rate | Layoffs rate | Quits rate |
|---|---|---|---|
| Dec-2000 | 4.1% | 1.4% | 2.3% |
| Jan-2001 | 4.4% | 1.6% | 2.6% |
| Feb-2001 | 4.1% | 1.4% | 2.5% |
| Mar-2001 | 4.2% | 1.6% | 2.4% |
| Apr-2001 | 4.0% | 1.5% | 2.4% |
| May-2001 | 4.0% | 1.5% | 2.4% |
| Jun-2001 | 3.8% | 1.5% | 2.3% |
| Jul-2001 | 3.9% | 1.5% | 2.2% |
| Aug-2001 | 3.8% | 1.4% | 2.1% |
| Sep-2001 | 3.8% | 1.6% | 2.1% |
| Oct-2001 | 3.8% | 1.7% | 2.2% |
| Nov-2001 | 3.7% | 1.6% | 2.0% |
| Dec-2001 | 3.7% | 1.4% | 2.0% |
| Jan-2002 | 3.7% | 1.4% | 2.2% |
| Feb-2002 | 3.7% | 1.5% | 2.0% |
| Mar-2002 | 3.5% | 1.4% | 1.9% |
| Apr-2002 | 3.8% | 1.5% | 2.1% |
| May-2002 | 3.8% | 1.5% | 2.1% |
| Jun-2002 | 3.7% | 1.4% | 2.0% |
| Jul-2002 | 3.8% | 1.5% | 2.1% |
| Aug-2002 | 3.7% | 1.4% | 2.0% |
| Sep-2002 | 3.7% | 1.4% | 2.0% |
| Oct-2002 | 3.7% | 1.4% | 2.0% |
| Nov-2002 | 3.8% | 1.5% | 1.9% |
| Dec-2002 | 3.8% | 1.5% | 2.0% |
| Jan-2003 | 3.8% | 1.5% | 1.9% |
| Feb-2003 | 3.6% | 1.5% | 1.9% |
| Mar-2003 | 3.4% | 1.4% | 1.9% |
| Apr-2003 | 3.6% | 1.6% | 1.8% |
| May-2003 | 3.5% | 1.5% | 1.8% |
| Jun-2003 | 3.7% | 1.6% | 1.8% |
| Jul-2003 | 3.6% | 1.6% | 1.8% |
| Aug-2003 | 3.6% | 1.5% | 1.8% |
| Sep-2003 | 3.7% | 1.5% | 1.9% |
| Oct-2003 | 3.8% | 1.4% | 1.9% |
| Nov-2003 | 3.6% | 1.4% | 1.9% |
| Dec-2003 | 3.8% | 1.5% | 1.9% |
| Jan-2004 | 3.7% | 1.5% | 1.9% |
| Feb-2004 | 3.6% | 1.4% | 1.9% |
| Mar-2004 | 3.9% | 1.4% | 2.0% |
| Apr-2004 | 3.9% | 1.5% | 2.0% |
| May-2004 | 3.8% | 1.4% | 1.9% |
| Jun-2004 | 3.8% | 1.4% | 2.0% |
| Jul-2004 | 3.7% | 1.4% | 2.0% |
| Aug-2004 | 3.9% | 1.5% | 2.0% |
| Sep-2004 | 3.8% | 1.4% | 2.0% |
| Oct-2004 | 3.9% | 1.4% | 2.0% |
| Nov-2004 | 3.9% | 1.5% | 2.1% |
| Dec-2004 | 4.0% | 1.5% | 2.1% |
| Jan-2005 | 3.9% | 1.4% | 2.1% |
| Feb-2005 | 3.9% | 1.4% | 2.0% |
| Mar-2005 | 3.9% | 1.5% | 2.1% |
| Apr-2005 | 4.0% | 1.4% | 2.1% |
| May-2005 | 3.9% | 1.4% | 2.1% |
| Jun-2005 | 3.9% | 1.5% | 2.1% |
| Jul-2005 | 3.9% | 1.4% | 2.0% |
| Aug-2005 | 4.0% | 1.4% | 2.2% |
| Sep-2005 | 4.0% | 1.4% | 2.3% |
| Oct-2005 | 3.8% | 1.3% | 2.2% |
| Nov-2005 | 3.9% | 1.2% | 2.2% |
| Dec-2005 | 3.7% | 1.3% | 2.1% |
| Jan-2006 | 3.9% | 1.3% | 2.1% |
| Feb-2006 | 3.9% | 1.3% | 2.2% |
| Mar-2006 | 3.9% | 1.2% | 2.2% |
| Apr-2006 | 3.8% | 1.3% | 2.1% |
| May-2006 | 4.0% | 1.4% | 2.2% |
| Jun-2006 | 3.9% | 1.2% | 2.2% |
| Jul-2006 | 3.9% | 1.3% | 2.2% |
| Aug-2006 | 3.8% | 1.2% | 2.2% |
| Sep-2006 | 3.8% | 1.3% | 2.1% |
| Oct-2006 | 3.8% | 1.3% | 2.1% |
| Nov-2006 | 4.0% | 1.3% | 2.3% |
| Dec-2006 | 3.8% | 1.3% | 2.2% |
| Jan-2007 | 3.8% | 1.2% | 2.2% |
| Feb-2007 | 3.8% | 1.3% | 2.2% |
| Mar-2007 | 3.8% | 1.3% | 2.2% |
| Apr-2007 | 3.7% | 1.3% | 2.1% |
| May-2007 | 3.8% | 1.3% | 2.2% |
| Jun-2007 | 3.8% | 1.3% | 2.0% |
| Jul-2007 | 3.7% | 1.3% | 2.1% |
| Aug-2007 | 3.7% | 1.3% | 2.1% |
| Sep-2007 | 3.7% | 1.5% | 1.9% |
| Oct-2007 | 3.8% | 1.4% | 2.1% |
| Nov-2007 | 3.7% | 1.4% | 2.0% |
| Dec-2007 | 3.6% | 1.3% | 2.0% |
| Jan-2008 | 3.5% | 1.3% | 2.0% |
| Feb-2008 | 3.5% | 1.4% | 2.0% |
| Mar-2008 | 3.4% | 1.3% | 1.9% |
| Apr-2008 | 3.5% | 1.3% | 2.1% |
| May-2008 | 3.3% | 1.3% | 1.9% |
| Jun-2008 | 3.5% | 1.5% | 1.9% |
| Jul-2008 | 3.3% | 1.4% | 1.8% |
| Aug-2008 | 3.3% | 1.6% | 1.7% |
| Sep-2008 | 3.1% | 1.4% | 1.8% |
| Oct-2008 | 3.3% | 1.6% | 1.8% |
| Nov-2008 | 2.9% | 1.6% | 1.5% |
| Dec-2008 | 3.2% | 1.8% | 1.6% |
| Jan-2009 | 3.1% | 1.9% | 1.5% |
| Feb-2009 | 3.0% | 1.9% | 1.5% |
| Mar-2009 | 2.8% | 1.8% | 1.4% |
| Apr-2009 | 2.9% | 2.0% | 1.3% |
| May-2009 | 2.8% | 1.6% | 1.3% |
| Jun-2009 | 2.8% | 1.6% | 1.3% |
| Jul-2009 | 2.9% | 1.7% | 1.3% |
| Aug-2009 | 2.9% | 1.6% | 1.3% |
| Sep-2009 | 3.0% | 1.6% | 1.3% |
| Oct-2009 | 2.9% | 1.5% | 1.3% |
| Nov-2009 | 3.1% | 1.4% | 1.4% |
| Dec-2009 | 2.9% | 1.5% | 1.3% |
| Jan-2010 | 3.0% | 1.4% | 1.3% |
| Feb-2010 | 2.9% | 1.4% | 1.3% |
| Mar-2010 | 3.2% | 1.4% | 1.4% |
| Apr-2010 | 3.1% | 1.3% | 1.5% |
| May-2010 | 3.4% | 1.3% | 1.4% |
| Jun-2010 | 3.1% | 1.5% | 1.5% |
| Jul-2010 | 3.2% | 1.6% | 1.4% |
| Aug-2010 | 3.0% | 1.4% | 1.4% |
| Sep-2010 | 3.1% | 1.4% | 1.4% |
| Oct-2010 | 3.1% | 1.3% | 1.4% |
| Nov-2010 | 3.2% | 1.4% | 1.4% |
| Dec-2010 | 3.2% | 1.4% | 1.5% |
| Jan-2011 | 3.0% | 1.3% | 1.4% |
| Feb-2011 | 3.1% | 1.3% | 1.4% |
| Mar-2011 | 3.2% | 1.3% | 1.5% |
| Apr-2011 | 3.2% | 1.3% | 1.5% |
| May-2011 | 3.1% | 1.3% | 1.5% |
| Jun-2011 | 3.3% | 1.4% | 1.5% |
| Jul-2011 | 3.1% | 1.3% | 1.5% |
| Aug-2011 | 3.2% | 1.3% | 1.5% |
| Sep-2011 | 3.3% | 1.3% | 1.5% |
| Oct-2011 | 3.2% | 1.3% | 1.5% |
| Nov-2011 | 3.2% | 1.3% | 1.5% |
| Dec-2011 | 3.2% | 1.3% | 1.5% |
| Jan-2012 | 3.2% | 1.2% | 1.5% |
| Feb-2012 | 3.3% | 1.3% | 1.6% |
| Mar-2012 | 3.3% | 1.2% | 1.6% |
| Apr-2012 | 3.2% | 1.4% | 1.6% |
| May-2012 | 3.3% | 1.4% | 1.6% |
| Jun-2012 | 3.2% | 1.3% | 1.6% |
| Jul-2012 | 3.2% | 1.2% | 1.6% |
| Aug-2012 | 3.3% | 1.4% | 1.6% |
| Sep-2012 | 3.1% | 1.3% | 1.4% |
| Oct-2012 | 3.2% | 1.3% | 1.5% |
| Nov-2012 | 3.3% | 1.3% | 1.6% |
| Dec-2012 | 3.2% | 1.2% | 1.6% |
| Jan-2013 | 3.2% | 1.2% | 1.7% |
| Feb-2013 | 3.4% | 1.2% | 1.7% |
| Mar-2013 | 3.2% | 1.3% | 1.6% |
| Apr-2013 | 3.3% | 1.3% | 1.6% |
| May-2013 | 3.3% | 1.3% | 1.6% |
| Jun-2013 | 3.2% | 1.2% | 1.6% |
| Jul-2013 | 3.3% | 1.2% | 1.7% |
| Aug-2013 | 3.4% | 1.2% | 1.7% |
| Sep-2013 | 3.4% | 1.3% | 1.7% |
| Oct-2013 | 3.3% | 1.1% | 1.8% |
| Nov-2013 | 3.3% | 1.1% | 1.8% |
| Dec-2013 | 3.3% | 1.2% | 1.8% |
| Jan-2014 | 3.3% | 1.2% | 1.7% |
| Feb-2014 | 3.4% | 1.2% | 1.8% |
| Mar-2014 | 3.4% | 1.2% | 1.8% |
| Apr-2014 | 3.5% | 1.2% | 1.8% |
| May-2014 | 3.4% | 1.2% | 1.8% |
| Jun-2014 | 3.5% | 1.2% | 1.8% |
| Jul-2014 | 3.6% | 1.2% | 1.8% |
| Aug-2014 | 3.4% | 1.2% | 1.8% |
| Sep-2014 | 3.6% | 1.2% | 2.0% |
| Oct-2014 | 3.7% | 1.3% | 1.9% |
| Nov-2014 | 3.6% | 1.2% | 1.9% |
| Dec-2014 | 3.7% | 1.2% | 1.9% |
Note: Shaded areas denote recessions. The hires rate is the number of hires during the entire month as a percent of total employment. The layoff rate is the number of layoffs and discharges during the entire month as a percent of total employment. The quits rate is the number of quits during the entire month as a percent of total employment.
Source: EPI analysis of Bureau of Labor Statistics Job Openings and Labor Turnover Survey
Job Openings Were Stronger in 2014 than 2013 or 2012, but We Have Still Not Fully Recovered
The number of job openings hit 5.0 million in December, according to this morning’s Job Openings and Labor Turnover Summary (JOLTS)—a slight increase from 4.8 million in November. Meanwhile, according to the Census’s Current Population Survey, there was a slight drop in people looking for work, to 8.7 million. Taken together, this means there were 1.7 times as many job seekers as job openings in December—the lowest this ratio has been since November 2007.
This slight decline in the jobs-seekers-to-job-openings ratio is a continuation of its steady decrease, since its high of 6.8-to-1 in July 2009, as you can see in the figure below. If the economy were stronger, the ratio would be even smaller—a 1-to-1 ratio would mean that there were roughly as many job openings as job seekers—but this indicates that we are moving in the right direction.
With the December data, we can also look at what’s happened throughout 2014, compared to the rest of the recovery. The job-seekers-to-jobs-openings ratio has been consistently falling, from a high of 5.9 percent in 2009 down to an average of 2.1 percent average in 2014. The average annual ratio fell 0.8 over the last year.
While the outlook for jobless workers is clearly improving, the job-seekers-to-jobs-openings ratio fails to account for the full extent of declines in labor force participation over the course of the recovery. 8.7 million unemployed workers understates how many job openings will be needed when a robust jobs recovery finally begins, due to the 6.1 million potential workers (in December) who are currently not in the labor market, but who would be if job opportunities were strong. Many of these “missing workers” will go back to looking for a job when the labor market picks up, so job openings will be needed for them, too.
The job-seekers ratio, December 2000–December 2014
| Month | Unemployed job seekers per job opening |
|---|---|
| Dec-2000 | 1.1 |
| Jan-2001 | 1.1 |
| Feb-2001 | 1.3 |
| Mar-2001 | 1.3 |
| Apr-2001 | 1.3 |
| May-2001 | 1.4 |
| Jun-2001 | 1.5 |
| Jul-2001 | 1.5 |
| Aug-2001 | 1.7 |
| Sep-2001 | 1.8 |
| Oct-2001 | 2.1 |
| Nov-2001 | 2.3 |
| Dec-2001 | 2.3 |
| Jan-2002 | 2.3 |
| Feb-2002 | 2.4 |
| Mar-2002 | 2.3 |
| Apr-2002 | 2.6 |
| May-2002 | 2.4 |
| Jun-2002 | 2.5 |
| Jul-2002 | 2.5 |
| Aug-2002 | 2.4 |
| Sep-2002 | 2.5 |
| Oct-2002 | 2.4 |
| Nov-2002 | 2.4 |
| Dec-2002 | 2.8 |
| Jan-2003 | 2.3 |
| Feb-2003 | 2.5 |
| Mar-2003 | 2.8 |
| Apr-2003 | 2.8 |
| May-2003 | 2.8 |
| Jun-2003 | 2.8 |
| Jul-2003 | 2.8 |
| Aug-2003 | 2.7 |
| Sep-2003 | 2.9 |
| Oct-2003 | 2.7 |
| Nov-2003 | 2.6 |
| Dec-2003 | 2.5 |
| Jan-2004 | 2.5 |
| Feb-2004 | 2.4 |
| Mar-2004 | 2.5 |
| Apr-2004 | 2.4 |
| May-2004 | 2.2 |
| Jun-2004 | 2.4 |
| Jul-2004 | 2.1 |
| Aug-2004 | 2.2 |
| Sep-2004 | 2.1 |
| Oct-2004 | 2.1 |
| Nov-2004 | 2.3 |
| Dec-2004 | 2.1 |
| Jan-2005 | 2.2 |
| Feb-2005 | 2.1 |
| Mar-2005 | 2.0 |
| Apr-2005 | 1.9 |
| May-2005 | 2.0 |
| Jun-2005 | 1.9 |
| Jul-2005 | 1.8 |
| Aug-2005 | 1.8 |
| Sep-2005 | 1.8 |
| Oct-2005 | 1.8 |
| Nov-2005 | 1.7 |
| Dec-2005 | 1.7 |
| Jan-2006 | 1.7 |
| Feb-2006 | 1.7 |
| Mar-2006 | 1.6 |
| Apr-2006 | 1.6 |
| May-2006 | 1.6 |
| Jun-2006 | 1.6 |
| Jul-2006 | 1.8 |
| Aug-2006 | 1.6 |
| Sep-2006 | 1.5 |
| Oct-2006 | 1.5 |
| Nov-2006 | 1.5 |
| Dec-2006 | 1.5 |
| Jan-2007 | 1.6 |
| Feb-2007 | 1.5 |
| Mar-2007 | 1.4 |
| Apr-2007 | 1.5 |
| May-2007 | 1.5 |
| Jun-2007 | 1.5 |
| Jul-2007 | 1.6 |
| Aug-2007 | 1.6 |
| Sep-2007 | 1.6 |
| Oct-2007 | 1.7 |
| Nov-2007 | 1.7 |
| Dec-2007 | 1.8 |
| Jan-2008 | 1.8 |
| Feb-2008 | 1.9 |
| Mar-2008 | 1.9 |
| Apr-2008 | 2.0 |
| May-2008 | 2.1 |
| Jun-2008 | 2.3 |
| Jul-2008 | 2.4 |
| Aug-2008 | 2.6 |
| Sep-2008 | 3.0 |
| Oct-2008 | 3.1 |
| Nov-2008 | 3.4 |
| Dec-2008 | 3.7 |
| Jan-2009 | 4.4 |
| Feb-2009 | 4.6 |
| Mar-2009 | 5.4 |
| Apr-2009 | 6.1 |
| May-2009 | 6.0 |
| Jun-2009 | 6.2 |
| Jul-2009 | 6.8 |
| Aug-2009 | 6.5 |
| Sep-2009 | 6.2 |
| Oct-2009 | 6.5 |
| Nov-2009 | 6.3 |
| Dec-2009 | 6.1 |
| Jan-2010 | 5.5 |
| Feb-2010 | 6.0 |
| Mar-2010 | 5.8 |
| Apr-2010 | 5.0 |
| May-2010 | 5.1 |
| Jun-2010 | 5.3 |
| Jul-2010 | 5.0 |
| Aug-2010 | 5.0 |
| Sep-2010 | 5.2 |
| Oct-2010 | 4.8 |
| Nov-2010 | 4.9 |
| Dec-2010 | 5.0 |
| Jan-2011 | 4.8 |
| Feb-2011 | 4.6 |
| Mar-2011 | 4.4 |
| Apr-2011 | 4.5 |
| May-2011 | 4.5 |
| Jun-2011 | 4.3 |
| Jul-2011 | 4.0 |
| Aug-2011 | 4.3 |
| Sep-2011 | 3.9 |
| Oct-2011 | 4.0 |
| Nov-2011 | 4.2 |
| Dec-2011 | 3.7 |
| Jan-2012 | 3.5 |
| Feb-2012 | 3.7 |
| Mar-2012 | 3.3 |
| Apr-2012 | 3.5 |
| May-2012 | 3.4 |
| Jun-2012 | 3.3 |
| Jul-2012 | 3.5 |
| Aug-2012 | 3.4 |
| Sep-2012 | 3.4 |
| Oct-2012 | 3.2 |
| Nov-2012 | 3.2 |
| Dec-2012 | 3.4 |
| Jan-2013 | 3.3 |
| Feb-2013 | 3.0 |
| Mar-2013 | 3.0 |
| Apr-2013 | 3.1 |
| May-2013 | 3.0 |
| Jun-2013 | 3.0 |
| Jul-2013 | 3.0 |
| Aug-2013 | 2.9 |
| Sep-2013 | 2.8 |
| Oct-2013 | 2.8 |
| Nov-2013 | 2.6 |
| Dec-2013 | 2.6 |
| Jan-2014 | 2.6 |
| Feb-2014 | 2.5 |
| Mar-2014 | 2.5 |
| Apr-2014 | 2.2 |
| May-2014 | 2.1 |
| Jun-2014 | 2.0 |
| Jul-2014 | 2.1 |
| Aug-2014 | 2.0 |
| Sep-2014 | 2.0 |
| Oct-2014 | 1.9 |
| Nov-2014 | 1.9 |
| Dec-2014 | 1.7 |
Note: Shaded areas denote recessions.
Source: EPI analysis of Bureau of Labor Statistics Job Openings and Labor Turnover Survey and Current Population Survey
Increasing Labor Force Participation Leads to Fewer Missing Workers
The official unemployment rate ticked up slightly last month as more potential workers entered the labor force. While is it a positive sign that more people are actively looking for work, the unemployment rate still understates the weakness of job opportunities. This is due to the existence of a large pool of “missing workers”—potential workers who, because of weak job opportunities, are neither employed nor actively seeking a job. In other words, these are people who would be either working or looking for work if job opportunities were significantly stronger.
The number of missing workers has been hovering around 6 million for over a year. They fell slightly in January, which could be the start of a positive trend. As the economy gets stronger, I would expect more people to start looking for work. At this point, the fact remains that there are still 5.8 million missing workers. And, if the missing workers were actively looking for work, the unemployment rate would be 9.0 percent.
Millions of potential workers sidelined: Missing workers,* January 2006–January 2015
| Date | Missing workers |
|---|---|
| 2006-01-01 | 530,000 |
| 2006-02-01 | 110,000 |
| 2006-03-01 | 110,000 |
| 2006-04-01 | 250,000 |
| 2006-05-01 | 210,000 |
| 2006-06-01 | 110,000 |
| 2006-07-01 | 60,000 |
| 2006-08-01 | -120,000 |
| 2006-09-01 | 120,000 |
| 2006-10-01 | -50,000 |
| 2006-11-01 | -220,000 |
| 2006-12-01 | -500,000 |
| 2007-01-01 | -460,000 |
| 2007-02-01 | -210,000 |
| 2007-03-01 | -150,000 |
| 2007-04-01 | 650,000 |
| 2007-05-01 | 560,000 |
| 2007-06-01 | 360,000 |
| 2007-07-01 | 370,000 |
| 2007-08-01 | 840,000 |
| 2007-09-01 | 410,000 |
| 2007-10-01 | 800,000 |
| 2007-11-01 | 280,000 |
| 2007-12-01 | 250,000 |
| 2008-01-01 | -320,000 |
| 2008-02-01 | 220,000 |
| 2008-03-01 | 50,000 |
| 2008-04-01 | 340,000 |
| 2008-05-01 | -60,000 |
| 2008-06-01 | 20,000 |
| 2008-07-01 | -70,000 |
| 2008-08-01 | -90,000 |
| 2008-09-01 | 180,000 |
| 2008-10-01 | 60,000 |
| 2008-11-01 | 420,000 |
| 2008-12-01 | 420,000 |
| 2009-01-01 | 710,000 |
| 2009-02-01 | 620,000 |
| 2009-03-01 | 1,050,000 |
| 2009-04-01 | 750,000 |
| 2009-05-01 | 650,000 |
| 2009-06-01 | 650,000 |
| 2009-07-01 | 1,040,000 |
| 2009-08-01 | 1,320,000 |
| 2009-09-01 | 2,050,000 |
| 2009-10-01 | 2,270,000 |
| 2009-11-01 | 2,300,000 |
| 2009-12-01 | 3,120,000 |
| 2010-01-01 | 2,770,000 |
| 2010-02-01 | 2,690,000 |
| 2010-03-01 | 2,440,000 |
| 2010-04-01 | 1,940,000 |
| 2010-05-01 | 2,530,000 |
| 2010-06-01 | 2,950,000 |
| 2010-07-01 | 3,220,000 |
| 2010-08-01 | 2,830,000 |
| 2010-09-01 | 3,200,000 |
| 2010-10-01 | 3,640,000 |
| 2010-11-01 | 3,310,000 |
| 2010-12-01 | 3,800,000 |
| 2011-01-01 | 3,910,000 |
| 2011-02-01 | 4,110,000 |
| 2011-03-01 | 3,960,000 |
| 2011-04-01 | 4,000,000 |
| 2011-05-01 | 4,110,000 |
| 2011-06-01 | 4,220,000 |
| 2011-07-01 | 4,640,000 |
| 2011-08-01 | 4,100,000 |
| 2011-09-01 | 3,990,000 |
| 2011-10-01 | 4,090,000 |
| 2011-11-01 | 4,090,000 |
| 2011-12-01 | 4,150,000 |
| 2012-01-01 | 4,450,000 |
| 2012-02-01 | 4,180,000 |
| 2012-03-01 | 4,240,000 |
| 2012-04-01 | 4,630,000 |
| 2012-05-01 | 4,240,000 |
| 2012-06-01 | 4,060,000 |
| 2012-07-01 | 4,520,000 |
| 2012-08-01 | 4,630,000 |
| 2012-09-01 | 4,500,000 |
| 2012-10-01 | 3,930,000 |
| 2012-11-01 | 4,370,000 |
| 2012-12-01 | 4,070,000 |
| 2013-01-01 | 4,350,000 |
| 2013-02-01 | 4,790,000 |
| 2013-03-01 | 5,310,000 |
| 2013-04-01 | 5,060,000 |
| 2013-05-01 | 4,840,000 |
| 2013-06-01 | 4,700,000 |
| 2013-07-01 | 5,030,000 |
| 2013-08-01 | 5,150,000 |
| 2013-09-01 | 5,370,000 |
| 2013-10-01 | 6,120,000 |
| 2013-11-01 | 5,700,000 |
| 2013-12-01 | 5,950,000 |
| 2014-01-01 | 5,850,000 |
| 2014-02-01 | 5,650,000 |
| 2014-03-01 | 5,330,000 |
| 2014-04-01 | 6,210,000 |
| 2014-05-01 | 5,940,000 |
| 2014-06-01 | 5,950,000 |
| 2014-07-01 | 5,810,000 |
| 2014-08-01 | 5,890,000 |
| 2014-09-01 | 6,250,000 |
| 2014-10-01 | 5,720,000 |
| 2014-11-01 | 5,760,000 |
| 2014-12-01 | 6,100,000 |
| 2015-01-01 | 5,760,000 |
* Potential workers who, due to weak job opportunities, are neither employed nor actively seeking work
Note: Volatility in the number of missing workers in 2006–2008, including cases of negative numbers of missing workers, is simply the result of month-to-month variability in the sample. The Great Recession–induced pool of missing workers began to form and grow starting in late 2008.
Source: EPI analysis of Mitra Toossi, “Labor Force Projections to 2016: More Workers in Their Golden Years,” Bureau of Labor Statistics Monthly Labor Review, November 2007; and Current Population Survey public data series
Similarly, we saw a tick up in the employment-to-population ratio for prime-working-age population in January, following a trend that has been slowly moving in the right direction for years. That said, it’s clear that there is a long way to go before we return to pre-recession labor market health.
Employment-to-population ratio of workers ages 25–54, 2006–2015
| Month | Employment to population ratio |
|---|---|
| 2006-01-01 | 79.6% |
| 2006-02-01 | 79.7% |
| 2006-03-01 | 79.8% |
| 2006-04-01 | 79.6% |
| 2006-05-01 | 79.7% |
| 2006-06-01 | 79.8% |
| 2006-07-01 | 79.8% |
| 2006-08-01 | 79.8% |
| 2006-09-01 | 79.9% |
| 2006-10-01 | 80.1% |
| 2006-11-01 | 80.0% |
| 2006-12-01 | 80.1% |
| 2007-01-01 | 80.3% |
| 2007-02-01 | 80.1% |
| 2007-03-01 | 80.2% |
| 2007-04-01 | 80.0% |
| 2007-05-01 | 80.0% |
| 2007-06-01 | 79.9% |
| 2007-07-01 | 79.8% |
| 2007-08-01 | 79.8% |
| 2007-09-01 | 79.7% |
| 2007-10-01 | 79.6% |
| 2007-11-01 | 79.7% |
| 2007-12-01 | 79.7% |
| 2008-01-01 | 80.0% |
| 2008-02-01 | 79.9% |
| 2008-03-01 | 79.8% |
| 2008-04-01 | 79.6% |
| 2008-05-01 | 79.5% |
| 2008-06-01 | 79.4% |
| 2008-07-01 | 79.2% |
| 2008-08-01 | 78.8% |
| 2008-09-01 | 78.8% |
| 2008-10-01 | 78.4% |
| 2008-11-01 | 78.1% |
| 2008-12-01 | 77.6% |
| 2009-01-01 | 77.0% |
| 2009-02-01 | 76.7% |
| 2009-03-01 | 76.2% |
| 2009-04-01 | 76.2% |
| 2009-05-01 | 75.9% |
| 2009-06-01 | 75.9% |
| 2009-07-01 | 75.8% |
| 2009-08-01 | 75.6% |
| 2009-09-01 | 75.1% |
| 2009-10-01 | 75.0% |
| 2009-11-01 | 75.2% |
| 2009-12-01 | 74.8% |
| 2010-01-01 | 75.1% |
| 2010-02-01 | 75.1% |
| 2010-03-01 | 75.1% |
| 2010-04-01 | 75.4% |
| 2010-05-01 | 75.1% |
| 2010-06-01 | 75.2% |
| 2010-07-01 | 75.1% |
| 2010-08-01 | 75.0% |
| 2010-09-01 | 75.1% |
| 2010-10-01 | 75.0% |
| 2010-11-01 | 74.8% |
| 2010-12-01 | 75.0% |
| 2011-01-01 | 75.2% |
| 2011-02-01 | 75.1% |
| 2011-03-01 | 75.3% |
| 2011-04-01 | 75.1% |
| 2011-05-01 | 75.2% |
| 2011-06-01 | 75.0% |
| 2011-07-01 | 75.0% |
| 2011-08-01 | 75.1% |
| 2011-09-01 | 74.9% |
| 2011-10-01 | 74.9% |
| 2011-11-01 | 75.3% |
| 2011-12-01 | 75.4% |
| 2012-01-01 | 75.6% |
| 2012-02-01 | 75.6% |
| 2012-03-01 | 75.7% |
| 2012-04-01 | 75.7% |
| 2012-05-01 | 75.7% |
| 2012-06-01 | 75.7% |
| 2012-07-01 | 75.6% |
| 2012-08-01 | 75.7% |
| 2012-09-01 | 75.9% |
| 2012-10-01 | 76.0% |
| 2012-11-01 | 75.8% |
| 2012-12-01 | 75.9% |
| 2013-01-01 | 75.7% |
| 2013-02-01 | 75.9% |
| 2013-03-01 | 75.9% |
| 2013-04-01 | 75.9% |
| 2013-05-01 | 76.0% |
| 2013-06-01 | 75.9% |
| 2013-07-01 | 76.0% |
| 2013-08-01 | 75.9% |
| 2013-09-01 | 75.9% |
| 2013-10-01 | 75.5% |
| 2013-11-01 | 76.0% |
| 2013-12-01 | 76.1% |
| 2014-01-01 | 76.5% |
| 2014-02-01 | 76.5% |
| 2014-03-01 | 76.6% |
| 2014-04-01 | 76.5% |
| 2014-05-01 | 76.4% |
| 2014-06-01 | 76.8% |
| 2014-07-01 | 76.6% |
| 2014-08-01 | 76.8% |
| 2014-09-01 | 76.8% |
| 2014-10-01 | 76.9% |
| 2014-11-01 | 76.9% |
| 2014-12-01 | 77.0% |
| 2015-01-01 | 77.2% |
Source: EPI analysis of Bureau of Labor Statistics' Current Population Survey public data series.
Much Stronger Job Growth is Needed If We’re Going to See a Healthy Economy Any Time Soon
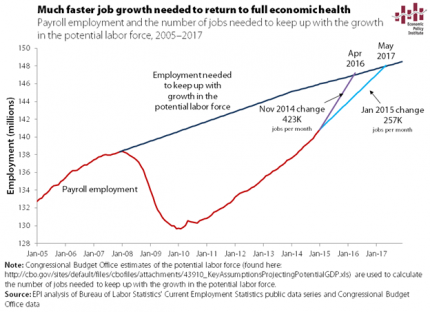
Today’s job report is a solid start to the new year, and could be a sign that the economy has shifted into a slightly higher gear. At 257,000 jobs a month, we would get to pre-recession labor market health by May 2017 (as shown in the figure below).
The BLS revisions to 2014 payroll employment suggest moderately faster growth than initially reported last year, particularly in the last quarter of 2014. If we were to use the highest rate of growth last year—November’s 423,000 jobs added—in each ensuing month, we would return to 2007 labor market health by April 2016, over a year sooner.
There is no reason to expect a much faster growth rate of jobs, but stronger numbers on jobs will hopefully translate into decent wage growth sometime in the foreseeable future. It’s not there yet, but we can only hope.
Nominal Wage Growth Still Far Below Target
This morning’s jobs report showed the economy added 257,000 jobs in January, and the numbers for December and November were revised upward. But even with the positive revisions to 2014 and the solid jobs growth last month, there’s clearly still tremendous slack in the labor market, as evidenced by lagging nominal wage growth. While January’s 0.5 percent jump in wages is a good sign, it’s important not to read too much into any one month, as there’s considerable volatility in the series. Over the year, nominal average hourly earnings have only grown 2.2 percent. From the figure below, it is clear the nominal wage growth has been hovering around 2 percent for the last five years.
It is also apparent from the figure that nominal wages have grown far slower than any reasonable wage target. The fact is that the economy is not growing enough for workers to feel the effects in their paychecks and not enough for the Federal Reserve to slow the economy down out of fear of upcoming inflationary pressure. If the Fed acts too soon, it will slow labor share’s recovery and come at a cost to Americans’ living standards. It is imperative that the Fed keep their foot off the brake for as long as it takes to see modest (if not strong) wage growth for America’s workers.
Nominal wage growth has been far below target in the recovery: Year-over-year change in private-sector nominal average hourly earnings, 2007–2015
| All nonfarm employees | Production/nonsupervisory workers | |
|---|---|---|
| Mar-2007 | 3.6427146% | 4.1112455% |
| Apr-2007 | 3.3234127% | 3.8461538% |
| May-2007 | 3.7257824% | 4.1441441% |
| Jun-2007 | 3.8575668% | 4.1267943% |
| Jul-2007 | 3.4482759% | 4.0524434% |
| Aug-2007 | 3.5433071% | 4.0404040% |
| Sep-2007 | 3.2337090% | 4.1493776% |
| Oct-2007 | 3.2778865% | 3.7780401% |
| Nov-2007 | 3.3203125% | 3.8869258% |
| Dec-2007 | 3.1113272% | 3.8123167% |
| Jan-2008 | 3.1067961% | 3.8619075% |
| Feb-2008 | 3.0464217% | 3.7296037% |
| Mar-2008 | 3.0332210% | 3.7746806% |
| Apr-2008 | 2.8324532% | 3.7037037% |
| May-2008 | 3.0172414% | 3.6908881% |
| Jun-2008 | 2.6666667% | 3.6186100% |
| Jul-2008 | 3.0000000% | 3.7227950% |
| Aug-2008 | 3.2794677% | 3.8263849% |
| Sep-2008 | 3.2747983% | 3.6425726% |
| Oct-2008 | 3.3159640% | 3.9249147% |
| Nov-2008 | 3.5916824% | 3.8548753% |
| Dec-2008 | 3.6303630% | 3.8418079% |
| Jan-2009 | 3.5310734% | 3.7183099% |
| Feb-2009 | 3.4725481% | 3.6516854% |
| Mar-2009 | 3.1775701% | 3.5254617% |
| Apr-2009 | 3.2212885% | 3.2924107% |
| May-2009 | 2.8358903% | 3.0589544% |
| Jun-2009 | 2.7365492% | 2.9379157% |
| Jul-2009 | 2.5889968% | 2.7056875% |
| Aug-2009 | 2.4390244% | 2.6402640% |
| Sep-2009 | 2.2977941% | 2.7457441% |
| Oct-2009 | 2.3383769% | 2.6272578% |
| Nov-2009 | 2.0529197% | 2.6746725% |
| Dec-2009 | 1.8198362% | 2.5027203% |
| Jan-2010 | 1.9554343% | 2.6072787% |
| Feb-2010 | 1.8140590% | 2.4932249% |
| Mar-2010 | 1.7663043% | 2.2702703% |
| Apr-2010 | 1.7639077% | 2.4311183% |
| May-2010 | 1.8987342% | 2.5903940% |
| Jun-2010 | 1.7607223% | 2.4771136% |
| Jul-2010 | 1.8476791% | 2.4731183% |
| Aug-2010 | 1.7070979% | 2.4115756% |
| Sep-2010 | 1.8867925% | 2.2447889% |
| Oct-2010 | 1.8817204% | 2.5066667% |
| Nov-2010 | 1.6540009% | 2.1796917% |
| Dec-2010 | 1.7426273% | 2.0169851% |
| Jan-2011 | 1.9625335% | 2.2233986% |
| Feb-2011 | 1.8262806% | 2.1152829% |
| Mar-2011 | 1.8246551% | 2.1141649% |
| Apr-2011 | 1.9111111% | 2.1097046% |
| May-2011 | 2.0408163% | 2.1041557% |
| Jun-2011 | 2.1295475% | 2.0493957% |
| Jul-2011 | 2.2566372% | 2.2560336% |
| Aug-2011 | 1.9434629% | 1.9884877% |
| Sep-2011 | 1.9400353% | 1.9864088% |
| Oct-2011 | 2.1108179% | 1.7169615% |
| Nov-2011 | 2.0228672% | 1.8210198% |
| Dec-2011 | 1.9762846% | 1.8210198% |
| Jan-2012 | 1.7060367% | 1.3982393% |
| Feb-2012 | 1.9247594% | 1.5018125% |
| Mar-2012 | 2.1416084% | 1.7080745% |
| Apr-2012 | 2.0497165% | 1.7561983% |
| May-2012 | 1.7826087% | 1.4425554% |
| Jun-2012 | 1.9548219% | 1.5447992% |
| Jul-2012 | 1.7741238% | 1.3853258% |
| Aug-2012 | 1.8630849% | 1.3340174% |
| Sep-2012 | 1.9896194% | 1.3839057% |
| Oct-2012 | 1.4642550% | 1.2787724% |
| Nov-2012 | 1.8965517% | 1.4307614% |
| Dec-2012 | 2.1102498% | 1.6351559% |
| Jan-2013 | 2.1505376% | 1.8896834% |
| Feb-2013 | 2.1030043% | 2.0408163% |
| Mar-2013 | 1.8827557% | 1.8829517% |
| Apr-2013 | 1.9658120% | 1.7258883% |
| May-2013 | 2.0504058% | 1.8791265% |
| Jun-2013 | 2.1729868% | 2.0283976% |
| Jul-2013 | 1.9132653% | 1.9736842% |
| Aug-2013 | 2.2118248% | 2.1265823% |
| Sep-2013 | 2.0356234% | 2.1739130% |
| Oct-2013 | 2.2495756% | 2.2727273% |
| Nov-2013 | 2.1573604% | 2.2670025% |
| Dec-2013 | 1.9401097% | 2.3127200% |
| Jan-2014 | 1.9789474% | 2.2055138% |
| Feb-2014 | 2.1017234% | 2.4500000% |
| Mar-2014 | 2.1419572% | 2.2977023% |
| Apr-2014 | 1.9698240% | 2.2954092% |
| May-2014 | 2.0510674% | 2.3928215% |
| Jun-2014 | 1.9599666% | 2.2862823% |
| Jul-2014 | 2.0442219% | 2.2828784% |
| Aug-2014 | 2.1223471% | 2.4789291% |
| Sep-2014 | 1.9950125% | 2.2761009% |
| Oct-2014 | 1.9510170% | 2.2222222% |
| Nov-2014 | 1.9461698% | 2.1674877% |
| Dec-2014 | 1.6549441% | 1.6216216% |
| Jan-2015 | 2.1982742% | 1.9607843% |
* Nominal wage growth consistent with the Federal Reserve Board's 2 percent inflation target, 1.5 percent productivity growth, and a stable labor share of income.
Source: EPI analysis of Bureau of Labor Statistics Current Employment Statistics public data series
What to Watch on Jobs Day: Signs of a Tightening Labor Market?
The economy is slowly recovering from the Great Recession. We saw stronger job growth in 2014 than in 2013 or 2012. In 2015, I hope to see signs of even stronger job growth, pulling the missing workers back into the labor force, and achieving decent, if not strong, wage growth for most. I’ll be looking at these factors when the jobs report comes out tomorrow and throughout the year.
First, jobs growth. If we continue to see the average rate of job growth experienced in 2014, it will be the summer of 2017 when we return to pre-recession labor market health. 2014’s rate of job growth was a positive step, but I’m hoping for even more.
Second, labor force participation. While the unemployment rate continued to fall through 2014, it remains elevated across the population (by age, race, gender, education, sector, occupation)—and even so, it does not reflect the full picture of the labor market. Some of the decline is due to an increase in employment, but some of it is due to a drop in labor force participation. Between November and December 2014, 70 percent of the decline in the number of unemployed people was caused not by workers finding jobs but by people leaving the labor force, or not entering it in the first place.
To better explain this trend, we’ve been tracking what we call the “missing workers.” These are people who have left (or never entered) the labor force, but who would be working or looking for work if job opportunities were significantly more robust. Because jobless workers are only counted as unemployed if they are actively seeking work, these missing workers are not reflected in the official (U3) unemployment rate. We compare today’s labor force participation rate with projections based solely on structural changes in the workforce—like the retiring baby boomers—and find that there are currently 6.1 million missing workers. If these missing workers were actively looking for work, the unemployment rate would be 9.1 percent.
Obama’s Budget: Mostly a Political Document, and That’s Just Fine
This post originally ran on the Wall Street Journal‘s Think Tank blog.
The White House released its annual budget on Monday for fiscal year 2016. On the one hand, this may seem like a low-value exercise, given the dim prospects for its major initiatives passing a Republican-controlled Congress. But on the other hand, the raft of stories written about it prove the president continues to have unrivaled power in setting the terms of policy debate.
And the terms set by the 2016 budget are really useful.
Most of the big-ticket items were previewed: significant increases on tax rates for the highest-income households on income they receive simply from wealth-holdings, higher taxes on large transfers of wealth, tax cuts for low- and middle-income taxpayers, and substantial spending increases on community colleges, early childhood care, and infrastructure.
One item that wasn’t telegraphed by the White House included corporate tax reforms that would impose a minimum 19% tax on foreign earnings of U.S. firms with no opportunity for deferral. This is a very big step in the right direction, if still a little shy of perfect since deferral should be ended and U.S. firms should be taxed at the going corporate income tax rate regardless of where income is earned. But 19% is a lot better than today’s implicit 0% on income held abroad. Further, a large chunk of the budget’s infrastructure proposals is financed by a one-time tax of 14% on accumulated earnings of U.S. corporations held abroad. Again, this is much better than the frequently floated alternative of allowing U.S. firms to repatriate their foreign-held earnings at a preferential rate.