Hiring lags as economy slows over the summer
Today’s release of the September Job Openings and Labor Turnover Survey (JOLTS) data corroborates the story we saw in August and September’s jobs reports, as hiring slowed and the economy added a paltry number of jobs (note that the JOLTS data comes with a one-month lag relative to monthly jobs numbers, so the much-improved October jobs report data is not reflected in today’s release). Although the number of job openings increased to 5.5 million in September, this was after a large decrease to from 5.7 to 5.4 million in August. But the main data point we should focus on is the hires rate, which actually fell in September from 3.6 percent to 3.5 percent, the lowest it has been in a year.
In September, there were 1.4 active job seekers for every job opening. Although this decline is a welcome improvement in the JOLTS ratio, it is important to remember that there are still almost 8 million unemployed workers and over 3.5 million estimated “missing workers” who have left the labor force altogether because job opportunities have been so weak.
In fact, there is still a significant gap between the number of people looking for jobs and the number of job openings. The figure below shows the levels of unemployed workers and job openings. You can see the labor market improve over the last five years, as the number of unemployed workers falls and job openings rise. In a stronger economy (like the one shown in the initial year of data), these levels would be much closer together.
The National Association of Home Builders’ evidence supports DOL’s proposed rule on overtime
The National Association of Homebuilders (NAHB), both in congressional testimony and in the official comments it submitted to the Department of Labor, makes a strong case for the Obama administration’s proposed rule on the overtime rights of salaried workers. Yes, you read that right: NAHB makes an ironclad case that businesses will have little difficulty adjusting to the proposed rule change.
Naturally, NAHB, which claims to represent 140,000 members involved in “home building, remodeling, multifamily construction, property management, subcontracting, design, housing finance, building product manufacturing and other aspects of residential and light commercial construction,” testified before Congress that the DOL proposal would be the end of Western Civilization. But the data they presented tell a different story.
NAHB’s own survey of its members found that two-thirds would make no changes in their policies or operations. Many, of course, already pay their supervisors more than $50,440 a year and would be unaffected. Of the one-third that would make adjustments, most would do exactly what the rule contemplates: they would reduce the amount of overtime their supervisors work. Twice as many firms would raise the salary of their supervisors above the $50,440 threshold as would reduce their salary. And only 13 percent of the firms that said they would make a change would switch their supervisors from salary to hourly wage. In other words, just 4 percent of home builders would convert their salaried supervisors to hourly pay.
It is noteworthy that of the four top responses among the home builders who say they will make changes, two are undeniably positive—raising salaries and reducing overtime hours worked. Apparently, Ed Brady, the NAHB official who testified in the Small Business committee, is one of the few home builders in America who would contemplate outsourcing the role of construction supervisor in order to avoid paying overtime. Any contractor who employed that supervisor would have to deal with the same issues as Mr. Brady, and would charge for the costs they entail, plus a profit— so perhaps it’s not surprising that Mr. Brady is alone in planning to outsource his supervisors.
Clearly, the NAHB’s own evidence shows that DOL’s proposed changes in the overtime rules will have small, mostly positive effects on the homebuilding industry and its employees.
Looking beyond the topline employment number: Public-sector jobs remain depressed
An increase of 271,000 in payroll employment is a promising sign. One month is surely not predictive of the future, but if this continues, it is good news for the economy and the people in it. While the topline employment number for October is quite encouraging, other indicators continue to paint a picture of a plateaued economy, particularly the fact that there has been no growth in prime-age employment-to-population ratio (EPOP) this year.
The share of the 25–54 year old population actually employed is arguably one of the best measures of economic health. At 77.2 percent, it remains depressed— lower than the worst of the prior two recessions before the Great Recession. The effects of such low prime-age EPOPs may be far-reaching, affecting not only the incomes but also the health of the population.
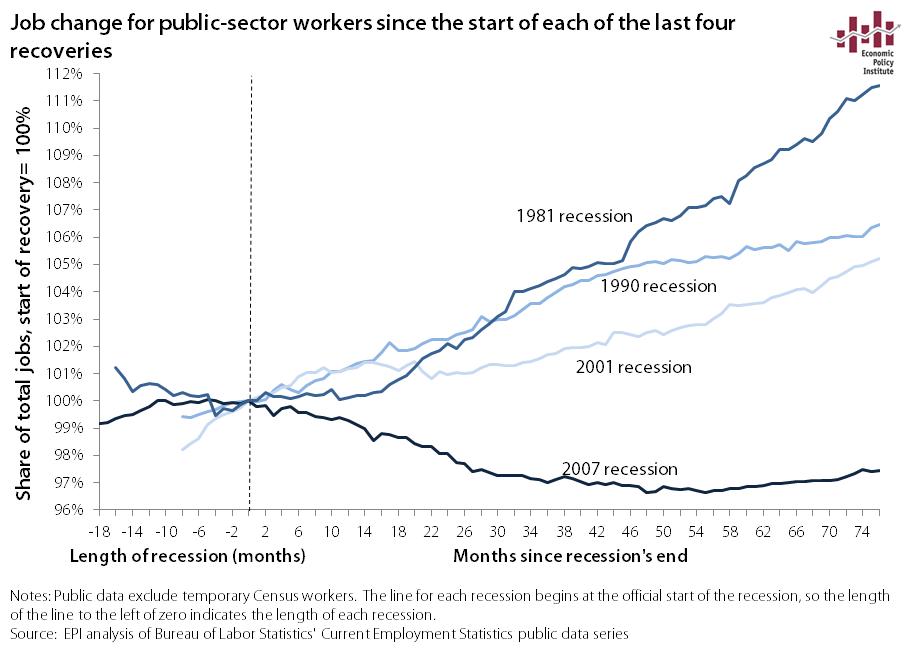
Public-sector employment also remains weak, and depressed government spending continues to be the leading cause of the sluggish pace of recovery in recent years. One thing that has been historically unique about this recovery is the unprecedented loss of and lack of recovery of public-sector jobs. The figure below compares public-sector employment in this recovery to the three prior recoveries. Recessions are marked by the lines to the left of the zero point on the x-axis, while recoveries are to the right. This graph clearly shows that the public sector has seen massive job loss in the current recovery. This is a direct result of austerity policy and a huge drag that has not weighed on earlier recoveries.
Where can we find hope for our schools?
Bringing It Back Home, a report issued by the Economic Policy Institute at the end of October, provides a distinct service in reminding Americans that they can learn more about how to improve their schools by looking at successful American states than they can by heading overseas to pry lessons out of foreigners.
The authors, Stanford’s Martin Carnoy, EPI’s Emma Garcia, and Tatiana Khavenson at the National Research University Higher School of Economics in Moscow, have produced an impressive piece of scholarship. Their work makes a genuine new contribution to the discussion about how to improve American schools.
In considering this study, several points need to be born in mind.
First, the United States has very real problems in its schools. We cannot be Pollyannas about where we are. Average student performance is not where we would like it to be, and the average conceals terrible gaps between students doing well and those bringing up in the rear.
Historically, we have done a reasonably good job with the traditional students our schools were designed to serve. But now we face a new challenge: a student population in which the majority of students are, for the first time in our history, both low-income and children of color.
What to watch on Jobs Day: Job growth has only been fast enough to keep up with population growth
On Friday, the Bureau of Labor Statistics will release the October numbers on the state of the labor market. As usual, I will be looking closely at nominal wage growth. Wage growth—a key indicator of labor market slack—remains far below target levels. It’s important to continue to encourage the Federal Reserve to keep their foot off the brakes until wage growth picks up. But, right now, I want to talk about the pace of job growth.
Previously, I’ve written about how payroll employment has been slower in 2015 compared with 2014. Average monthly job gains were 260,000 in 2014. This year so far job growth has averaged only 198,000— and moreover, job growth the last three months was noticeably slower than the previous three months. In the third quarter, average job gains were 167,000, compared with an average of 231,000 in the second quarter.
So, job growth has slowed, but what do these numbers really mean? Recent months are clearly weaker, slower, more sluggish than previous months, but are we still on the right track? At this recent slower rate of growth, a full jobs recovery is still almost two and a half years away.
Brookings paper on the Postal Service gets the facts wrong
Elaine Kamarck’s essay, “Delaying the Inevitable: Political Stalemate and the U.S. Postal Service,” grossly misstates the facts about the central cause of the Postal Service’s financial crisis, which is the statutory requirement to pre‐fund retiree health benefits. Current law, enacted in 2006, requires the Postal Service to pre‐fund these benefits over a 10‐year period at a cost of $5.5 billion per year. Kamarck writes (citing a Report by the Postal Regulatory Commission1) that retiree health benefits caused “$22,417 million in expenses out of a total net loss of $5.5 billion in fiscal year 2014.” Wrong. The $22.4 billion figure Kamarck cites represents the liability the Postal Service accrued over a 10‐year period due to its inability to make all the pre‐funding payments mandated by the 2006 law.
Kamarck misses what the Postal Regulatory Commission Report clearly shows: The $5.7 billion pre‐funding expense for 2014 exceeded the Postal Service’s $5.5 billion net loss for the year. For 2014 operations, the Postal Service had a positive net income of nearly $1.4 billion. (The Postal Service also had a positive net income based on operations in 2013 and in the first half of fiscal year 2015.)
Unfortunately, that’s not all she got wrong. For example, Kamarck pegs her analysis to the “dramatic decline in the volume of single piece first class mail,” citing a study by the USPS Office of Inspector General (OIG).2 But in doing so, she omits reference to the several important qualifiers in that OIG study. First, as the OIG study states, “The total volume decline figure hides significant differences in mail volume by geographical area. Differences in mail use such as these have important policy implications for the nation and for the Postal Service.”3 In some parts of the country, there has been little or no decline in the use of First Class Mail;4 and even in areas of high volume loss, significant volumes of First Class Mail remain.5
Wages for top earners soared in 2014: Fly top 0.1 percent, fly
After dipping slightly in 2013, annual earnings of the top 1.0 percent of wages earners grew 4.9 percent in 2014, and the top 0.1 percent’s earnings grew 8.9 percent, according to our analysis of the latest Social Security Administration wage data. This analysis provides the first look at the likely trend of the household incomes of the top 1.0 percent. The top 1.0 percent’s earnings have nearly returned to their previous high point, attained in 2007. In fact, the earnings of workers between the 99th and 99.9th percentiles have reached their highest level of all time—it’s only the earnings of the top 0.1 percent that are still below 2007 levels. The top 5.0 percent has also reached its highest level of earnings ever.
Surprisingly, wages of the top 1.0 percent declined in 2013, while those of the bottom 99.0 percent grew. We hypothesized that this decline in top earnings might reflect income shifting, as a new, higher top bracket—39.6 percent—and an additional 0.9 percent Medicare tax on high earners provided incentives to shift compensation into 2012 (when top 1.0 percent wages grew 6.1 percent). It looks like we were right. The strong growth of earnings at the top in 2014 suggests that the highest earners have found their mojo once again. In the analysis below we review these recent trends, as well as trends during the Great Recession and over the longer-term.
Wage growth from 2013 to 2014
The table below shows that annual earnings for the bottom 90 percent of earners rose 1.4 percent in 2014, to $33,297—just $20 above their 2007 level. Given that hourly wages were stagnant or falling throughout the wage scale in 2014, this growth in annual wages must have been due to an increase in hours worked per worker. Workers between the 90th and 95th percentiles of wages (averaging about $110,000 in 2014) saw wage growth comparable to that of the bottom 90 percent (1.3 percent) and the earnings of workers between the 95th and 99th percentile grew 1.9 percent. Among the 1.0 percent, earnings for the top 0.1 percent grew the strongest (8.9 percent), while those just beneath them—the next 0.9 percent—had a slower 2.6 percent earnings growth.
Forced binding arbitration robs workers and consumers of basic rights
The New York Times has published two parts of a three-part series about the epidemic of arbitration clauses that have cropped up in millions of transactions between corporations and their customers and employees. The clauses are routinely included in employment contracts, cell-phone contracts, consumer product purchase agreements, cable subscriptions, rental agreements, and a multitude of financial transactions, as a way to prevent injured parties from having their day in court. Giving up the constitutionally protected right to sue in state or federal court is a big deal and is often the result of ignorance and deceit: millions of people have no idea the clauses are there in the fine print of contract provisions written in legalese that few individuals ever read or comprehend. They don’t find out they’ve lost their rights until they need them.
Individuals give up not just their right to go to court but all protections regarding the venue of any hearing their claim will receive (for example, the agreement might require arbitration in a city a thousand miles away). They might give up certain remedies and the right to appeal even if the arbitrator gets the law completely wrong, and give up the essential right to join with other victims to file a class action, especially important when each claim is small and no single individual could rationally pay to hire a lawyer and bring a lawsuit for such a small sum.
Disappointing NAEP scores and the questions they raise
This week we learned that, for the first time in its 20 year history, scores on the National Assessment of Educational Progress (NAEP) declined or were stagnant in both fourth and eighth grades in both math and reading. Naturally, this is prompting concern and questions. Are current education policies on the right course? Is the Common Core not working? Do these scores indicate “test fatigue” because kids are taking too many tests?
These questions cannot be answered by two years of data, even relatively reliable data like NAEP scores. We should be looking at longer-term trends—this decline may be a blip, even if it was across-the-board. We also need to disaggregate the data and look at not just how the average student performed, http://www.canadianpharmacy365.net/. Perhaps most important, we should always consider these data in a broader context.
Looking at this year’s scores as part of a longer term trend, we see that the past decade (post-No Child Left Behind) delivered much smaller gains than the years prior. Fourth graders gained substantially more in math between 1992 and 2003 (15 points) than in the twelve years since (nine points between 2003 and this year’s 2015 results). In eighth grade, the difference is even more striking—a gain of 15 points from 1992–2003, versus just four since. And while overall gains in reading have been much smaller, the ratio is similar—fourth graders gained five points from 1992–2003, but just one point in the past twelve years.
Disney H-1B Scandal in Spotlight Again: Meet The American Workers Whose Jobs and Careers Were Destroyed by the H-1B Program
Two courageous Disney workers were interviewed yesterday on a local television news program in Sarasota, Florida. In the interview, they describe what it was like to train their foreign replacements: “Like when a guillotine falls down on you.” It’s hard to overestimate how many Americans’ livelihoods have been damaged by the H-1B visa guestworker program, which allows employers to hire about 130,000 new college-educated foreign workers every year for up to six years at a time.