GAO report on segregation misses the bigger picture
Last week, the Government Accountability Office (GAO) issued a misleading report on school segregation, which I discussed with NAACP Legal Defense Fund President Sherrilyn Ifill and others on the Diane Rehm Show.
The takeaway line of the GAO report was:
From school years 2000-01 to 2013-14, the percentage of all K-12 public schools that had high percentages of poor and Black or Hispanic students grew from 9 to 16 percent.
(When the GAO referred to “poor” students, it was not really speaking of poor students, but rather of those from families with incomes less than nearly twice the poverty line and who are eligible for subsidized lunches in schools.)
Not by coincidence, the GAO report was released on Tuesday, May 17, the 62nd anniversary of the Supreme Court’s Brown v. Board of Education decision banning school segregation. So it was not unreasonable for those who did not read the GAO report very carefully to conclude that it described a dramatic increase in racial segregation over the last 13 years.
But it did not, and could not.
Arguments that better overtime pay protection means less flexibility are untrue
The Department of Labor has issued a new rule, which expands the right to be paid time-and-a-half for overtime to salaried employees who earn less than $47,476 a year. Business groups that oppose the new rule claim that salaried employees will lose important work schedule flexibility when they become eligible for overtime pay. But the evidence shows this fear is unfounded, and, in fact, salaried workers who earn less than $50,000 a year currently have barely more flexibility at work than hourly paid employees.
An EPI analysis using General Social Survey data by Penn State labor economist Lonnie Golden shows that:
- Almost half—47 percent—of salaried workers earning less than $50,000 a year report that on a daily basis they “never” or “rarely” are allowed to change their work starting time and quitting times, while only 20 percent of salaried workers who earn $60,000 or more per year report never or rarely being allowed to change their schedules.
- Salaried workers earning less than $50,000 a year have no more ability to take time off during work for personal or family matters than hourly workers at the same level. Thus, “switching” employees from salaried to hourly status or requiring employers to track or monitor their hours for purposes of overtime pay would not reduce this valuable type of work schedule flexibility for employees. If we consider regularly being required to work overtime an indicator of inflexibility in one’s work schedule, salaried workers earning between $25,000 and $50,000 a year have about the same or an even greater likelihood of working mandatory overtime than their hourly counterparts. Thus, raising the overtime pay salary threshold for exemption to $47,476 should, if anything, provide the newly eligible workers somewhat greater flexibility to refuse unwelcome work beyond their usual number of hours per week.
In light of these conditions and findings, it is unsurprising that salaried workers generally report higher levels of work-family conflict and work stress than do hourly paid workers. It is also important to note that nothing in the new rule requires any employer to change any employee from salaried pay to hourly pay. That decision is entirely within an employer’s discretion. Many employers, including small business owners such as the National Retail Federation’s witness at a congressional hearing last October, already track the hours of salaried employees and provide comp time and bonuses based on overtime hours.
Explaining the differences between EPI and DOL estimates of workers affected by the new overtime salary threshold
In our report on the new overtime rule, EPI estimates that it will directly benefit 12.5 million workers. At first blush, our evaluation of the impact of the rule differs significantly from the widely circulated Department of Labor (DOL) assessment that 4.2 million workers will directly benefit from raising the salary threshold—meaning they are currently legitimately exempt because of their duties, but will be covered by the new threshold. DOL also notes that 8.9 million workers, meanwhile, will have their rights strengthened by the higher salary threshold, for a total of 13.1 million directly affected by the rule (600,000 more than our estimate). Additionally, of the 8.9 million salaried workers whose overtime rights would be strengthened, DOL notes that about 732,000 regularly work more than 40 hours a week, but are currently incorrectly classified as ineligible for overtime—bringing the total number of workers DOL estimates will be newly eligible for overtime pay up to 5 million.
We believe that many more workers will be newly eligible for overtime pay. Our assessment differs from DOL’s because the department assumes, incorrectly in our view, that overtime eligibility was not eroded by changes to the OT rules implemented by the Bush administration in 2004. We provided detailed evidence last year showing that overtime eligibility has been severely eroded since the late 1990s, when DOL computed the exemption probability estimates by occupation that it still relies on today. We concluded that:
…reliance on judgments made in 1998 provides an unreasonably sunny view of today’s workplaces that ignores changes in the law implemented in 2004, various court decisions, and the corresponding behavior of employers to limit the ability of workers to obtain overtime pay.
The 4.2 million employees DOL estimates will be newly entitled to overtime pay are limited to those who both meet duties tests establishing that their primary duty is executive, administrative or professional, and earn a salary higher than the old exemption threshold ($23,660 a year) but less than $47,476. For example, an accountant earning $40,000 or a bank branch manager earning $45,000 are legitimately exempt under the current rules but will be entitled to overtime pay because their salary is below the new threshold.
How one Missouri school district took on poverty (and a tornado)
This blog post originally appeared on TalkPoverty.org.
Joplin, Missouri, a small city in the Southwest corner of the state, is probably best known for the devastating tornado that ripped through it on May 22, 2011. The storm killed 161 people and caused more than $2 billion in damages. Less well known is the widespread and growing poverty that is damaging the community—especially its students and schools—in quieter but no less harmful ways. But Joplin has begun to rebound, and the rest of the country should take note.
Three years before the tornado, CJ Huff, the superintendent of nearby Eldon, Missouri, was hired to lead Joplin’s 18 schools. His main charge was to raise the district’s graduation rate, which at the time hovered just above 73 percent. It quickly became apparent to Huff that the growing rate of child poverty stood in the way of reaching that goal as well as his broader aspirations to prepare students for college, careers, and active participation in a democratic society.
The Joplin school team conducted nine months of face-to-face talks with parents, teachers, and the community’s faith, business, and human services agency leaders in order to assess the school district’s needs. They discussed everything from the transition between elementary and middle school, to mental health, to mentorship. The plan they ended up with—called “Bright Futures”—is now a blueprint for school transformation in dozens of districts across the South and Midwest. Seven years later, Joplin’s graduation rate has risen to 87 percent. Here’s how Huff and the Joplin community did it.
As talk grows of a June interest rate increase, where’s the data to support it?
This piece originally appeared in the Wall Street Journal’s Think Tank blog.
Weak data had convinced many that the Federal Reserve was unlikely to raise interest rates in June, but in recent days multiple Fed policymakers have suggested that an increase should be on the table in the near future. What’s unclear is why.
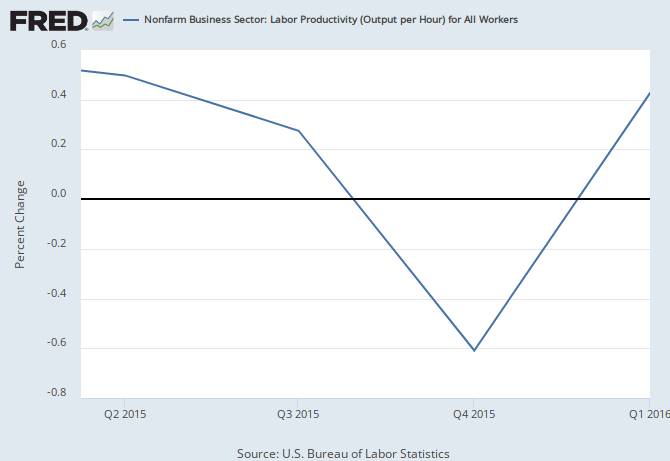
Little new data have emerged to suggest that the economy is much better than it was six or nine months ago. Since interest rates were raised in December, in fact, the pace of economic improvement has slowed almost to a stall.
Gross domestic product grew at 1.4% in the fourth quarter of 2015 and at 0.5% in the first quarter of 2016. These annualized rates represent extraordinarily weak growth over a six-month period, driven by declines in labor productivity (GDP divided by total hours worked in the economy) in both quarters.
This decline in productivity has largely been driven by historically anemic growth in business investment. Basically, in the face of weak demand, businesses have had little incentive to invest in new or better capital stock (physical plants and equipment). A larger capital stock gives workers more and better tools with which to do their jobs, making them more productive. But the extremely sluggish growth in business investment during the recovery has held back productivity growth.
ITC study shows minimal benefits and downplays potentially high costs of Trans-Pacific Partnership
Yesterday, the U.S. International Trade Commission (ITC) released a long-awaited report on the projected economic impacts of the TPP agreement. The report is remarkable for its frank estimates of the costs of the agreement, and the minimal benefits it identifies. Overall, the ITC projects that by 2027, the TPP will increase U.S. exports to the world by $27.2 billion (1.0 percent, as shown in Table 2.2) and U.S. imports from the world by $48.9 billion (1.1 percent), increasing the U.S. global trade deficit by $21.7 billion. All else equal, this rise in the trade deficit would put downward pressure on U.S. GDP. Nonetheless, the report concludes that over the next 16 years, the agreement will increase U.S. national income by $57.3 billion, 0.23 percent. This GDP gain stems largely from the ITC’s adoption of the standard full-employment assumption in modeling the TPP’s effects. There may have once been a time where such an assumption was warranted, but it seems highly inappropriate to apply to an economy that has been operating beneath full employment for at least 8 years and counting.
Dean Baker notes that even if the too-rosy GDP estimate were correct, it means that, “as a result of the TPP, the country will be as wealthy on January 1, 2032 as it would otherwise be on February 15 2032.” Worse yet, the ITC has a terrible record of forecasting the actual impacts of trade and investment deals, both overall and at the industry level. There is little reason to believe that this study will yield better results than past ITC efforts if the agreement is approved and implemented. In practice, whatever the ITC forecasts, U.S. trade and investment deals been near-inevitably followed by growing trade deficits and downward pressure on the wages of U.S. workers. There is every reason to expect that the TPP agreement will reinforce these trends.
What will an updated overtime rule mean for millions of workers?
Tomorrow, the Vice President is expected to announce the U.S. Department of Labor’s issuance of the final rule on overtime for salaried employees. Rumor has it that the rule will guarantee overtime pay to anyone working more than 40 hours in a week if their salary is less than $47,500 a year or $913 a week. That is less than DOL proposed last year, but still a very significant increase that will mean millions of employees will get raises or have their weekly hours scaled back to a more humane level. About 12.5 million employees will either be newly entitled to overtime pay or will have their rights strengthened so that they don’t have to rely on a complicated analysis of their job duties to determine that they have a right to time and a half for their overtime hours.
Reporters and Hill staffers wonder who are the people who will get raises, a question that is both easy to answer and difficult. The easy part is that employees earning close to, but less than, the new threshold will get raises if they typically work overtime. It will be cheaper and easier for the employer just to give them a raise of a couple of thousand dollars than to track their hours and pay them time and a half.
An obvious example is postdoctoral researchers, who typically earn $42,000 to $45,000, who work 50 to 60 hours a week, or more, conducting critical cancer and other biomedical research, physics, chemistry, biology, or math research. Paying them overtime for their normal, excessive workweek would be so expensive that their universities will give them a raise above the threshold in order to avoid it. The result will not just be better-rewarded researchers, but less turnover and stronger commitments to work that might benefit the entire nation and even the world.
In the comments it submitted for the rule-making record, the American Bankers Association provided good examples of employees in its industry who will benefit. The Bankers testified that banks commonly have various managers, including check processing managers, branch managers, IT managers, credit analysts, and compliance officers, who are currently treated as exempt and are denied overtime pay. But in many areas, their median salaries are fairly low: $45,400 for branch managers in Akron, Ohio and $46,300 in El Paso, Texas. Check Processing Managers in Little Rock, Arkansas earn a median salary of $45,800 while they earn a median $45,200 in Brownsville, Texas. It’s likely that their employers will give them all raises if they currently work even four or five hours of overtime a week.
It gets more difficult to predict when the salaries are lower. Will a university that pays its postdocs an exploitative $38,000 a year give them a raise above the new threshold? It probably depends on whether the postdocs are working more than 50 hours a week, at which point it’s cheaper to pay the threshold salary for exemption than to pay for each hour of overtime at 1.5 times the regular rate of pay.
Many reporters have told me that they are paid less than the salary threshold but are treated as exempt and denied any overtime pay. Reporters in high-cost areas such as New York, Washington, DC, or Boston are almost certainly going to receive salary increases, unless their pay is atypically low. I imagine that even in the South, many reporters are paid enough (and their hours are long enough) that a salary increase will be cheaper for their employer than paying overtime.
They probably won’t all get salary increases, but 2.6 million salaried employees covered by the Fair Labor Standards Act earn between $23,660 and $47,500. If they work substantial amounts of overtime now, they have a good chance that their salaries will be raised above the new exemption threshold.
Trump’s official tax plan blatantly contradicts his populist rhetoric
It’s pretty clear that pinning Donald Trump down on actual policy specifics is going to be tough. He has released a tax plan (written down on actual paper), and until he decides to tear it up, it’s the best road map we have for what he wants to do with tax policy.
The road map charts the course to really large tax cuts, with the bulk of them going to very-high-income households: At the plan’s core is a mostly-routine Republican tax plan that includes giveaways similar to those intended by Marco Rubio, Jeb Bush, and Ted Cruz. The difference is that the plan throws people off the scent of who it benefits, because it contains some novel (and particularly stupid) detours that make no sense as good policy.
When Trump says things like “But the middle class has to be protected. The rich is probably going to end up paying more,” one might come away with the idea that this is a middle-class focused tax cut. The guts of Trump’s tax proposal, however, reveal how obvious of a giveaway to the already-rich it is. To get an idea of just how much money is being doled out, the Tax Policy Center (TPC) estimates that Trump’s plan would cost about $9.5 trillion over a decade. 35 percent of Trump’s tax cuts go to the top 1 percent of households during the first year of his tax plan (TPC estimates that as households making over $732,323 annually). This is more than the combined share that the 80 percent of us making under $142,601 a year can expect to see. And this regressivity actually grows over time: By 2025, the top 1 percent will take about a 40 percent share of the tax cut – almost equivalent to the combined share that the bottom 90 percent will see. The tax cut’s regressivity is highlighted even further by looking at the share within the top 1 percent. About half of the share going to the top 1 percent is actually going to just the top 0.1 percent – households making over $3,769,396 in the first year.
Explaining to Kevin Drum why we’re not happy about young high school grads’ recovery, and why he shouldn’t be either
Mother Jones’ Kevin Drum seems to dislike a New York Times article calling job prospects for young high school graduates “grim.” Along the way, he directs an odd bit of unprovoked snark at us:
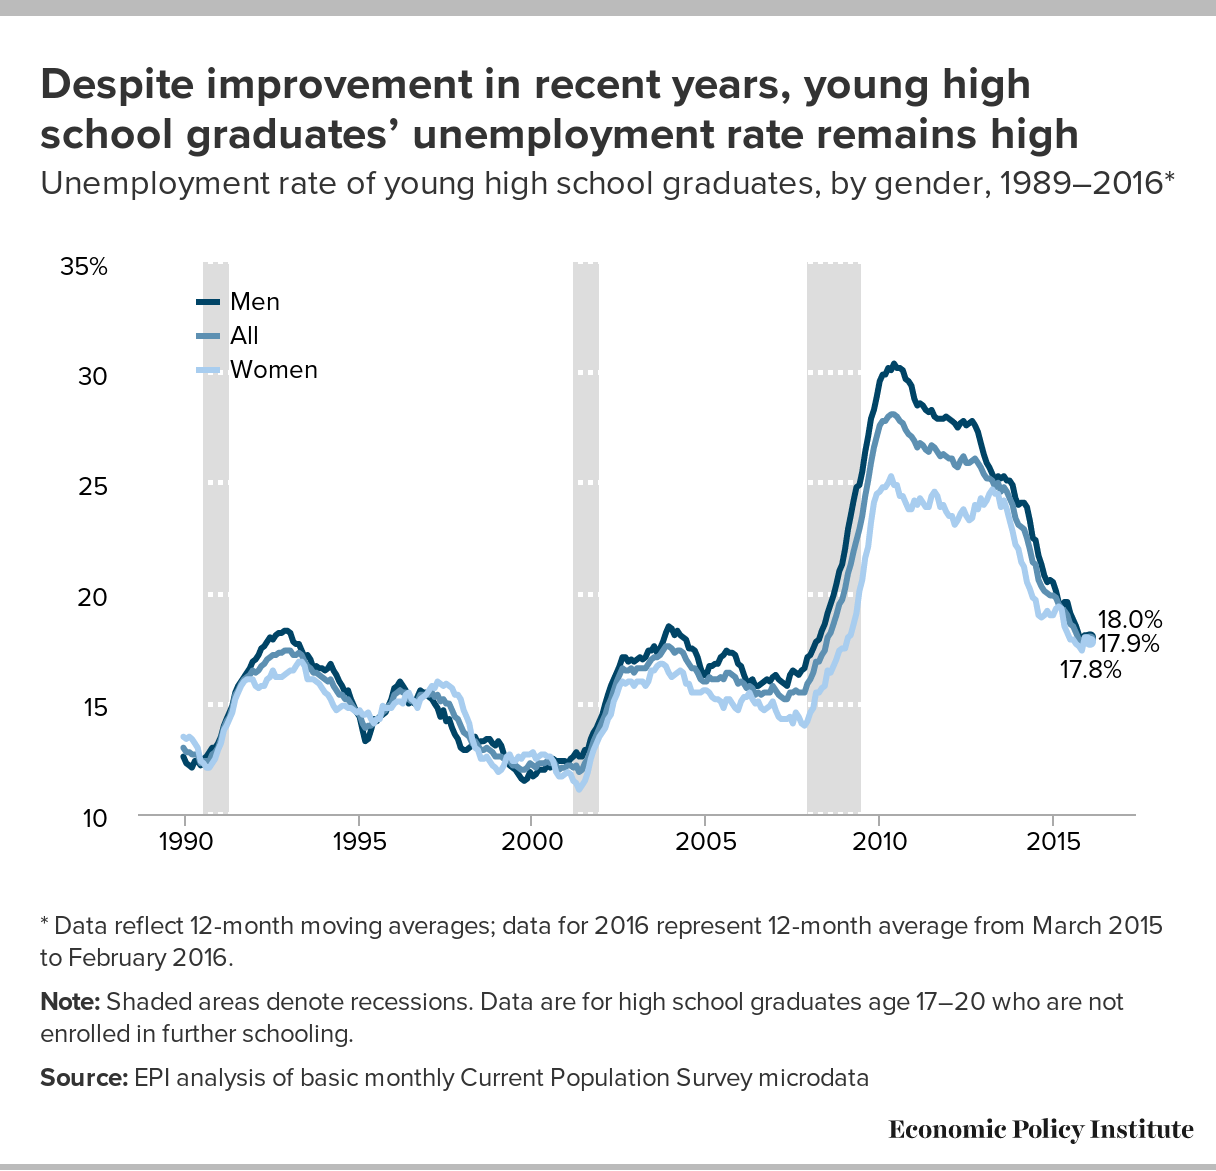
I don’t know how EPI measures unemployment, but the federal government measures it in a consistent way every single month. For young high school grads, the average unemployment rate during the expansion of the aughts was around 11 percent. Today it’s 11.2 percent. In other words, it’s not “pretty poor,” it’s completely normal.
Well, we measure unemployment the same way that the federal government does, even using the same survey. All numbers and methods are described in our Class of 2016 paper from a few weeks ago. The reason we get 17.8 percent while Kevin gets 11.2 percent when looking at unemployment rates for young high school graduates is pretty obvious: we’re looking at 17-20 year old high school graduates who are not enrolled in further schooling while he is looking at 20-24 year old high-school graduates (no college). The numbers in our report also reflect a 12-month rolling average, because we also look at smaller demographic groups where sample size is an issue and want consistency across figures.
A bonus to our data is that we go back to 1989. What this shows is that the 2006 pre-recession trough that we have almost returned to is a pretty low bar for declaring “nothing to see here” on young peoples’ unemployment rates. For the group of young high school grads we look at, the pre-recession unemployment trough was 15.2 percent, but unemployment actually managed to reach 12.3 and 12.0 percent in the unemployment troughs before recessions in the early 1990s and early 2000s. So, yeah, we’re not in love with the 17.9 percent rate we hit in February this year, and we don’t think we’re “wildly misstating” the data to make the case that others shouldn’t be either.
Hires need to pick up to eat away at the weak employment-to-population ratio
On the heels of last week’s latest disappointing jobs numbers, today’s Job Openings and Labor Turnover Survey (JOLTS) report, unsurprisingly, shows little improvement in the labor market. In March, overall job openings rose slightly, while the number of people hired decreased. When we look at these numbers over the year, there has been a marked improvement in job openings—an increase in the rate of job openings (the number of job openings as a share of total employment plus job openings) from 3.5 to 3.9. Over that same period, the hires rate only increased from 3.6 to 3.7—a far slower improvement.
In today’s economy—as opposed to decades past—the listing of job openings is relatively easy and inexpensive, and may not accurately reflect an employer’s efforts to actually fill those openings. Employers may be interested in filling those positions at lower wages than would be required in a stronger labor market. They may not be searching intensively to find workers or willing to fill those positions if they have to offer higher wages. Considering the number of unemployed workers in the economy and the number of missing workers waiting on the sidelines for more opportunities, it seems that many of these openings could be filled if employers were more serious about filing them. It’s fairly straightforward economics at play here. If employers are unhappy with the pool of applicants, they simply might need to improve the job offering—the wages and benefits being offered—to recruit the candidates they desire. When that happens, we should see better wage growth than we’ve seen in the last several years of the recovery.